Project Risk › Top 6 Project Risk Management Tools
6 Best Project Risk Management Tools
What is project risk software?
Project risk software takes the schedule and cost estimate you already have and runs a Monte Carlo simulation over the uncertainties and risk events in it, producing realistic delivery dates and budgets with confidence levels — a P80 finish date, a cost contingency — instead of the single optimistic number a planning tool prints. It answers what a scheduling tool cannot: how likely the plan actually is.
On a schedule, the method is known as quantitative schedule risk analysis (QSRA).
How to choose: three things separate the tools in this category, and they are the three dimensions this review scores — usability (can a planner run an analysis without a statistician on call), technical capability (correlation, risk events with multiple consequences, weather modelling, the mathematics being right), and price (list prices over three years differ by more than a factor of two).
The comparison table below scores all six tools on each.
This review covers project-focused tools — schedule and cost risk analysis. If you are surveying the wider category, including spreadsheet Monte Carlo simulation, decision analysis and enterprise risk platforms, start with our guide to risk analysis software, then come back here for the project tools.
Runs in Excel, so lots of options for bespoke modelling
What you may NOT like:
Excel not ideal for networks
Price
Runs very large schedules: No
Performs update against master schedule
One risk maps to multiple impacts: Manual
Repeatable risk event supported: Manual
Simulation spreadsheets built-in
Weather calendar: No
Create schedule from scratch: No
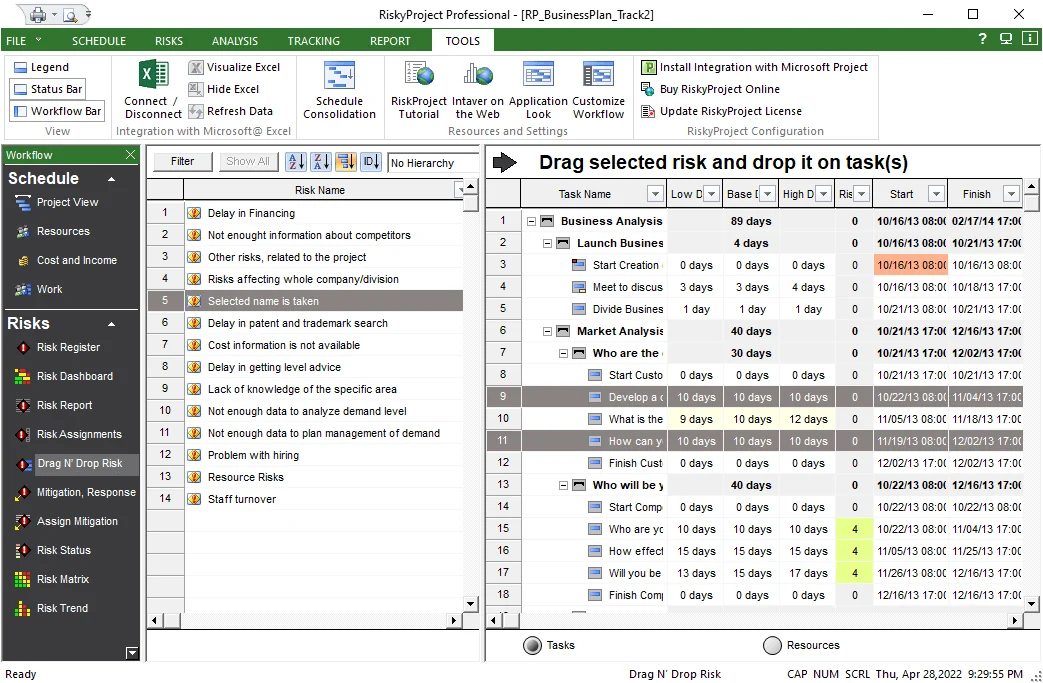
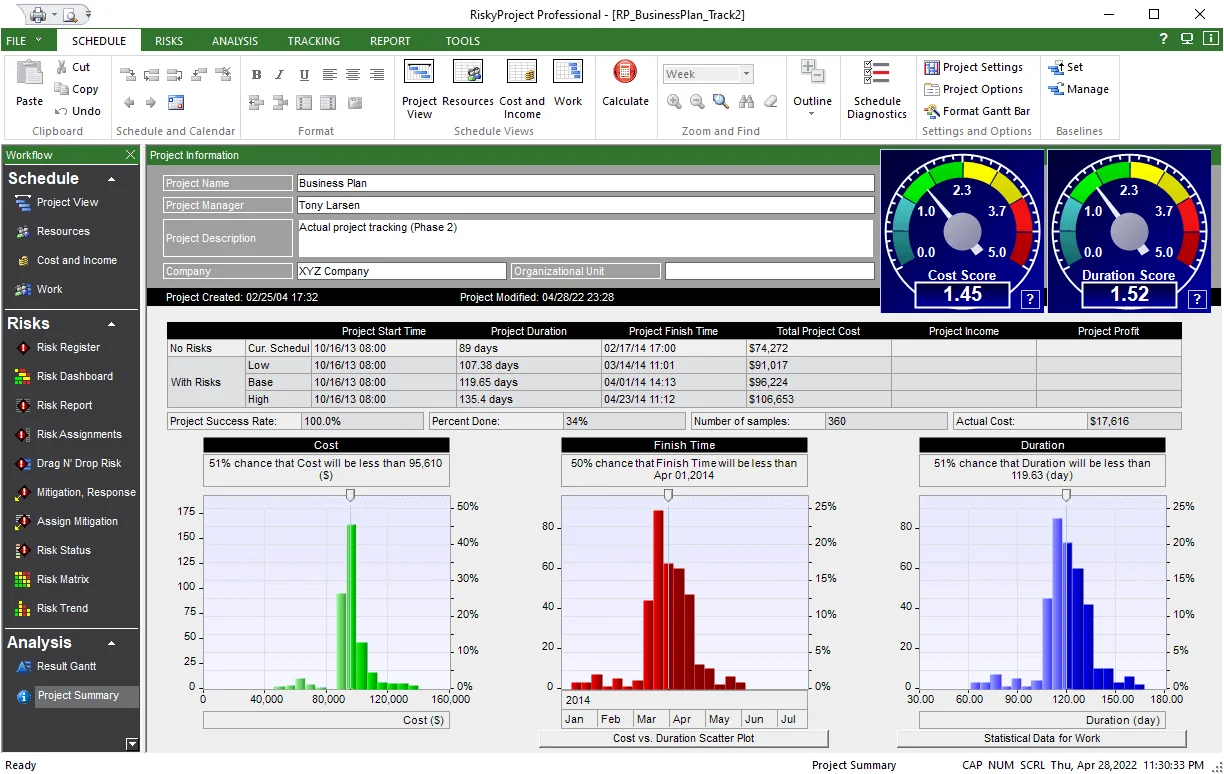
RiskyProject
Cost over 3 years ($)~2,900
What you may like:
Inexpensive
Feature rich
What you may NOT like:
Overly complex interfaces
Aesthetics
Runs very large schedules
?Performs update against master schedule: Unsure
One risk maps to multiple impacts: No
Repeatable risk event supported: No
Simulation spreadsheets built-in: No
Weather calendar
Create schedule from scratch
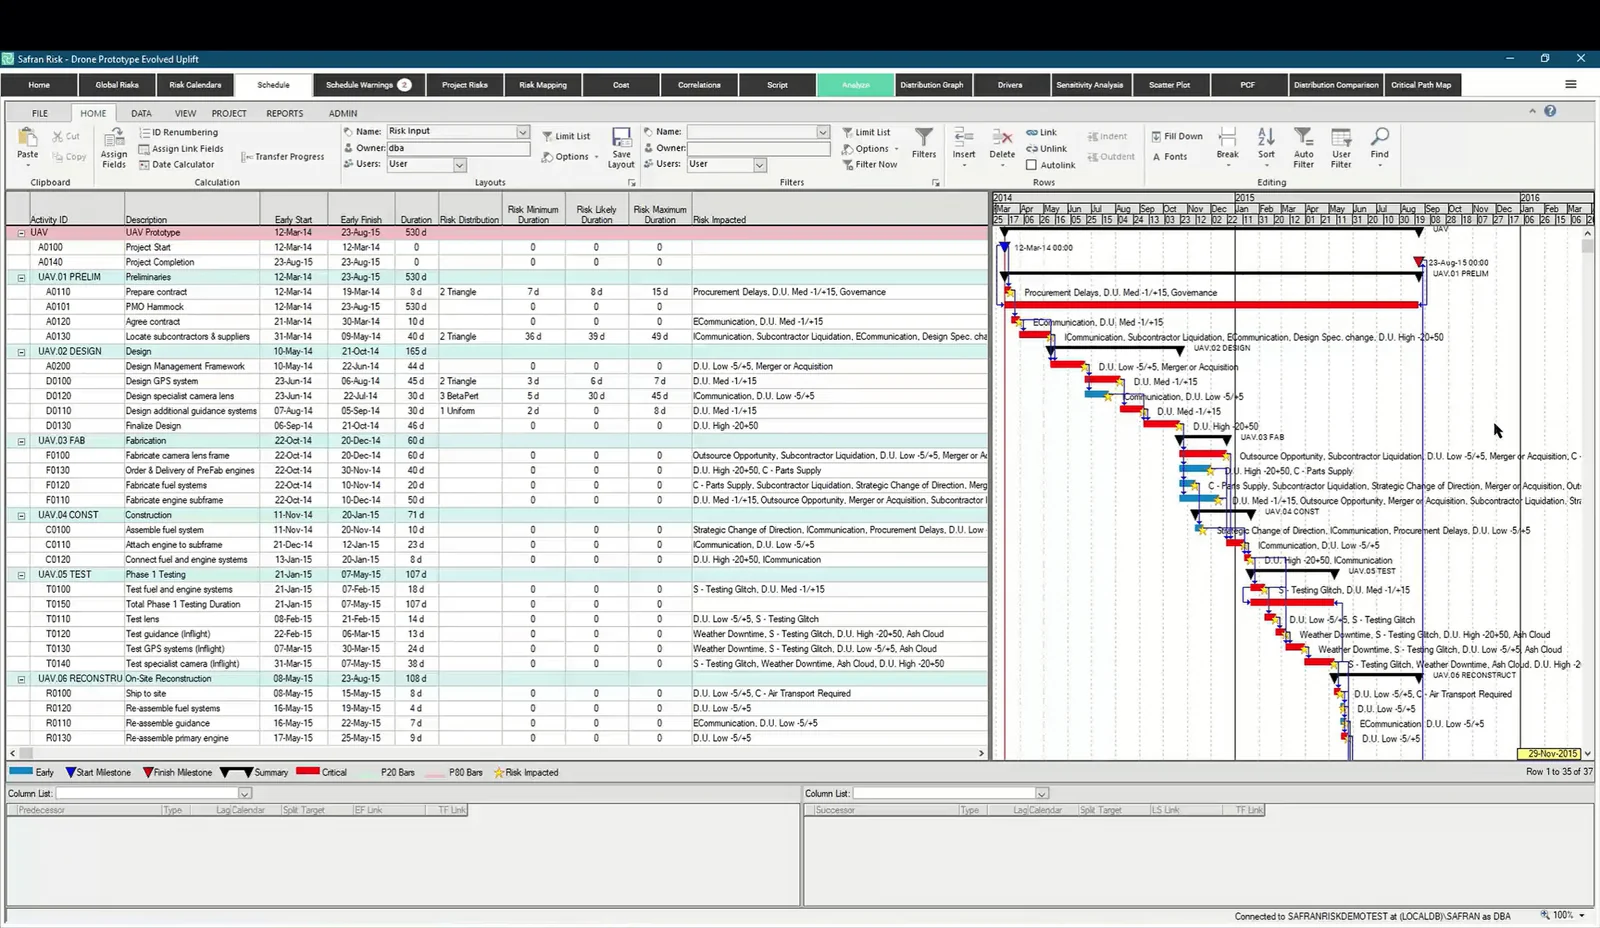
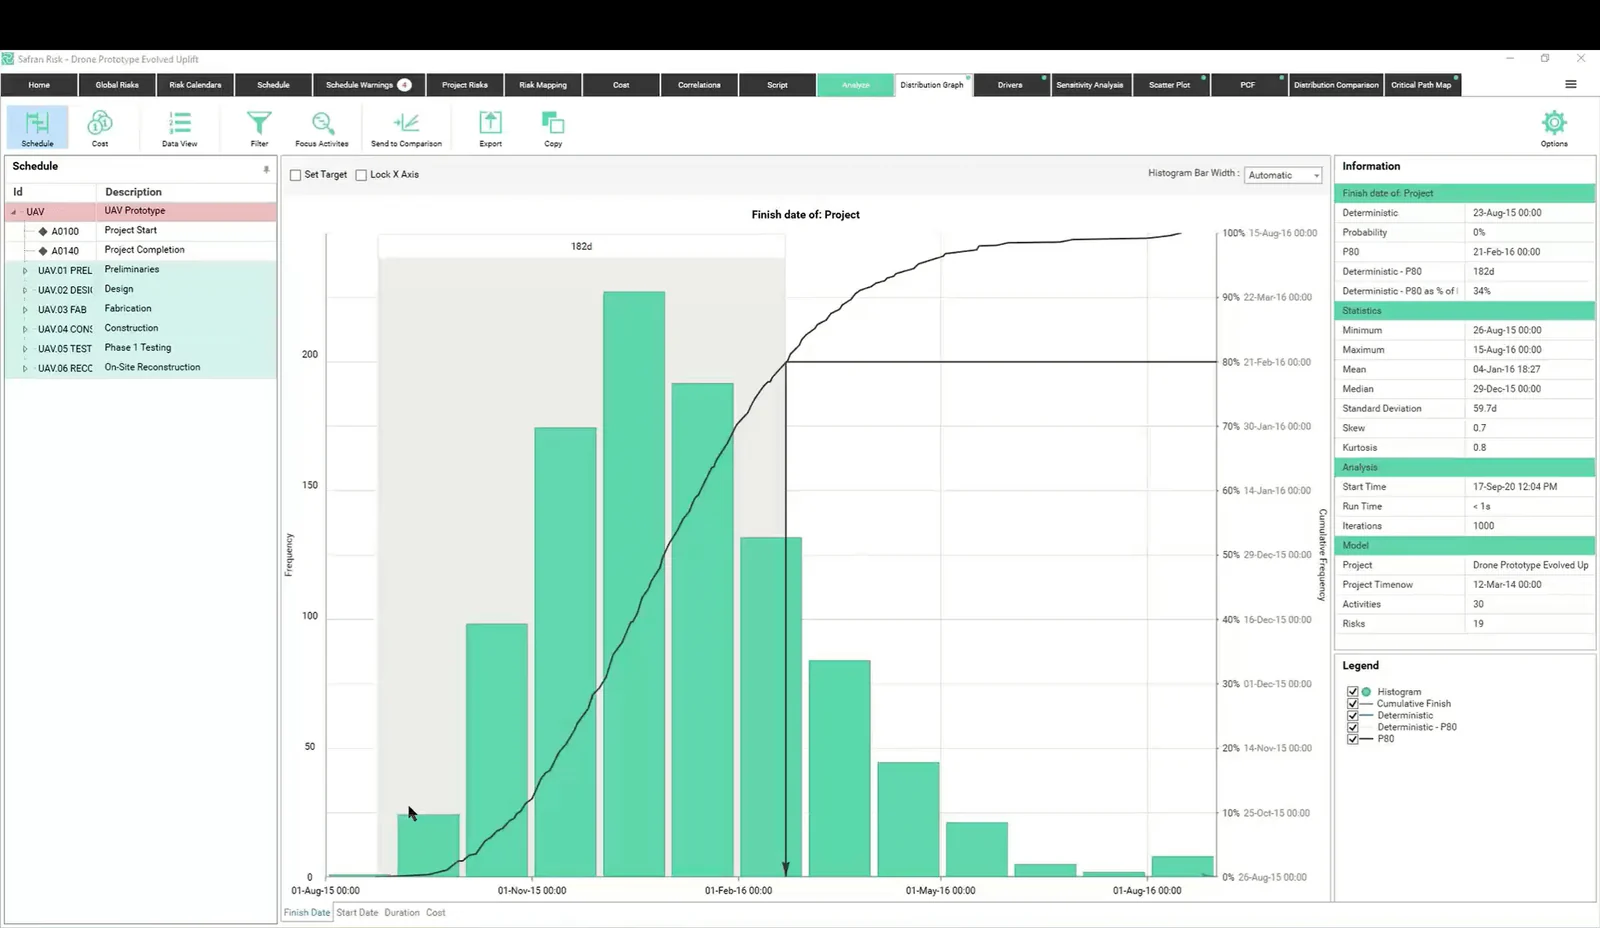
Safran Risk
Cost over 3 years ($)On request
What you may like:
Very similar to PRA, but faster
What you may NOT like:
Limited options for describing risk
Runs very large schedules
?Performs update against master schedule: Unsure
One risk maps to multiple impacts
Repeatable risk event supported: No
Simulation spreadsheets built-in: No
Weather calendar
Create schedule from scratch
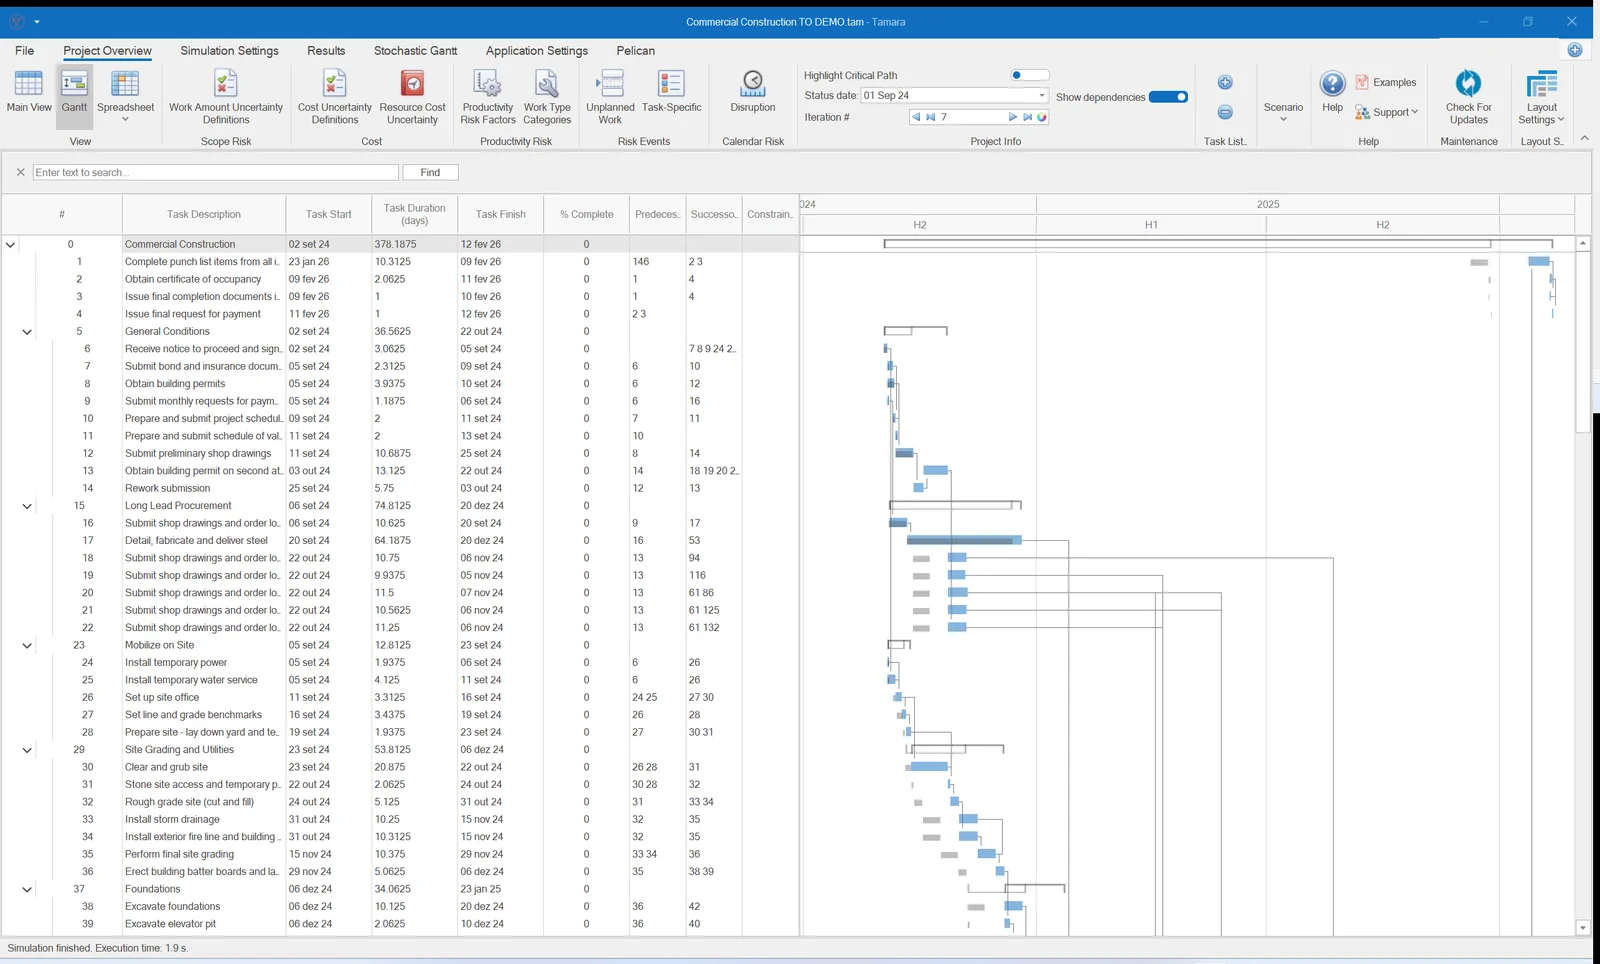
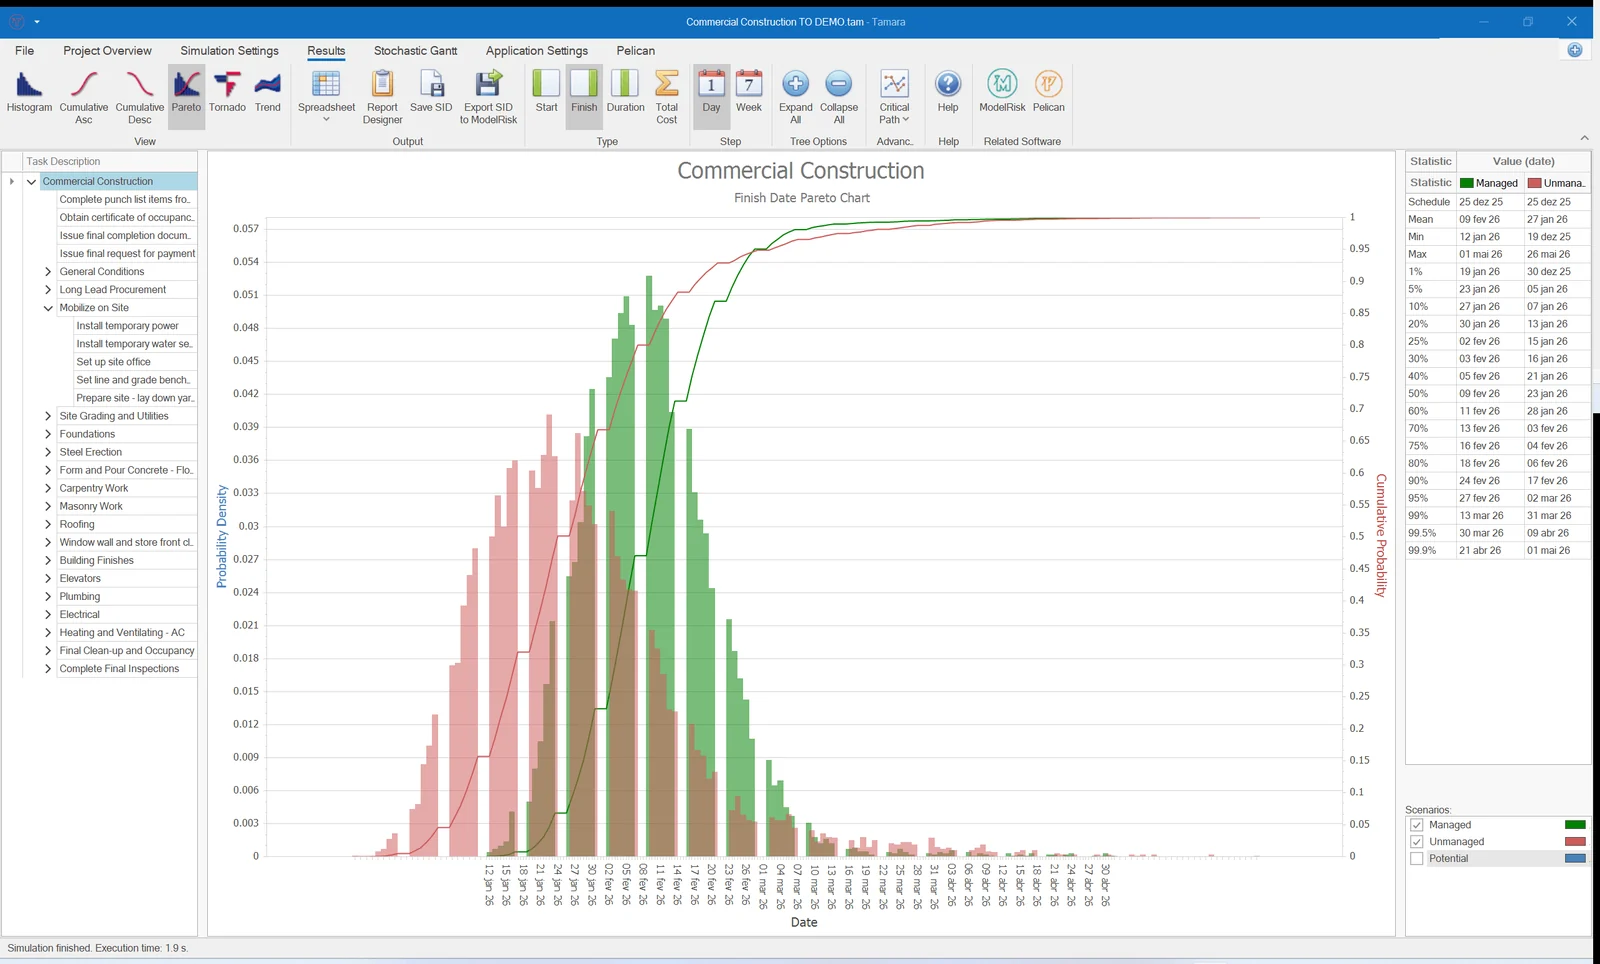
Tamara
Cost over 3 years ($)~7,700
What you may like:
Price
Many options for describing risk
Handles the correlation problem
What you may NOT like:
No ability to build schedule from scratch or edit links
Runs very large schedules
Performs update against master schedule
One risk maps to multiple impacts
Repeatable risk event supported
Simulation spreadsheets built-in
Weather calendar: Manual
Create schedule from scratch: No
Our Recommendation
For those with a very limited budget, RiskyProject provides good value for money. In contrast, ScheduleRiskAnalysis offers poor value from a project risk perspective, as it is only one part of a larger tool suite. Additionally, Primavera Risk Analysis is no longer actively developed or supported, which may pose challenges for IT compliance and long-term usability.
If you have more flexibility in your budget, it’s worth exploring the details of this article. Acumen Risk, Safran Risk, and Tamara are all robust tools, and the best choice depends on the nature of your projects and associated risks. Feature-wise, Tamara offers similar capabilities at a lower published price than Primavera Risk Analysis and ScheduleRiskAnalysis. To navigate directly to specific sections, use the links below:
Transparency is important—Tamara, the last software listed in the comparison table, is developed by our company. While we've made every effort to keep this review objective, we encourage you to critically evaluate our analysis.
This review starts by outlining why conducting a project cost and schedule risk analysis is essential. The key reasons are:
Without it, project cost and timeline estimates are likely to be unrealistic.
It helps identify opportunities to complete the project faster, at lower cost, and with greater predictability.
We then explore the key practical challenges in building a high-quality project risk analysis. Some of these challenges may be highly relevant to your projects, while others may not apply. Understanding how each software solution addresses these challenges should help you determine which tools warrant a closer look.
Unlike our review of Excel risk analysis add-ins, where we tested each product hands-on, this review is based primarily on available documentation and video materials, as downloadable trials for many of these tools are not readily available. To maintain fairness, we have summarized findings from these sources and determined whether there was enough information to assess how well each product addresses critical risk analysis requirements.
Pricing was also challenging to obtain. Before making a decision, we recommend requesting a detailed quote from vendors, covering the total cost of ownership for three years, including maintenance and updates.
While software aesthetics can be a consideration, our primary focus is on functionality. Some tools may not have the most polished interface but offer robust features. Ultimately, the most important factors are whether the software enables effective risk analysis for your needs and whether it facilitates, rather than complicates, the modelling process.
Why Project Risk Analysis is Essential
Project scheduling tools like Primavera and Microsoft Project are invaluable for planning and tracking project execution. They enable you to:
Define the tasks required to complete a project
Allocate resources for each task
Establish task dependencies and sequencing
Communicate execution plans with stakeholders
Monitor project progress
While these tools excel at project management, they fall short in forecasting realistic costs and timelines. This is where a dedicated project risk tool becomes essential — the discipline it supports on the cost side is covered in our overview of cost risk analysis.
Reason 1: Achieving Realistic Delivery Goals
When start and finish dates are assigned to tasks in a scheduling tool, milestone and completion estimates are generated. Similarly, adding resource rates and expenses produces a total cost estimate. Many organizations rely on these estimates to set deadlines and budgets—yet they are often overly optimistic and, in many cases, highly unrealistic.
This inaccuracy arises because traditional scheduling tools do not account for uncertainty or risk events, both of which increase the likelihood of cost overruns and delays. Risks are straightforward to grasp; for example, the risk of a rejected planning application may require resubmission, leading to additional costs and time. Such contingencies are rarely built into standard project schedules.
Uncertainty, however, is more nuanced. Consider a construction project where foundation excavation is required. If weather conditions are ideal, the task may take as little as 30 days. Under typical conditions, 35 days may be required, while extreme weather could extend it to 50 days or more. A probability distribution effectively captures this variability:
The blue curve represents the likelihood of different completion times. The probability is zero below 30 days and above 50 days, with the most probable estimate at 35 days. The distribution is skewed, with a longer right tail—reflecting the reality that while tasks can occasionally be completed slightly faster than expected, delays can be significantly longer.
Statistically, when a probability distribution is skewed to the right, the probability of completing the task by the most likely estimate is always less than 50%. In this case, the chance is just 25%, and the true 50:50 estimate is around 38 days:
This demonstrates why using the most likely cost and duration estimates results in systematically underestimated budgets and timelines. If a project schedule is built using optimistic "best guesses," delays and cost overruns become inevitable—even when no major issues occur.
In summary, while scheduling tools are excellent for structuring and managing projects, they should not be relied upon for setting budgets and deadlines. Project risk tools provide more realistic forecasts by accounting for uncertainty and risk.
Reason 2: Reducing Costs, Saving Time, and Increasing Predictability
Reducing project costs and accelerating completion are common goals. Project risk tools identify which activities have the greatest impact on total cost and duration, as well as those contributing most to uncertainty.
In the planning phase, this insight allows teams to explore alternative execution strategies and select the most efficient approach. During execution, as tasks are completed and risks evolve, the analysis can be continuously refined—enabling better decision-making and more predictable outcomes.
Key Principles for Effective Project Risk Analysis
Conducting a project risk analysis is essential for making informed decisions and ensuring project success. However, an inaccurate or poorly executed risk analysis can be more harmful than having none at all—it may lead to committing resources to high-risk projects or dismissing viable opportunities. This section highlights common pitfalls in project risk modelling and explains how different tools address these challenges, helping you choose the right solution for your needs.
Managing Large Project Schedules
Complex projects often involve extensive schedules with thousands of tasks. Typically, immediate tasks contain a high level of detail, while long-term activities are more broadly defined. As the project progresses, completed tasks are replaced with more granular breakdowns of upcoming work. Risk analysis for such projects relies on Monte Carlo simulation, a computationally intensive process that requires substantial memory and processing power.
Historically, running simulations on large schedules posed challenges due to software limitations, forcing teams to maintain a simplified secondary schedule for risk analysis. However, as schedules grow in complexity, maintaining two separate versions becomes impractical and highly time-consuming.
Breaking a large task into smaller sub-tasks presents additional challenges in risk analysis. For example, consider a fencing project originally estimated to take Triangle(30,40,60) days. As the project nears execution, the task is divided into ten equal sections, each estimated at Triangle(3,4,6) days. This segmentation can create an unintended effect—suddenly, the total projected completion time appears significantly shorter in the risk model than in the original estimate.
The underlying issue is that many schedule risk tools treat each task as statistically independent. This means that if one section of the fence takes longer than expected (e.g., 6 days), the model does not account for whether subsequent sections will also be delayed. The Law of Large Numbers (LLN) explains that treating tasks as independent reduces overall uncertainty in the model, often leading to misleadingly optimistic results.
Software solutions address this challenge in different ways: (1) some ignore the issue entirely, (2) others apply a simulation technique that enforces 100% correlation among related tasks, and (3) the most advanced tools identify the root cause of uncertainty, ensuring task durations depend on a shared influencing factor.
Another key consideration is the practicality of assigning uncertainty manually across thousands of tasks. A more efficient approach is bulk uncertainty assignment—selecting a group of tasks and applying a global percentage variation. However, caution is needed: if uncertainty is influenced by a common factor, such as contractor efficiency, failing to model this correctly will again lead to an underestimation of risk due to the LLN effect.
Conclusion: For large-scale project simulations, ensure the chosen project risk tool can handle complex schedules efficiently, supports high-speed processing, properly accounts for statistical dependencies, and offers bulk uncertainty assignment to streamline the process.
Describing uncertainty
Probability distributions play a crucial role in quantifying uncertainty in project risk analysis, particularly for task durations and cost estimates. Selecting the appropriate distribution is essential for accurately modelling variability and ensuring realistic projections. Below are some of the most commonly used probability distributions in risk analysis:
Distributions with limitations:
Uniform – because it is so crude
Split Triangle – because it doesn’t match what people want to say
Normal– because the mean and standard deviation inputs are unintuitive, and life is not symmetric
Lognormal – same mean, standard deviation issues, and the tail can be wildly uncontrolled
Moderately suitable distributions:
Triangle – because people understand it, even if its crude, but it tends to overestimate uncertainty
PERT – a curvy Triangle, easy to understand, but it tends to underestimate uncertainty
Well-suited distributions:
Modified PERT –Last parameter alters how flat the curve is, controlling over/underestimation of uncertainty. I invented it, so a bit biased
ThreePoint – a Modified PERT where you give a “practical max”(like a 95th percentile) instead of the absolute max which is very hard to elicit from an SME. It’s a distribution specific to VOSE software products, so perhaps a bit biased here
Conclusion: Ensure the software includes at least one of the well-suited probability distributions, while avoiding those that may lead to inaccurate risk estimations.
Single Risk Event with Multiple Consequences
Some risk events can trigger multiple consequences. For instance, if a key supplier goes out of business, it could lead to delays in procuring multiple materials, increased costs, and operational disruptions. These impacts either occur together or not at all. If a risk analysis model does not properly account for such dependencies, it may significantly underestimate the overall risk exposure and the importance of mitigation strategies.
Conclusion: Choose a project risk tool that allows linking a single risk event to multiple potential consequences, ensuring a more accurate assessment of project vulnerabilities.
Modelling Risk Event Frequency
Risk events such as strikes, equipment failures, and accidents can occur sporadically, introducing delays and additional costs. Some risks, like the complete destruction of a building, can only happen once, while others may repeat over time. The probability of a one-time event is typically expressed as a likelihood, whereas recurring risks are better represented using an expected frequency (e.g., 0.7 occurrences per year).
If a project risk tool does not differentiate between these two types, it may lead to inaccurate uncertainty estimates and ineffective risk mitigation strategies.
Conclusion: Ensure that the software can properly distinguish between single-event probabilities and recurring risk frequencies to enhance the accuracy of your risk model.
Impact of Adverse Weather
Weather conditions can significantly affect project timelines, particularly in industries reliant on outdoor work, such as construction, offshore operations, and infrastructure development. Extreme weather events, seasonal variations, and climate-related disruptions must be factored into risk models to ensure realistic scheduling and budgeting.
Conclusion: If weather variability is a critical factor in your projects, choose software that incorporates weather calendars or similar mechanisms to account for these uncertainties.
Managing Complex Cost Structures
Project schedules typically incorporate various cost elements, such as:
Fixed costs assigned at different project stages (start, mid, or completion)
Resource-based costs (e.g., hourly rates for workers, daily charges for equipment), linked to task durations
Overhead costs (e.g., office rentals), independent of specific tasks
Project risk software integrates these costs, applies uncertainty, and considers risk-driven cost variations to provide a realistic project cost estimate. However, many additional expenses, such as legal fees, materials, insurance, and financing costs, often fall outside scheduling tools. These are typically assessed separately by cost engineers and financial analysts, requiring integration for a complete financial overview.
Conclusion: If understanding total project cost uncertainty is critical, ensure the software supports data export for external analysis or includes a built-in financial simulation tool.
Evaluating Investment Risks
Projects are typically undertaken with financial returns in mind, whether it's launching a new product or constructing infrastructure for revenue generation. Investment risk analysis relies on discounted cash flow (DCF) modelling to assess financial viability, using metrics like net present value (NPV) and internal rate of return (IRR). Project delays can significantly impact financial performance—additional costs lower NPV, while delayed revenues further reduce profitability.
These calculations are often performed in Excel, with risk analysis software such as ModelRisk enhancing precision. Given that investment success depends on factors like discount rates (typically 10-15%) and IRR thresholds (e.g., 20-25% for strong projects, 5% for marginal ones), integrating project cost and schedule uncertainty into financial models is essential.
Conclusion: If investment evaluation is part of your project decision-making, choose software that can seamlessly export risk-adjusted cost profiles or, ideally, include financial modelling capabilities.
Ensuring Schedule Suitability for Risk Analysis
Effective project risk analysis requires a schedule structure that reflects realistic uncertainties. Fixed milestones and rigid task dependencies (e.g., forcing Task B to start exactly 30 days before Task A finishes) can conflict with probabilistic modelling. Similarly, assumptions that two tasks will finish simultaneously (Finish-Finish dependencies) may oversimplify actual project risks.
Conclusion: Planners should prioritize Finish-Start dependencies and avoid locked milestones to allow realistic risk modelling. Additionally, project risk tools should perform logic checks to identify potential scheduling inconsistencies.
Considering Spreadsheet-Based Risk Modelling
For simpler projects, a full-fledged scheduling tool may not be necessary. In some cases, a well-structured spreadsheet model can effectively capture key risks and uncertainties. To explore practical examples, you can download and experiment with models such as this one and this alternative.
Project risk software comparison table
Depending on your circumstances, in my view the lines in bold are the most important in differentiating between the products.
Product namePublisher
Acumen RiskDeltek
Primavera Risk AnalysisOracle
Schedule Risk AnalysisLumivero
RiskyProject ProfessionalIntaver
Safran RiskSafran
TamaraVose
Cumulative cost (USD, see note 4):
1 year
On request
10 800
5 510
979
On request
2 570
2 years
On request
10 800
11 020
1 958
On request
5 140
3 years
On request
10 800
16 530
2 937
On request
7 710
Schedule-related features
Imports from (1):
PV, MSP, OP
PV, MSP
PV, MSP
PV, MSP
PV, MSP
PV, MSP
Performs update against master schedule
Unsure
Unsure
Unsure
Performs schedule quality check
Partial
Partial
Imports cost data
Partial
Edit schedule tasks and links
Create schedule from scratch
Runs very large schedules
Risk information input
Uncertainty in task duration as %
Uncertainty in task duration in units
Uncertainty in scope as %
Uncertainty in scope in units
Uncertainty in cost item as %
Uncertainty in cost item in units
Uncertainty of risk impact size
Uncertainty in productivity rates
Group uncertainty factors
Resource cost uncertainty
Unsure
Work type aggregate factors
Unplanned work risk events
Manual
Task-specific risk events
Manual
Calendar delay risk
Weather calendar
Manual
Link to external risk register
Import
Import
(Pelican)
Scenario analysis options
Switch risks on/off
Manual
Define multiple scenarios
Risk treatment analysis
Analysis and reporting
Results for any task or milestone
With rerun
Compare different scenarios on 1 plot
Tornado charts for sensitivity
Partly
Tornado charts use natural numbers [2]
Critical index
Total cost-Finish date joint plot
Cost profile over time
Stochastic Gantt chart
Report templates
Export formats
PVMSPOP
PVExcel
Excel
Print
PVExcel
ExcelWordPowerPointPDF
Mathematical basis
Distributions [3]
N, P, T, U, +
MP, P, T, U
L, P, T, U, +
L, N, P, T, U, +
L, N, P, T, U, +
Any
Repeatable risk event supported
Manual
Simulation spreadsheets built-in
One risk maps to multiple impacts
Manual
IF THEN conditional modelling
Manual
Manual
Avoids correlation coefficients
Manual
Footnotes
PV = Primavera, MSP = Microsoft Project, OP = Open Plan
Natural numbers means in units of currency or time, not a rank order correlation which is unintuitive
L = Lognormal, MP = Modified PERT, N = Normal, P = PERT, T = Triangle, U = Uniform
Prices in US dollars as published in October 2026. RiskyProject: Intaver's Professional subscription, US $979 a year (intaver.com). Deltek and Safran publish no prices for Acumen Risk and Safran Risk. Tamara: Vose Software's price list.
Product names are trademarks of their owners. Vose Software is not affiliated with, or endorsed by, Deltek, Oracle, Lumivero, Intaver Institute or Safran Software Solutions.
Software that runs a Monte Carlo simulation over the uncertainties and risk events in a project schedule and cost estimate, producing delivery dates and budgets with confidence levels — a P80 finish date (the date with an 80% chance of being met), a defensible cost contingency, and a ranking of which risks drive the outcome.
What is QSRA (quantitative schedule risk analysis)?
QSRA is the usual name for what these tools do to a project schedule: a Monte Carlo simulation over the task durations and risk events that gives the chance of meeting each finish date, such as the P80 date. The cost side is often called QCRA, quantitative cost risk analysis. All six tools reviewed here run a QSRA on schedules imported from Primavera P6 or Microsoft Project.
How is a project risk tool different from a project management tool?
A scheduling tool like Primavera or Microsoft Project is for planning and tracking: tasks, resources, dependencies, progress. It prints one finish date and one cost, built from single-point estimates. A project risk tool takes that same schedule and quantifies how uncertain those numbers are — which is why the two are used together, not instead of each other.
Which tools does this review compare?
Six project cost and schedule risk tools: Deltek Acumen Risk, Oracle Primavera Risk Analysis, Lumivero Schedule Risk Analysis, Intaver RiskyProject, Safran Risk, and Vose Software's Tamara — each scored on usability, technical capability and price, with screenshots and prices where published.
How much does project risk software cost?
Published prices differ widely. Intaver lists RiskyProject Professional at $979 a year, about $2,900 over three years. The comparison table puts Primavera Risk Analysis at about $10,800 and Schedule Risk Analysis at about $16,500 over three years. Deltek and Safran publish no prices for Acumen Risk and Safran Risk, so ask them for a quote. Tamara costs about $7,700 over three years.
Note 4 under the comparison table gives the price sources.
Can I run schedule risk analysis in Excel with a Monte Carlo add-in?
Cost risk analysis works very well in a spreadsheet — that is what Monte Carlo Excel add-ins such as ModelRisk are built for, and simple task networks can be modelled there too (see the spreadsheet-based risk modelling section above).
For a real project schedule with hundreds of linked tasks, calendars and progress updates, a dedicated tool that reads the schedule natively is the better instrument — which is the category this page reviews. Our guide to Monte Carlo add-ins for Excel covers the spreadsheet side.
Do these tools work with Primavera P6 and Microsoft Project schedules?
Yes — all six tools reviewed import both Primavera and Microsoft Project schedules (one also reads Open Plan; the "Imports from" row of the comparison table lists each). For the Primavera-specific workflow, see our article on schedule risk analysis for Primavera P6 schedules.



 Tamara
 Tamara