

Industry: Utilities
Product: Tamara
Application: Demand forecasting risks
The Plan Promised a March 2029 In-Service Date. The Simulation Gives It a 3% Chance
A regional utility sized a 500 MW combined-cycle peaking plant and its 230 kV interconnection against a forecast of peak-demand growth, then built the delivery schedule the orthodox way: most-likely durations for each of eleven activities, chained through the network, read off the end date. The roll-up came to 1,090 days — a clean March 2029 in-service date the utility took to its regulator and its board as the moment new capacity would be available to meet load. The number was internally consistent. It was also the answer to a question no capacity planner should ask of a schedule — what happens if every activity lands on its most-likely duration, demand never surprises us, and nothing goes wrong?
Rebuild the same network in Tamara, Vose Software's Monte Carlo project risk tool, with each activity carrying a Beta-PERT duration and six discrete demand-and-delivery risks layered on top, and the deterministic date dissolves into a distribution: P50 September 2029, P90 February 2030, and a probability of energizing by the published March 2029 plan of just 3%. The S-curve below is the whole argument — the deterministic plan sits at the very foot of the curve, in the regime a utility commits to only if it intends to re-forecast every quarter and explain the slips to its regulator one at a time.
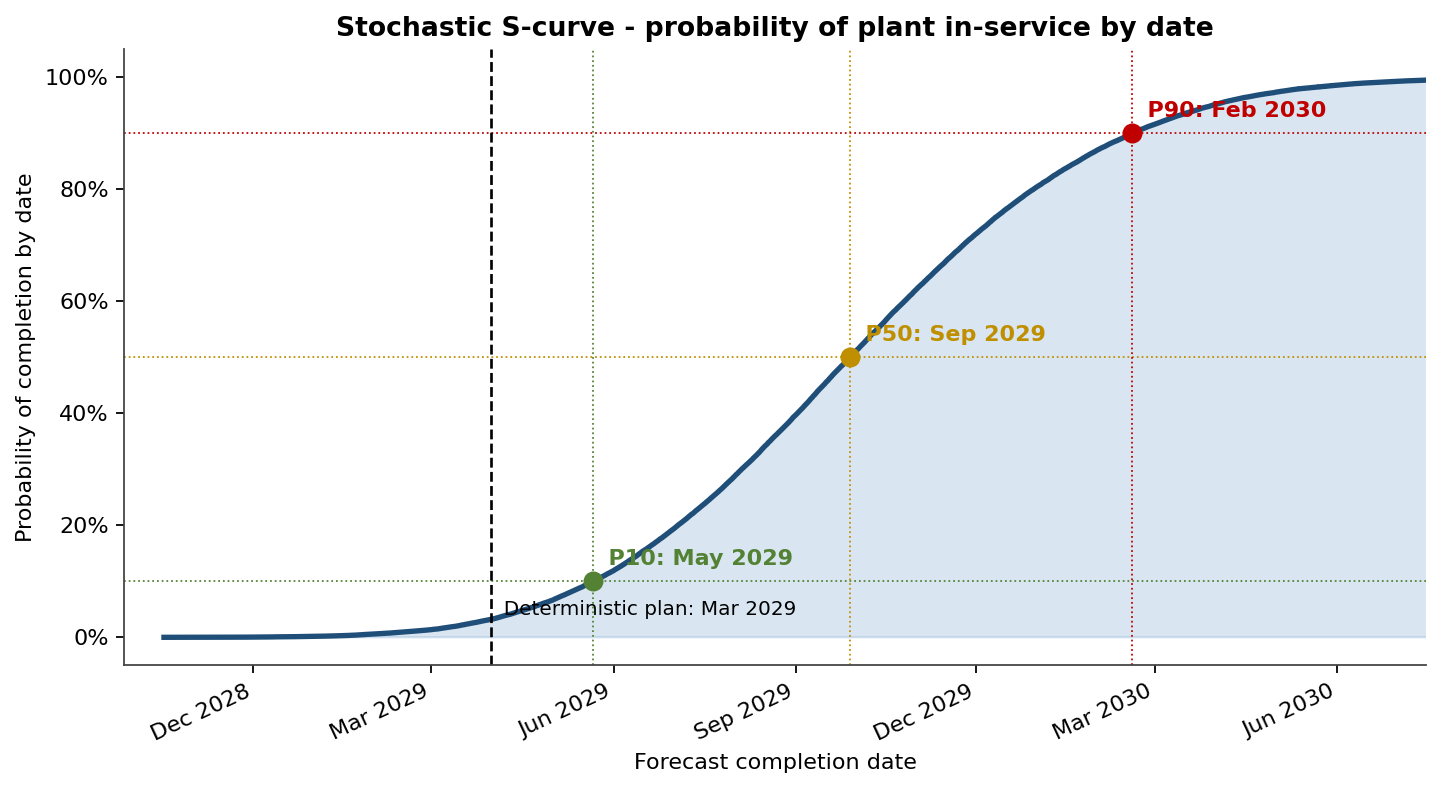
The gap between the March 2029 plan and the P80 in-service date is 274 days — roughly 9 months of additional schedule the deterministic roll-up never showed. That gap is not pessimism; it is the project's true contingency, and on a plant sized to cover peak load it is also the window in which the utility is exposed to buying replacement capacity on the market.
Why a single critical-path date fails
A deterministic schedule adds most-likely durations along one assumed-longest chain. Two things break it. First, activity durations are right-skewed — long-lead procurement and approvals can finish a little early but overrun badly — so the mean simulated finish is 1,275 days against the 1,090-day plan. Second, the network has parallel chains (turbine procurement, civil works and the interconnection build all run off detailed engineering), and whichever chain is longest in a given iteration drives the finish, so the project inherits the worst of several paths rather than the average of one. The deterministic method sees neither effect.
Where the duration risk actually lives
Tamara reports each activity's cruciality — the rank-correlation between its duration and the project finish — which separates the activities that move the in-service date from those that merely sit on the critical path.
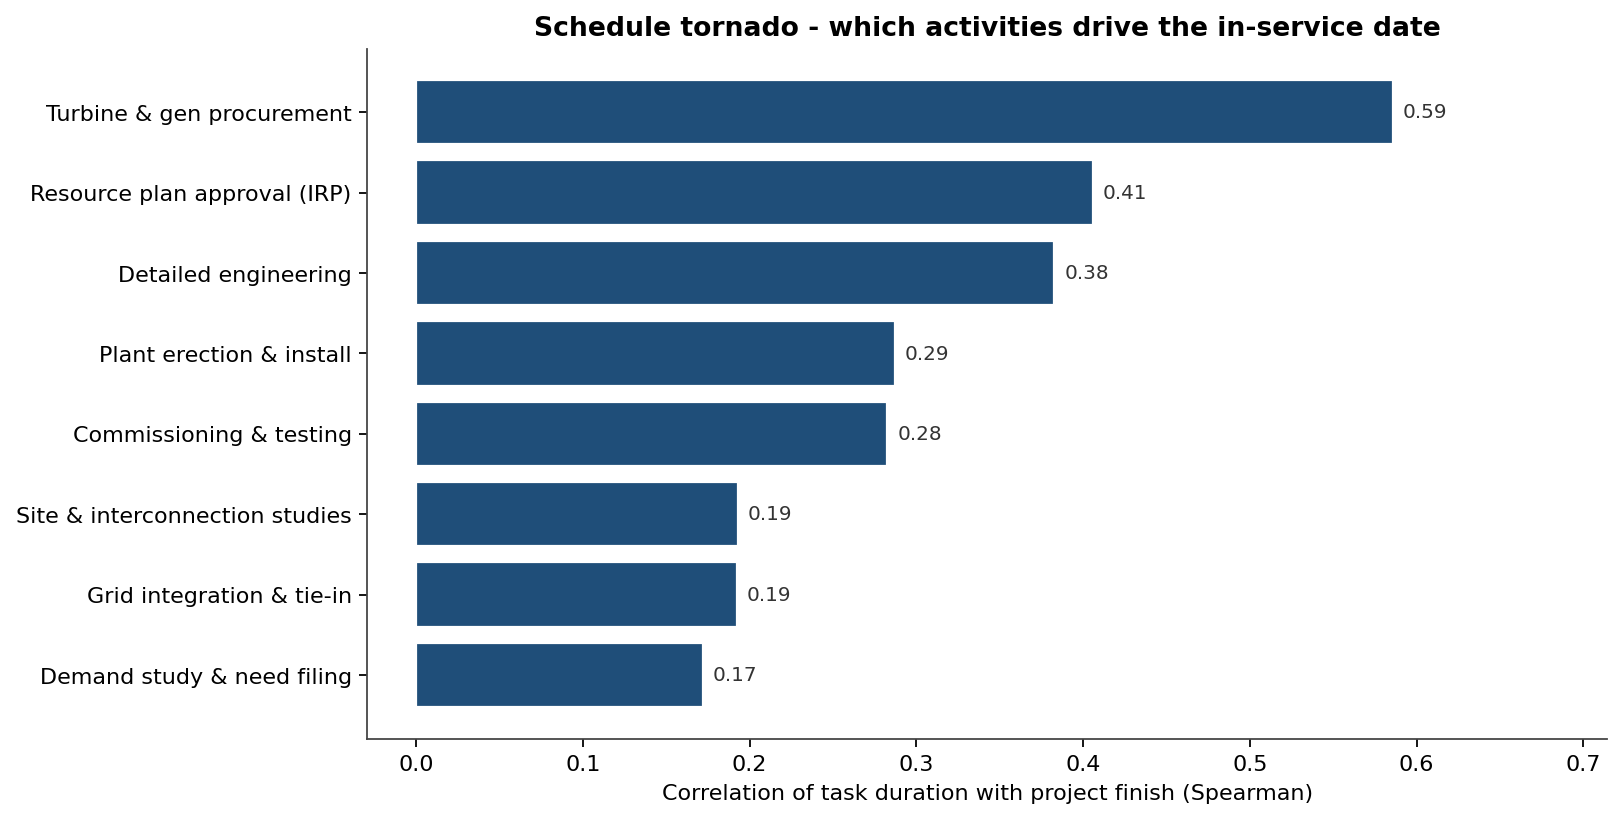
Turbine and generator procurement dominates (cruciality 0.59), followed by resource-plan (IRP) approval (0.41) and detailed engineering (0.38). This is the action list: the single highest-leverage week of schedule certainty is buying it on the turbine order — a long-lead item whose slot, once missed, cannot be compressed downstream — not on whichever activity the delivery team finds easiest to accelerate.
The same simulation places every activity in time as a band, not a bar:
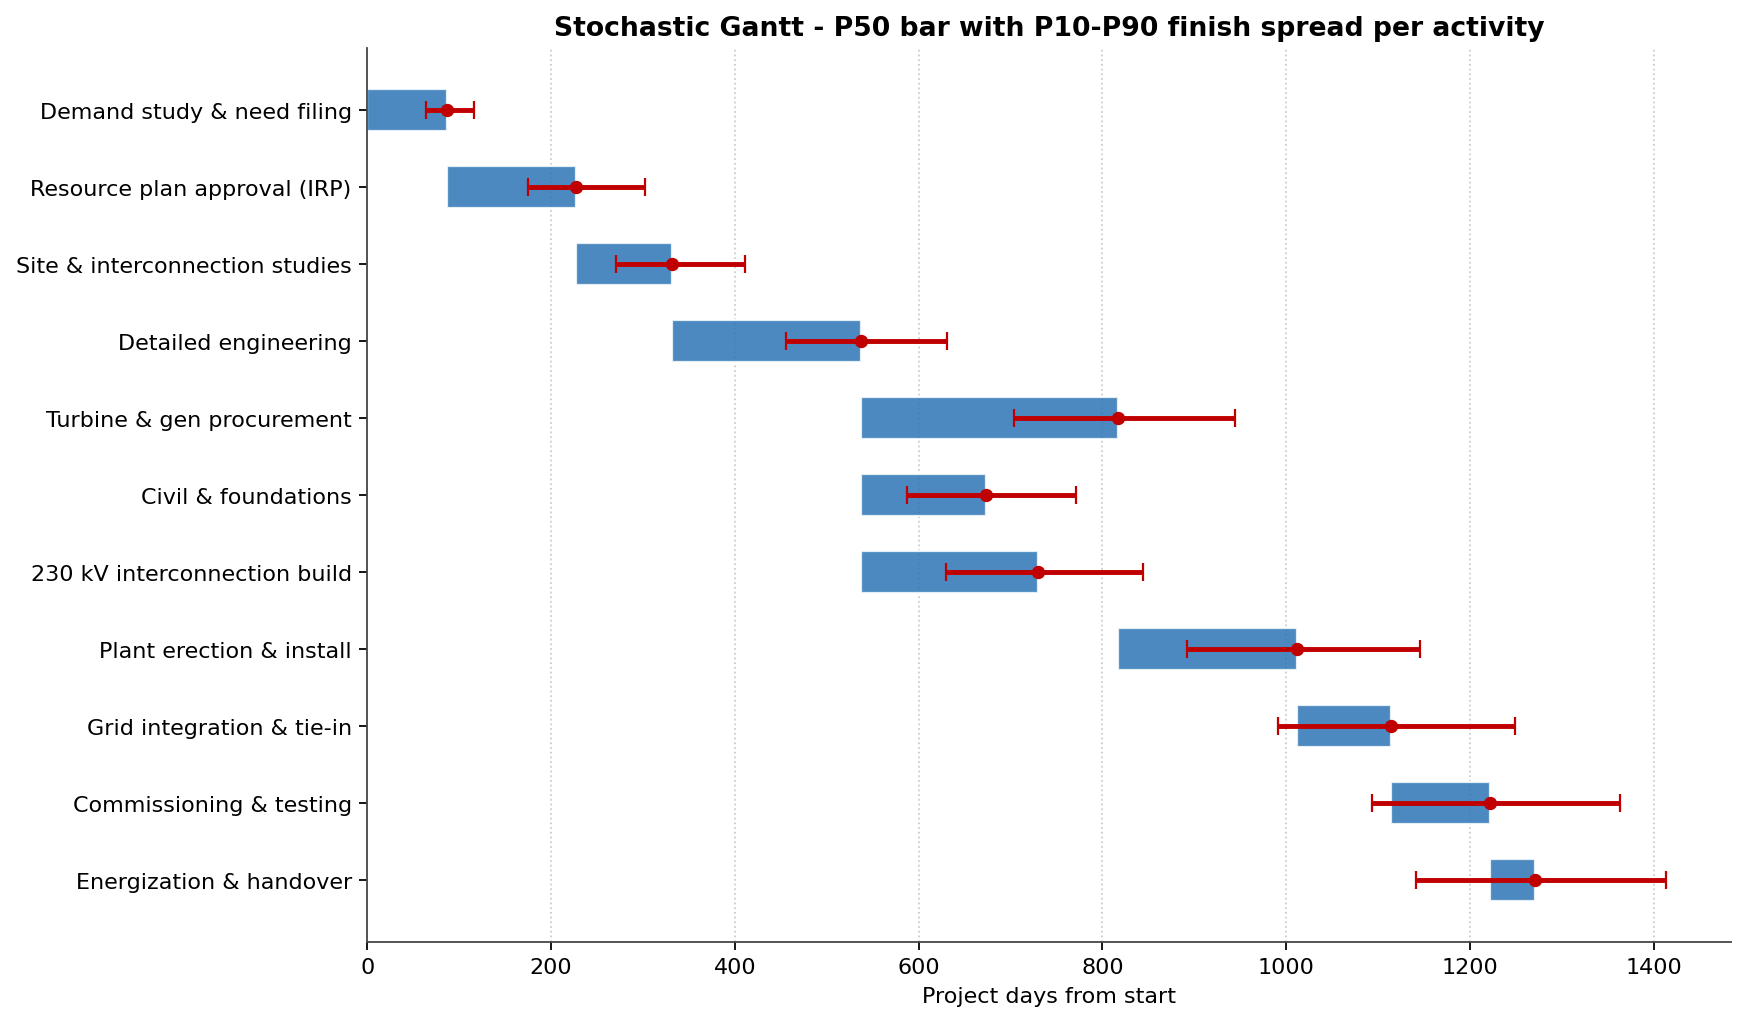
The whiskers widen downstream because uncertainty compounds along the chain: each activity inherits the spread of everything it waits on, so energization carries the accumulated variability of all ten activities before it.
The discrete risks that drive the tail
Beyond continuous duration uncertainty, six discrete events were modelled as Bernoulli risks — each may or may not occur, but if it does it adds delay and cost. Ranking them by expected schedule impact (probability × delay) gives a clean Pareto:
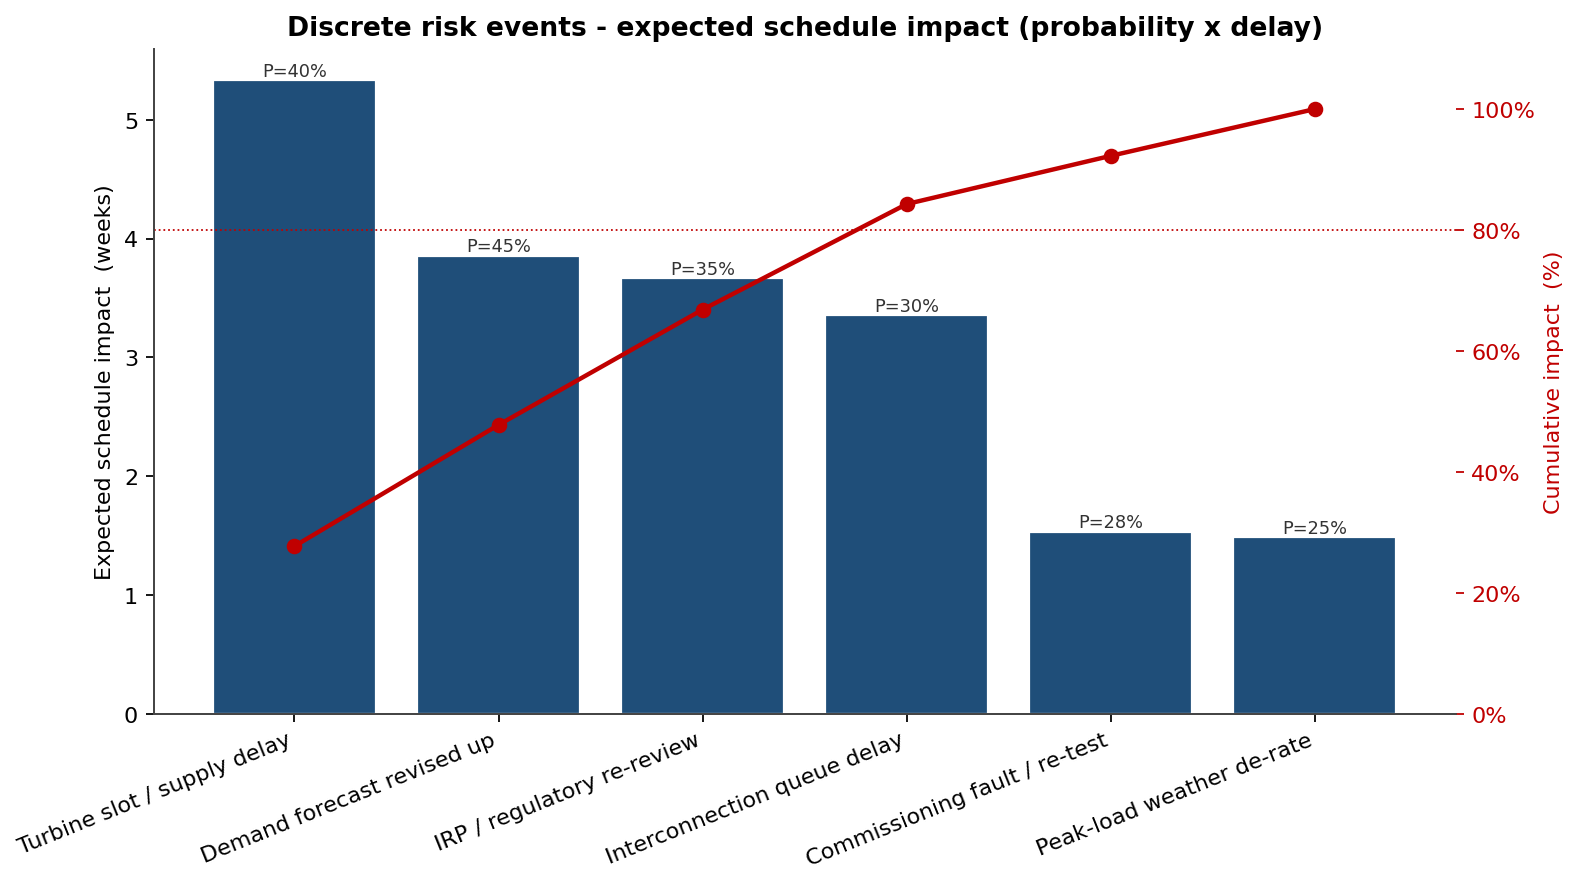
Four of the six events carry ~80% of the expected discrete-event delay — a turbine slot or supply delay (5.3 weeks expected), an upward demand-forecast revision that re-opens engineering scope (3.9), an IRP regulatory re-review (3.7) and an interconnection-queue delay (3.4). Once the ranking is visible, the risk-response budget writes itself.
Schedule risk is cost risk
Every day beyond the deterministic plan carries financing carry and escalation overhead, so the schedule distribution drives the cost distribution. Tamara let the utility price three mitigations together — reserving a turbine production slot early, filing the interconnection-queue application ahead of need, and a demand-tracking trigger that locks the IRP scope before re-review — and compare before/after on the same axis:
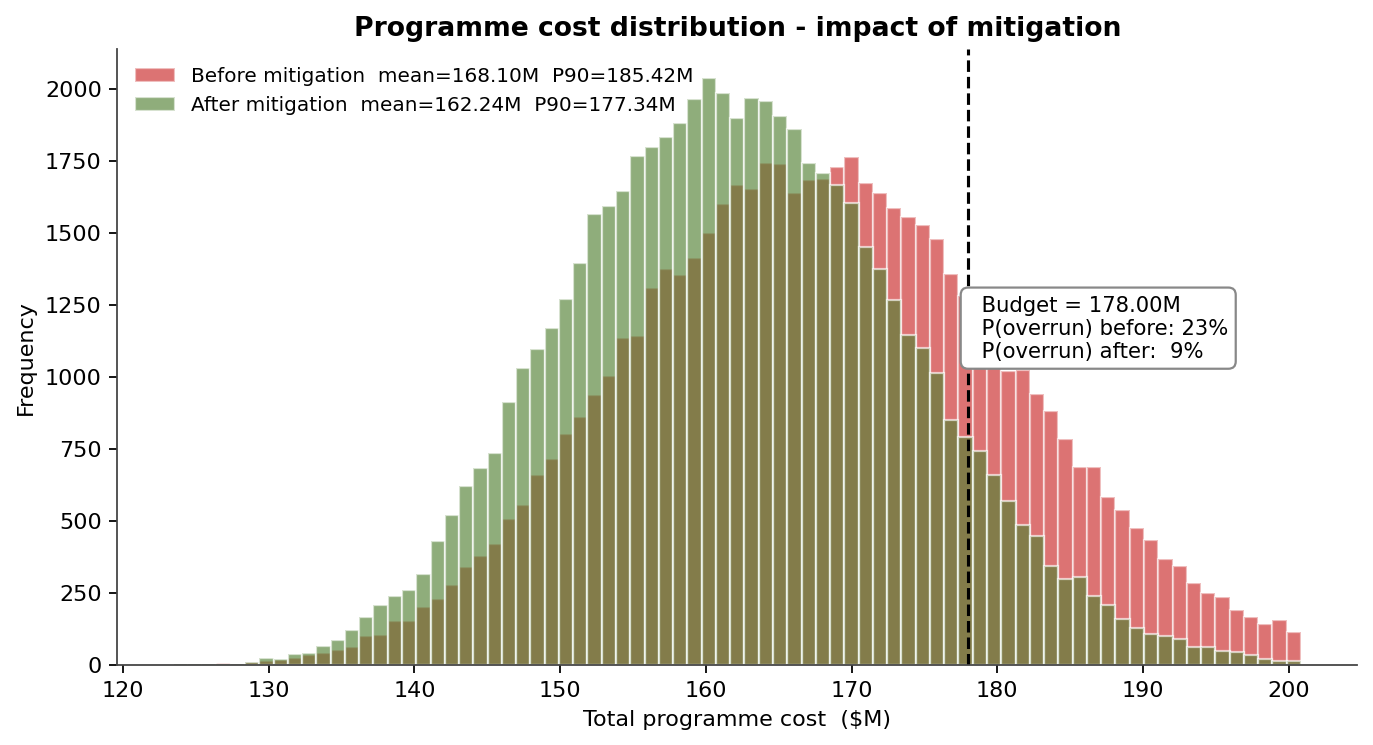
Without mitigation the cost distribution runs to a mean of $168M and a P90 of $185M, with a 23% probability of breaching the $178M budget. The ~$3M mitigation package cuts the P80 in-service date by 76 days (1,364 → 1,288 days), and because schedule drives cost, the overrun probability falls from 23% to 9% — the package pays for itself several times over in avoided carry, not in the line items it touches directly.
What Tamara changed
- The external commitment moved from the deterministic March 2029 date to a risk-informed P80, ending the quarterly slip-and-explain cycle with the regulator and board before it started.
- A 9-month schedule contingency was quantified and funded, and tied directly to the utility's exposure to buying replacement capacity if the plant is late.
- Risk-reduction effort was redirected to turbine procurement and the IRP gate — the two highest-cruciality drivers — rather than spread evenly across the schedule.
- A ~$3M mitigation package was approved on its tail-clipping effect, cutting budget-overrun probability from 23% to 9%.
Tamara Functionality Used
- Monte Carlo schedule simulation over the full activity network, with Beta-PERT durations and parallel-path logic.
- Discrete risk-event modelling (Bernoulli occurrence × Triangular impact) layered onto task durations and costs, including a demand-revision risk tied to engineering scope.
- Cruciality analysis distinguishing how often a task is critical from how much its variability moves the in-service date.
- Stochastic Gantt and cumulative S-curve for communicating schedule uncertainty to regulators and the board.
- Integrated cost–schedule modelling linking in-service overruns to financing-carry overhead, so mitigations are priced on their joint effect.
- Scenario comparison quantifying a mitigation package's before/after impact on both the P80 finish and the budget-overrun probability.
A capacity plan is not a date; it is a distribution with a body the utility can plan against and a tail it cannot afford to ignore. Tamara is what turns "when is the plant available?" into a probability the planners, the regulator and the board can all sign.