

Industry: Project Management
Product: Tamara
Application: Large-scale project scheduling
Two Work Packages Carry Half the Schedule Risk on a $1.2bn Programme — Design & Permitting at Cruciality 0.50
A $1.2 billion multi-segment transport programme — bridges, tunnels, roadworks, stations, then rail systems and signalling, all converging on a single commissioning gate — was scheduled the orthodox way: most-likely durations for twelve work packages, chained through the network, end date read off the merge. The number was a clean 1,505-day (4.1-year), May 2030 handover, and it went to the board, the funder and the concession authority. What that bar chart could not show was which of the twelve packages actually governs the finish — so risk-reduction effort got spread evenly across all of them.
Rebuilt in Tamara, Vose Software's Monte Carlo project risk tool, with each package carrying a Beta-PERT duration and six discrete risks on top, the simulation answers that question directly. Plotting every package by criticality index (how often it lands on the critical path) against cruciality (how much its variability actually moves the finish) produces a de-risk map: the top-right corner is where to spend first.
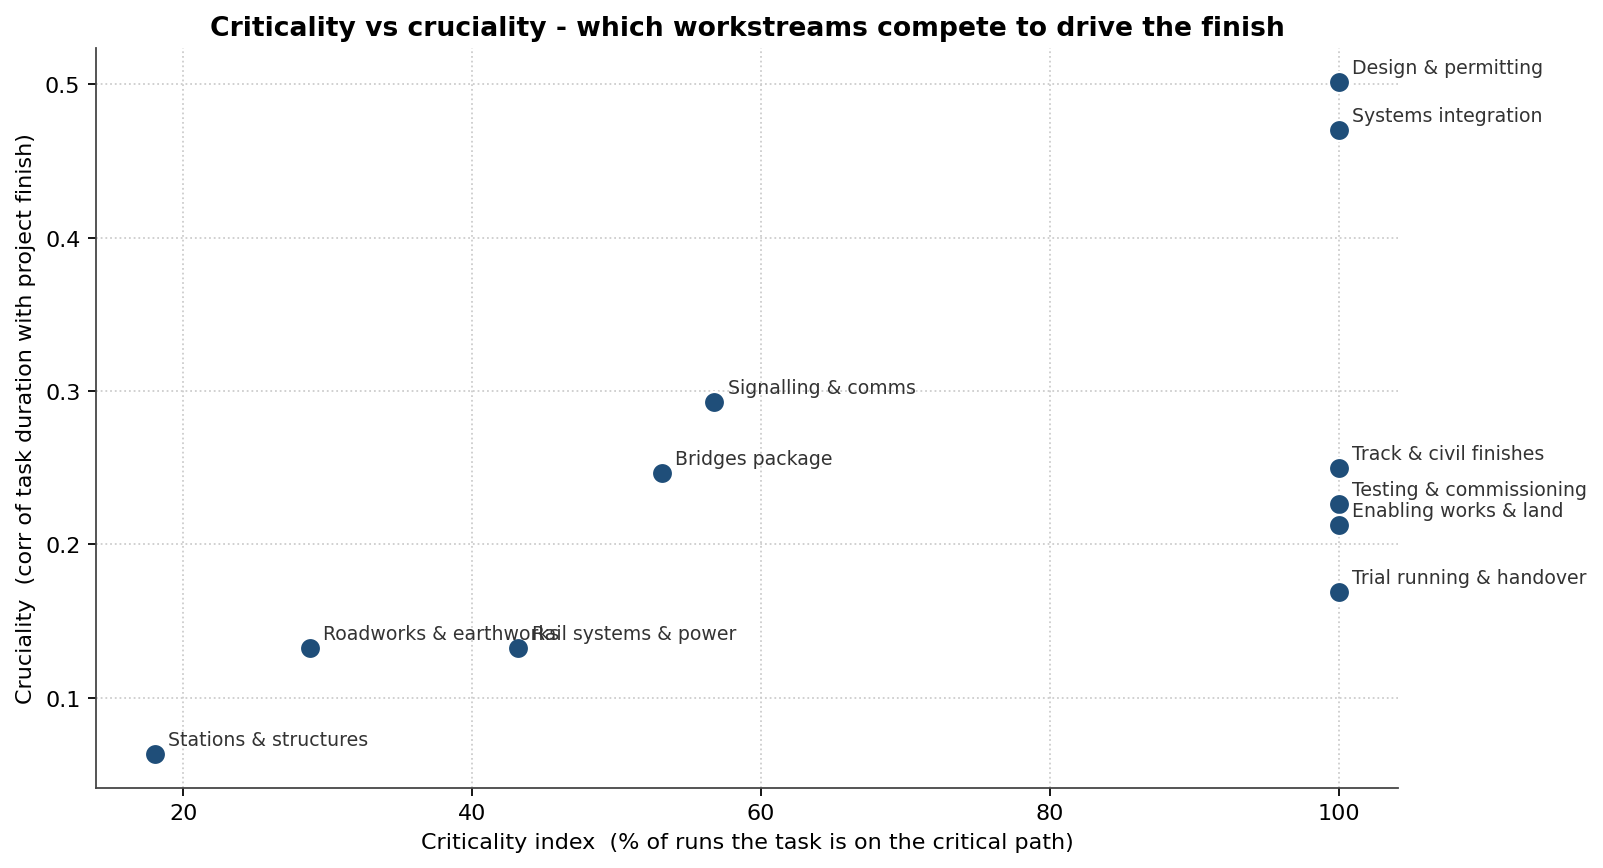
Two packages sit in that corner. Design & permitting (criticality 100%, cruciality 0.50) is the highest-leverage item on the programme — it sits upstream of every parallel chain, so its slip propagates everywhere. Systems integration (100%, 0.47) is second — the merge point that inherits all four civil chains. Behind them sit signalling & comms (57%, 0.29), track & civil finishes (100%, 0.25) and the bridges package (53%, 0.25). The action list writes itself: buy certainty on front-end permitting and the integration merge, not on whichever civil package the team finds easiest to compress.
Why a Single Critical-Path Date Fails on a Parallel Programme
A bar-chart critical path adds most-likely durations along one assumed-longest chain. Two things break it here. First, durations are right-skewed — a package can finish a little early but overrun a lot — so the mean simulated finish is 1,754 days against the 1,505-day plan, and the P50 lands at 1,749 days with the P90 at 1,919. Second, the programme runs four civil workstreams plus a systems chain in parallel off enabling works, all merging at systems integration: whichever chain is longest in a given iteration drives the finish, so the merge inherits the worst of several paths, not the average of one. The probability of finishing by the published plan is just 2%, and the gap between that plan and the P80 finish is 355 days — roughly 11.7 months of true schedule contingency the deterministic roll-up could not see.
The same simulation places every workstream in time as a band, not a bar:
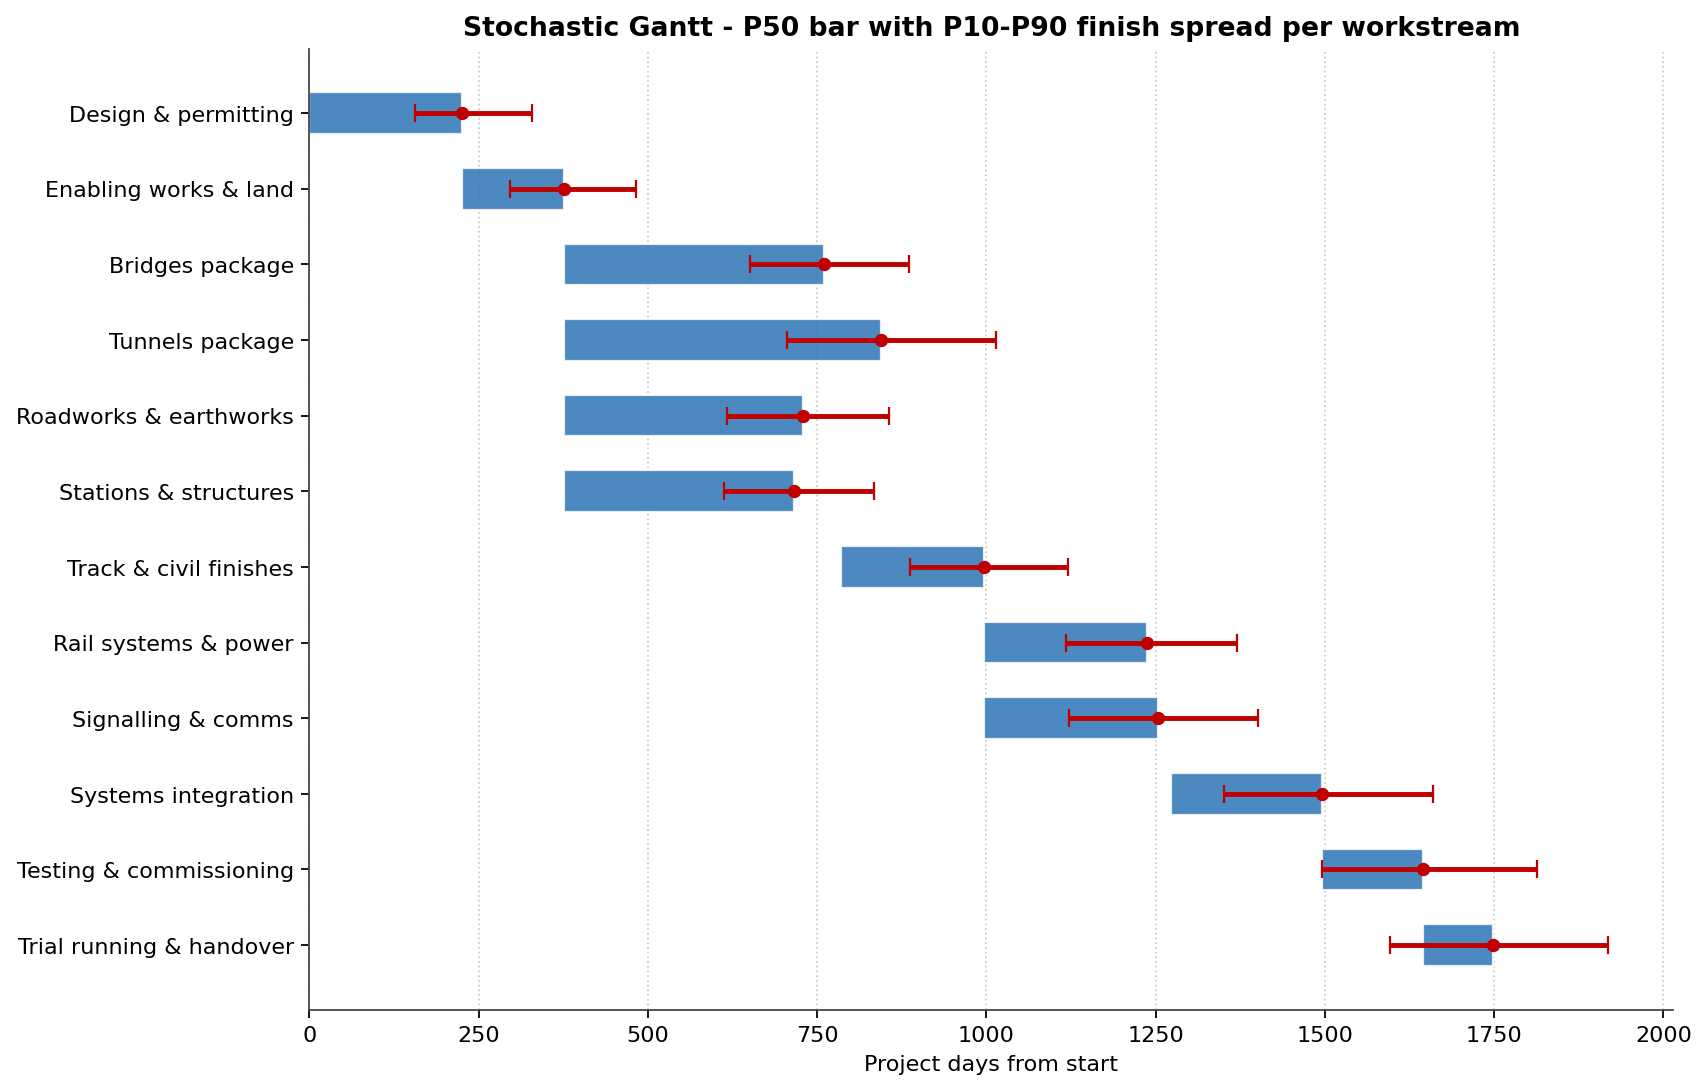
The whiskers widen downstream because uncertainty compounds: systems integration inherits the spread of every chain feeding it, and handover carries the accumulated variability of the whole programme.
The Finish Date as a Distribution
Collapsed onto the completion axis, the whole argument is one picture — the deterministic plan sits at the very left foot of the spread:
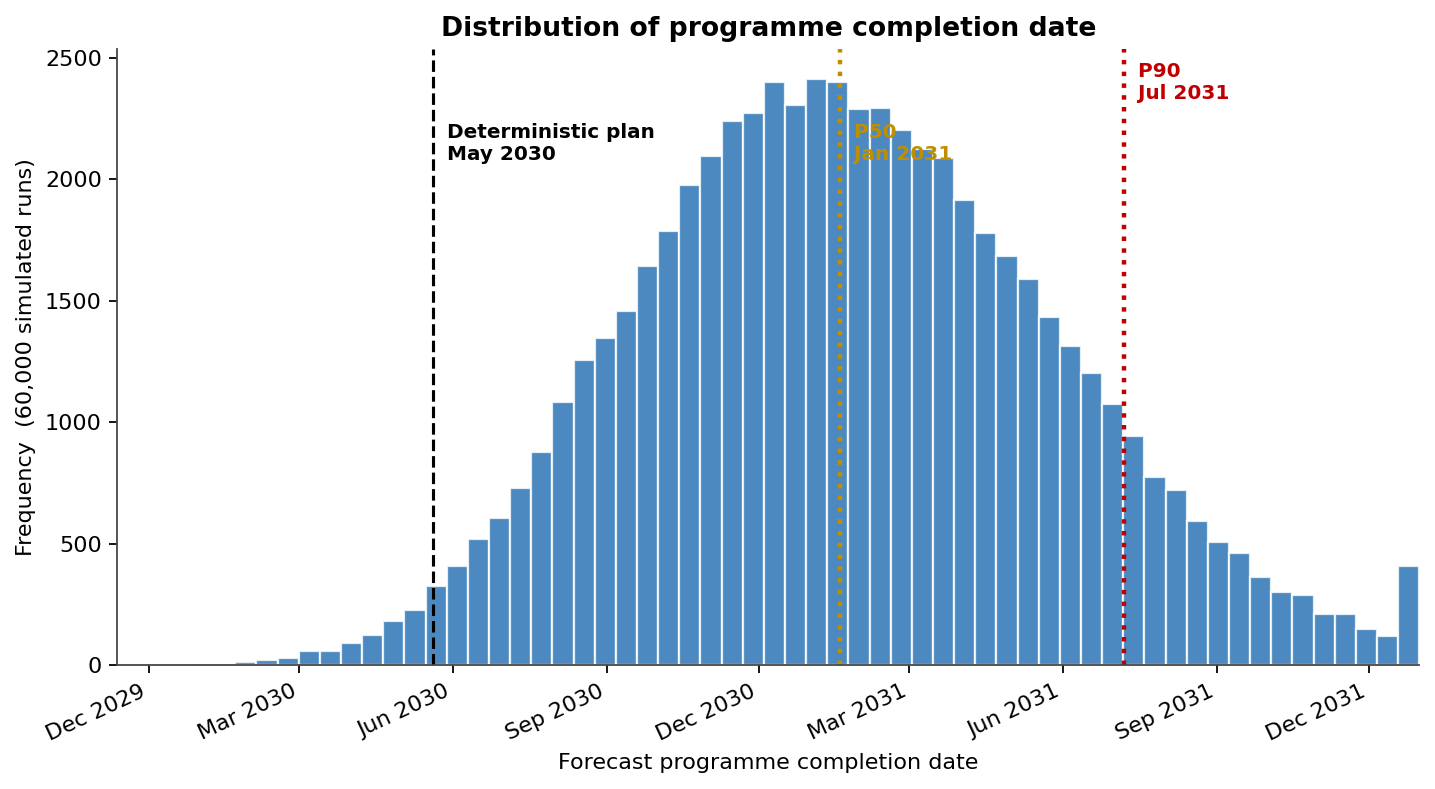
The plan at 1,505 days is nowhere near the body of the distribution; the bulk sits around the P50 of 1,749 days, with the P90 reaching 1,919 days. A date with a 2% chance of being met is not a plan; it is a wish.
Schedule Risk Is Cost Risk
Every day beyond the plan carries programme overhead — PMO, financing carry and escalation — so the schedule distribution drives the cost distribution. Tamara let the team price a mitigation package together — an early-permitting task force, a tunnel ground-investigation campaign, a fixed-price material framework and a pre-integration systems lab — and compare before/after on one axis:
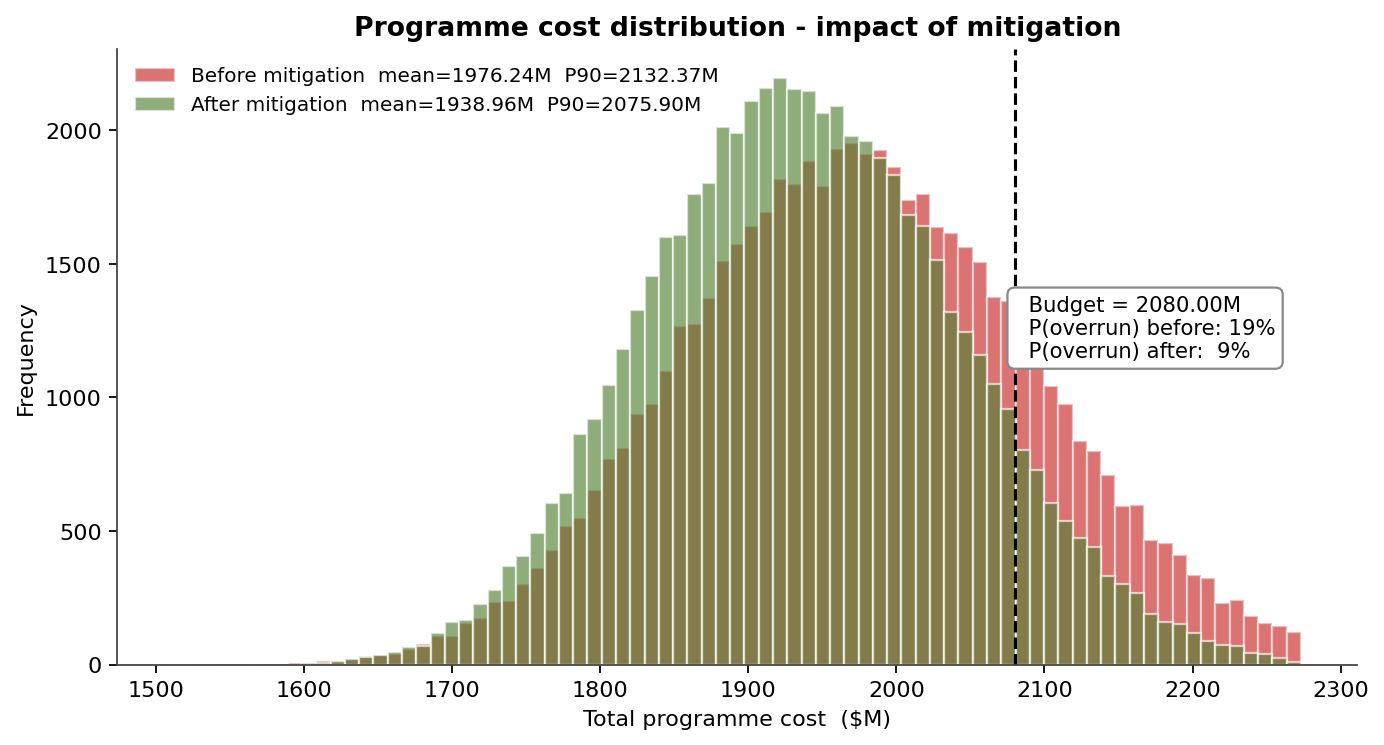
Without mitigation the cost runs to a mean of $1,976M and a P90 of $2,132M, with a 19% probability of breaching the $2,080M budget. The mitigation package cuts the P80 finish by 86 days (1,860 → 1,774 days), and because schedule drives cost, the overrun probability falls from 19% to 9% and the P90 cost drops to $2,076M.
The Discrete Risks That Drive the Tail
Six discrete events were modelled as Bernoulli risks — each may or may not occur, but if it does it adds delay and cost. Ranking them by expected schedule impact (probability × delay) gives a clean Pareto:
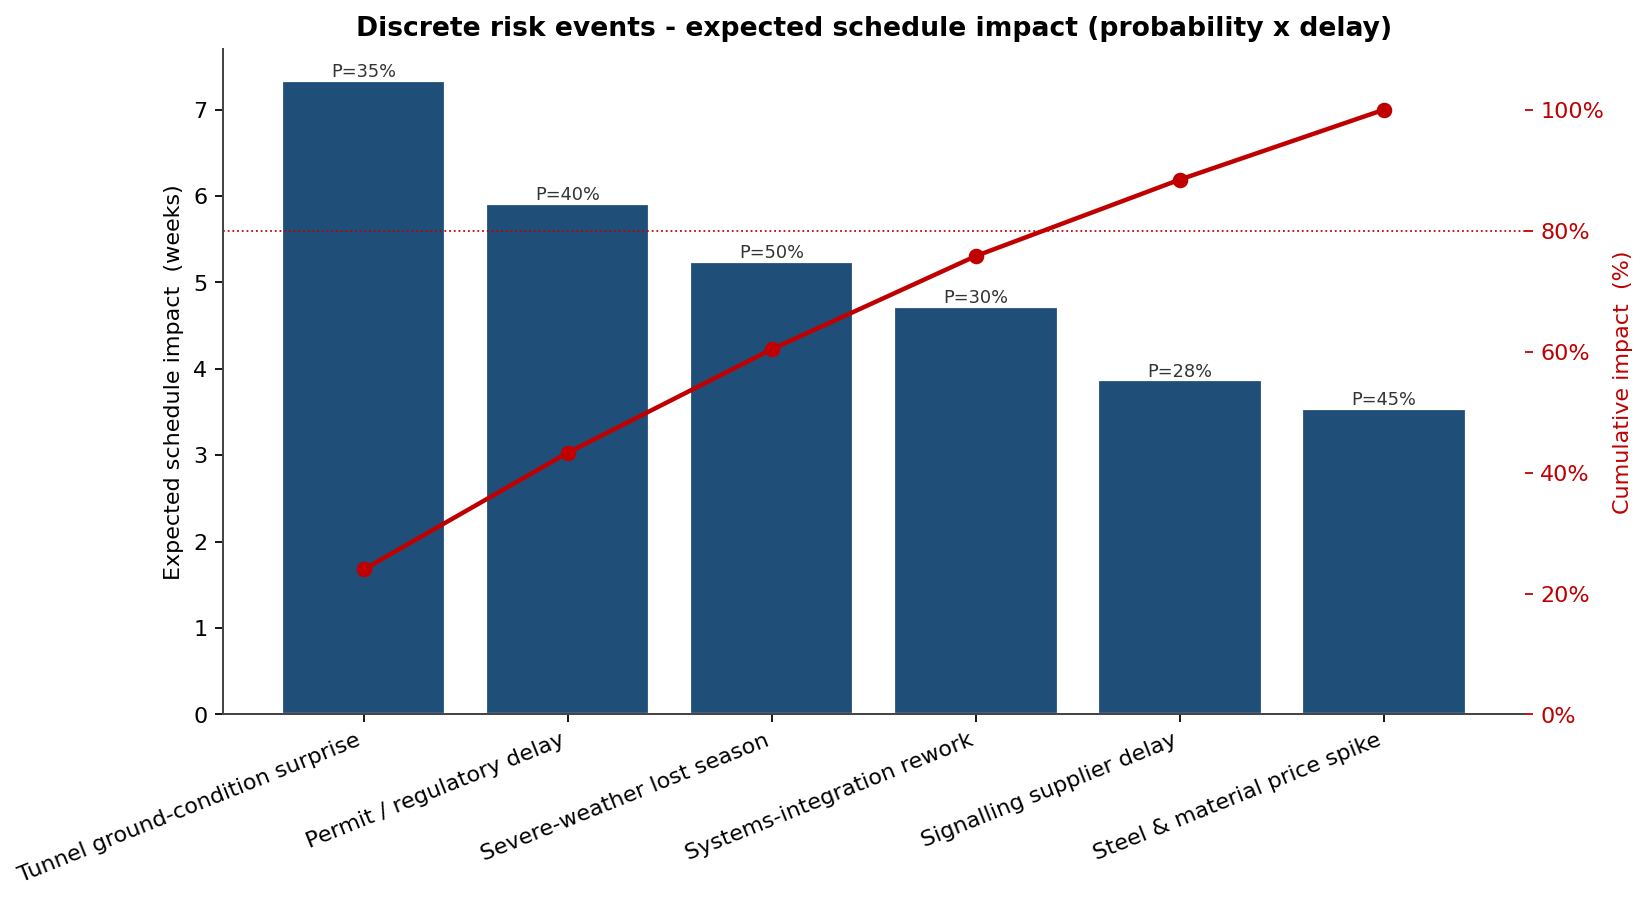
Five of the six events carry ~80% of the expected discrete-event delay — a tunnel ground-condition surprise (7.3 weeks expected), permit/regulatory delay (5.9), a severe-weather lost season (5.2), systems-integration rework (4.7) and a signalling supplier delay (3.9), with a steel/material price spike (3.5) trailing. Once the ranking is visible, the risk-response budget writes itself.
What Tamara Changed
- Risk-reduction effort was redirected to design & permitting and systems integration — the two highest-cruciality packages (0.50 and 0.47) — instead of being spread evenly across the bar chart.
- The external commitment moved from the 2%-likely May 2030 date to a risk-informed P80, ending the rolling-promise cycle with the funder and concession authority before it began.
- An 11.7-month schedule contingency was quantified and funded, rather than discovered one slipped milestone at a time.
- A mitigation package was approved on its tail-clipping effect, cutting budget-overrun probability from 19% to 9%.
Tamara Functionality Used
- Monte Carlo schedule simulation over the full programme network, with Beta-PERT durations and parallel-chain merge logic.
- Discrete risk-event modelling (Bernoulli occurrence × Triangular impact) layered onto package durations and costs.
- Criticality and cruciality analysis distinguishing how often a package is critical from how much its variability moves the finish, mapped on one scatter.
- Stochastic Gantt and finish-date histogram for communicating schedule uncertainty to non-technical stakeholders.
- Integrated cost–schedule modelling linking finish-date overruns to programme overhead, so mitigations are priced on their joint effect.
- Scenario comparison quantifying a mitigation package's before/after impact on both the P80 finish and the overrun probability.
A large-scale programme is not a date; it is a distribution whose body the board can plan against and whose tail it cannot afford to ignore. Tamara is what tells the board which two packages to de-risk first — and what that buys.