

Supply chain disruptions
A pharmaceutical commercial-supply build is a long, regulated, fragile chain exposed to API sourcing, manufacturing and a regulatory PAS - any of which can stall the launch. With six discrete disruptions in play, the first question is not "when?" but "which disruptions own the schedule risk?" This case study runs a Tamara schedule-risk model of an 11-activity supply build-and-qualification programme to rank them.
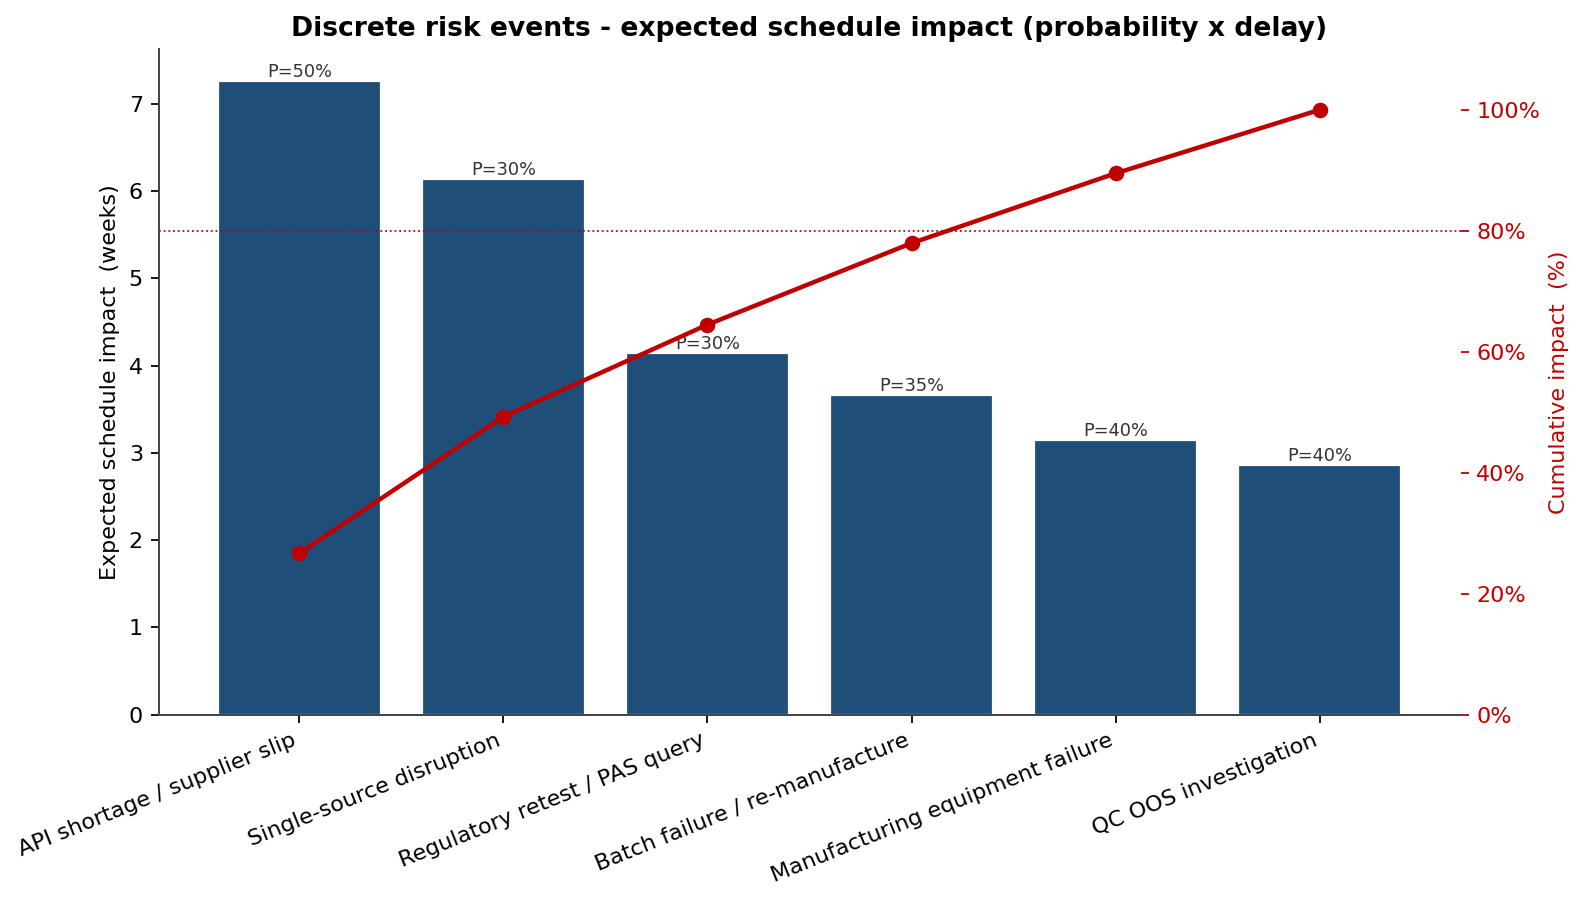
The discrete-risk Pareto is the headline. API shortage/supplier slip tops it at 7.3 expected weeks of delay (27% of the total) and single-source disruption adds 6.1 weeks (23%) - together 49% of the expected discrete-risk delay sits in just two events, both on API supply. The cumulative line makes the case for concentrating dual-sourcing and safety-stock effort there; the top five of six events carry ~80% of the delay.
The model
Eleven activities with three-point PERT durations on a critical-path network, plus six discrete supply-chain risk events - API shortages, single-source disruption, equipment failure, batch failures, QC investigations and a regulatory PAS query. One Monte-Carlo of 60,000 iterations drives every chart.
Two API events own 49% of the delay risk
The Pareto's message is concentration: the two API-supply events alone account for nearly half the expected discrete-risk delay, far ahead of regulatory retest (4.1 weeks) and batch failure (3.7 weeks).
How the stages phase
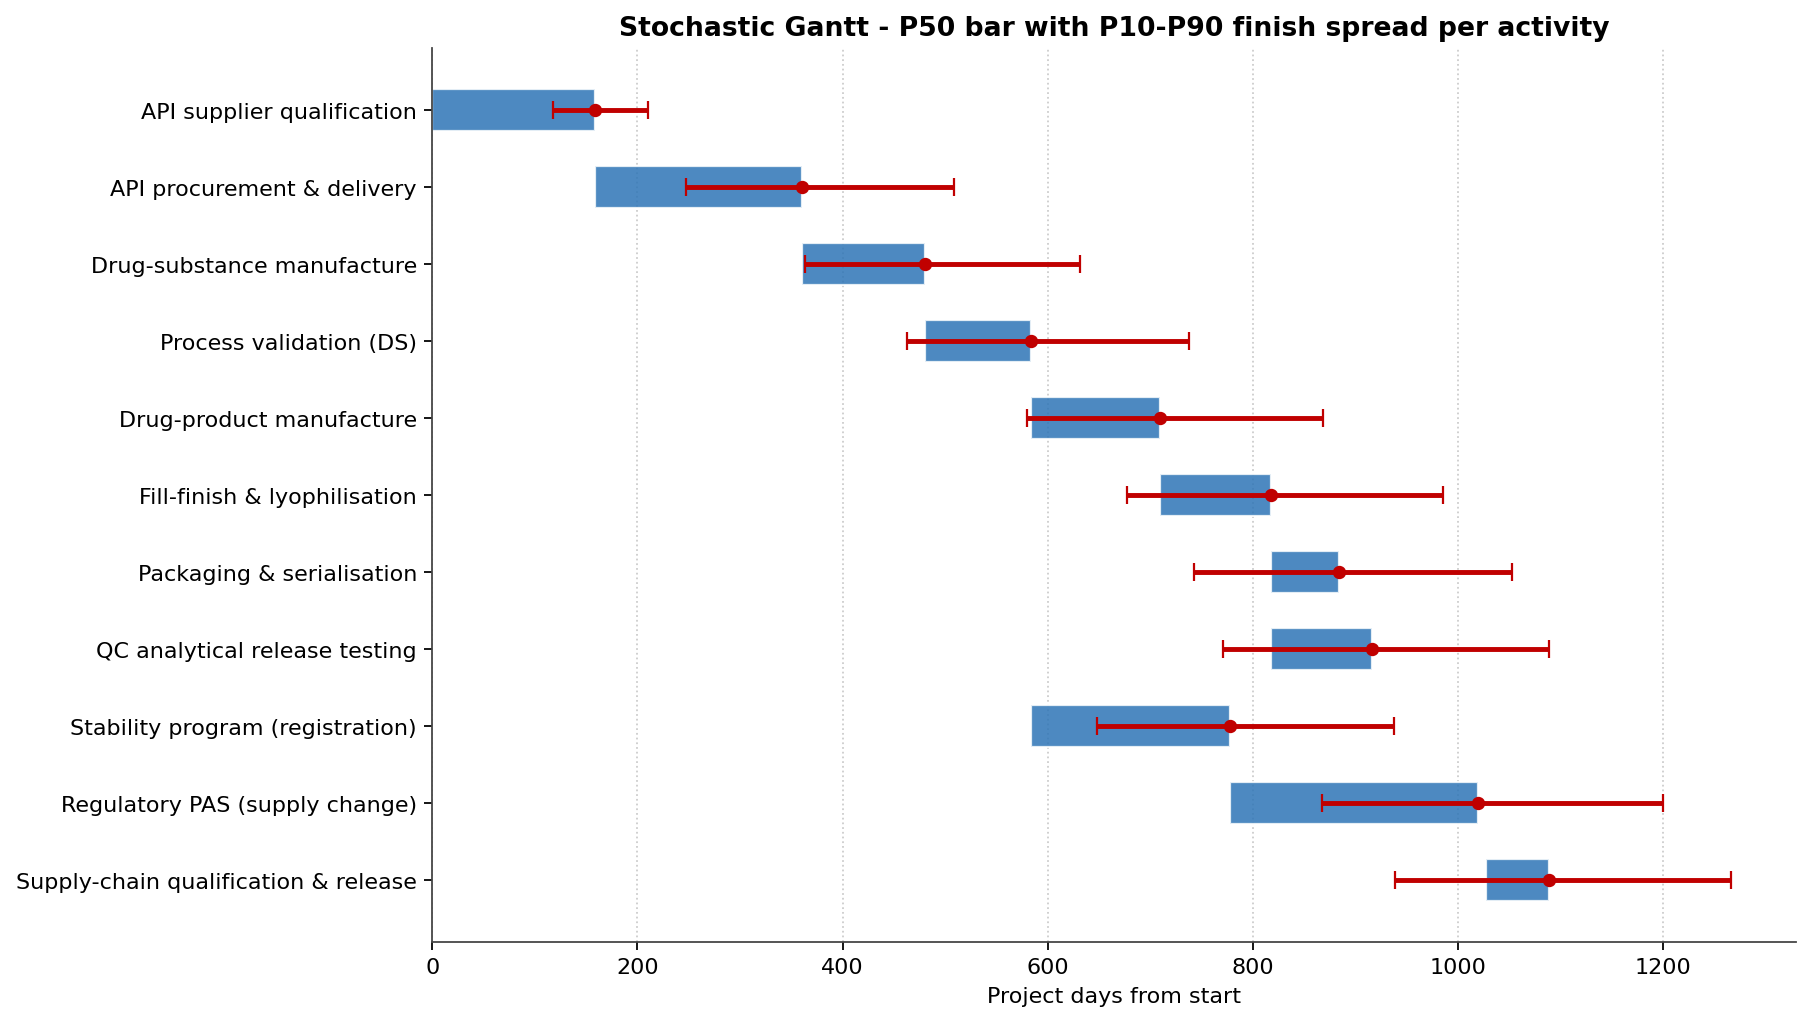
The Gantt shows the supply build sequence. API qualification and procurement carry the widest bands and sit at the front of the chain - their slippage pushes everything downstream.
API procurement drives readiness at 0.72 cruciality
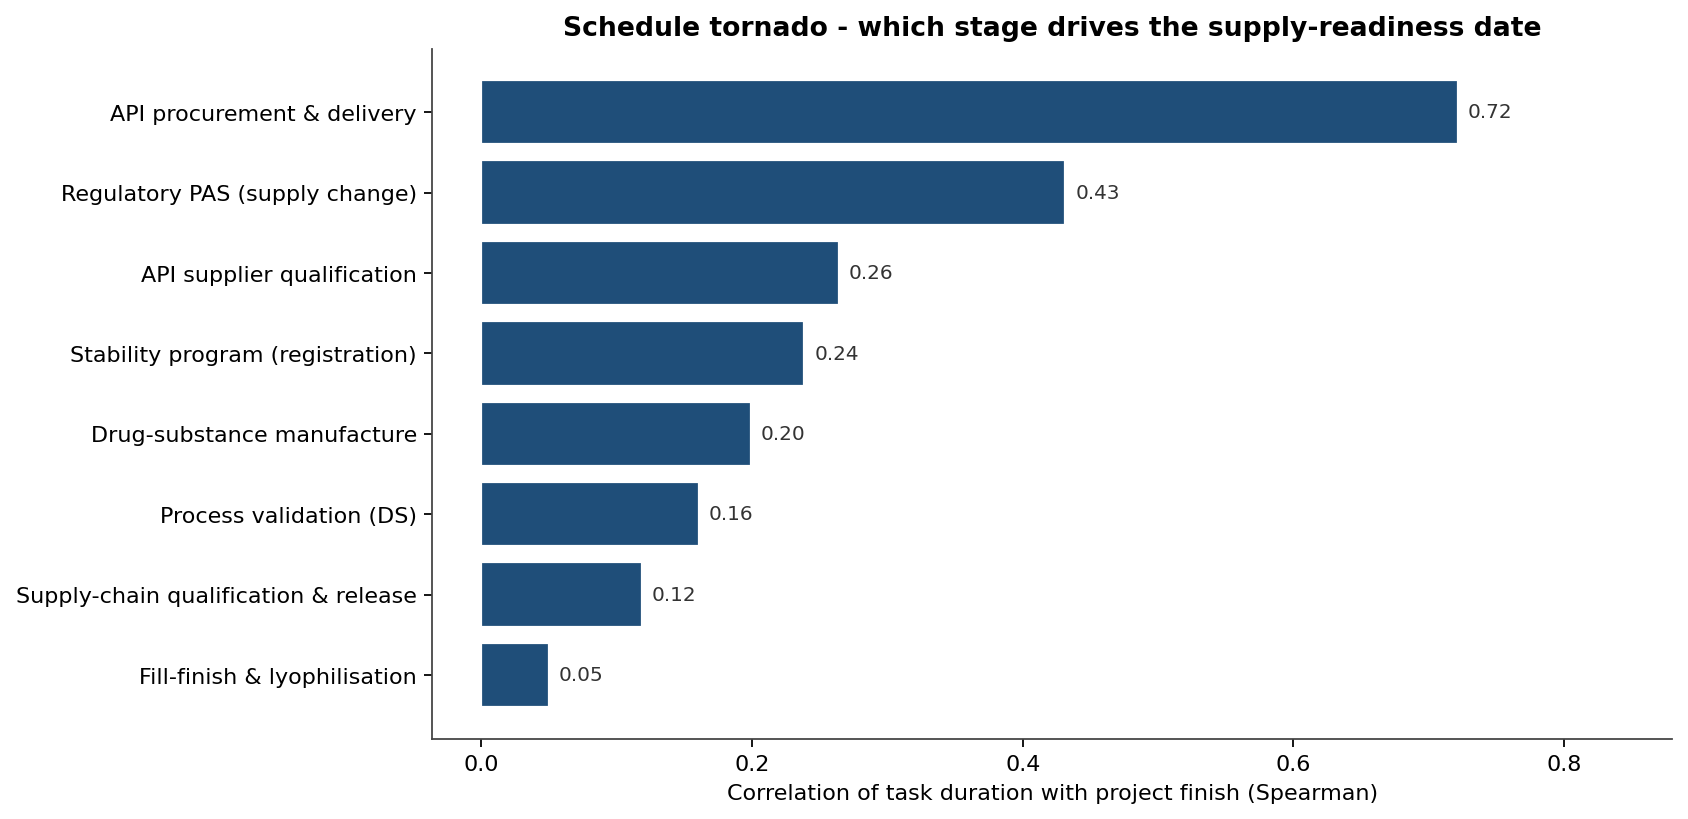
The tornado confirms the Pareto from the duration side: API procurement and delivery dominates at a cruciality of 0.72, far ahead of the regulatory PAS (0.43) and API supplier qualification (0.26). The single most disproportionate driver is the API line - exactly the dependency a single-source supply chain is most exposed on.
Mitigation cuts overrun probability from 33% to 7%
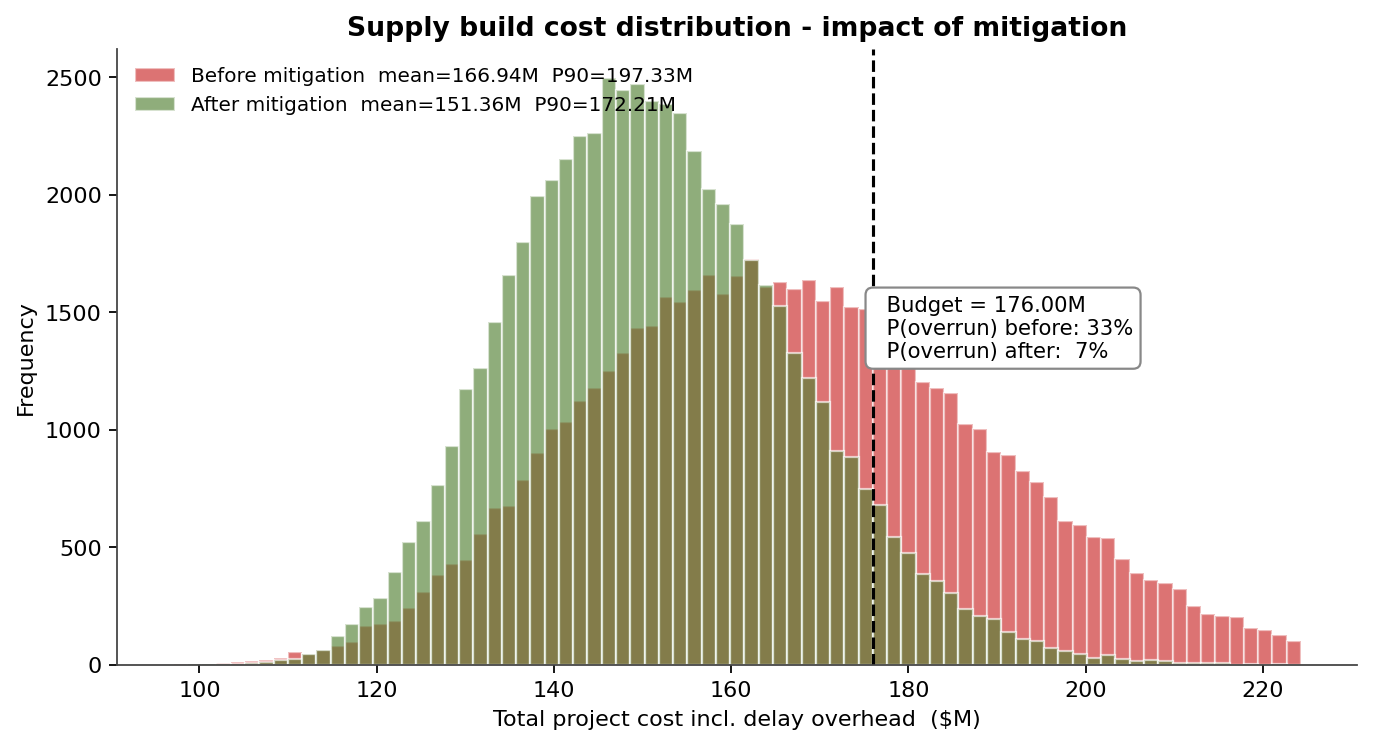
Cost is schedule-linked: every day past plan carries about $0.10M of expedited freight and idle-capacity overhead. Before mitigation the cost mean is $167M with a P90 of $197M against a $176M budget - a 33% overrun chance. The mitigation case (dual sourcing, safety stock, parallel batches) pulls the mean to $151M and the P90 to $172M, cutting the overrun probability to 7% and the P80 finish from 1,203 to 1,093 days.
The supply-readiness date spread
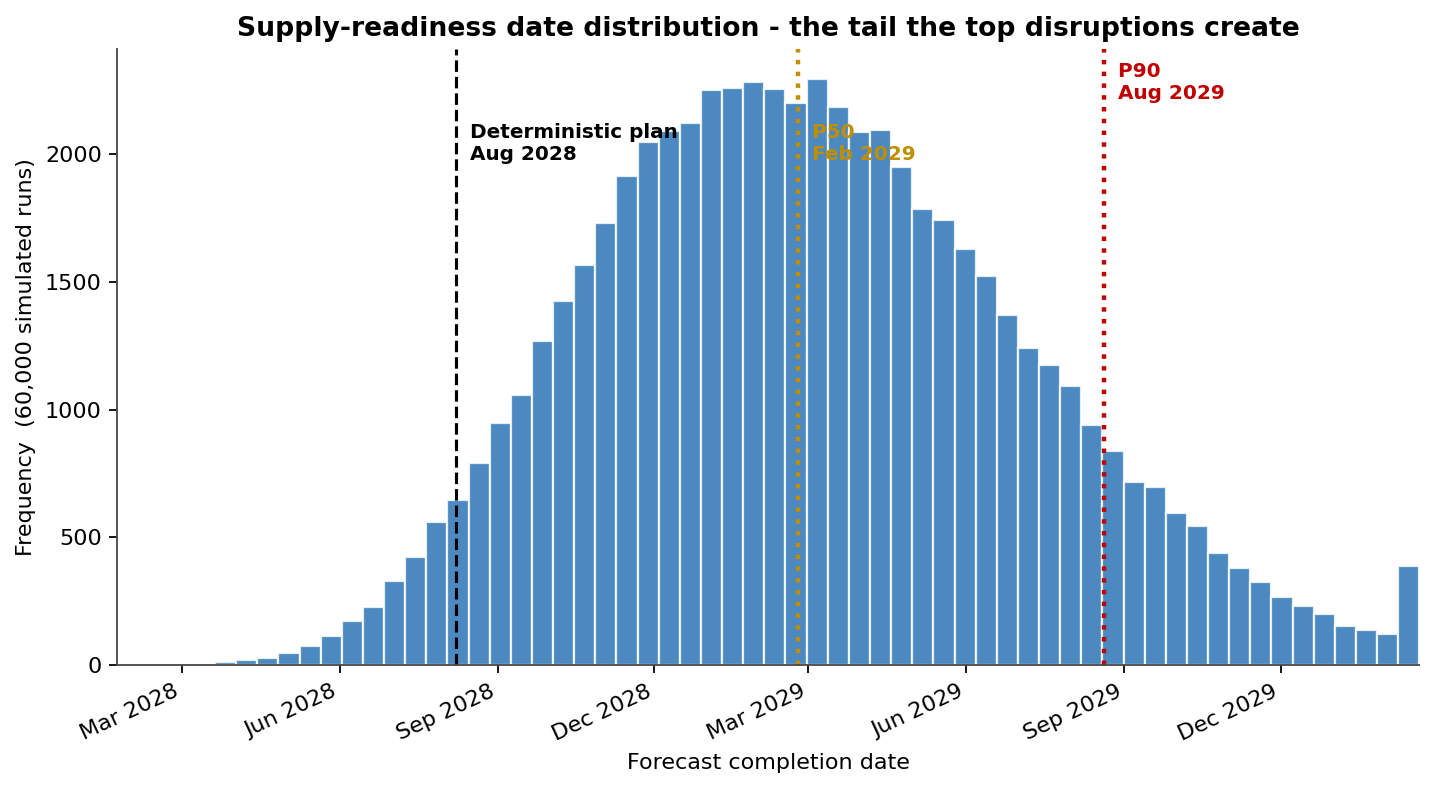
The finish distribution closes the loop: a right-skewed readiness-date spread with a P50 of 1,089 days, a P80 of 1,203 and a P90 of 1,267 days - 377 days beyond the 890-day deterministic plan, the tail those two dominant API events create.