

Refinery operation risks
A refinery turnaround is the highest-stakes schedule in downstream oil and gas: a time-boxed event in which the unit is down, margin is deferred every single day, and discovered scope can blow the plan apart once vessels are opened. The planning question is not a single date but a window - and the shape of that window is what a deterministic plan hides. This case study runs a Tamara schedule-risk model of an 11-activity turnaround - planning and long-lead through shutdown, inspection, the exchanger/compressor/vessel repairs, reassembly and start-up - to draw it.
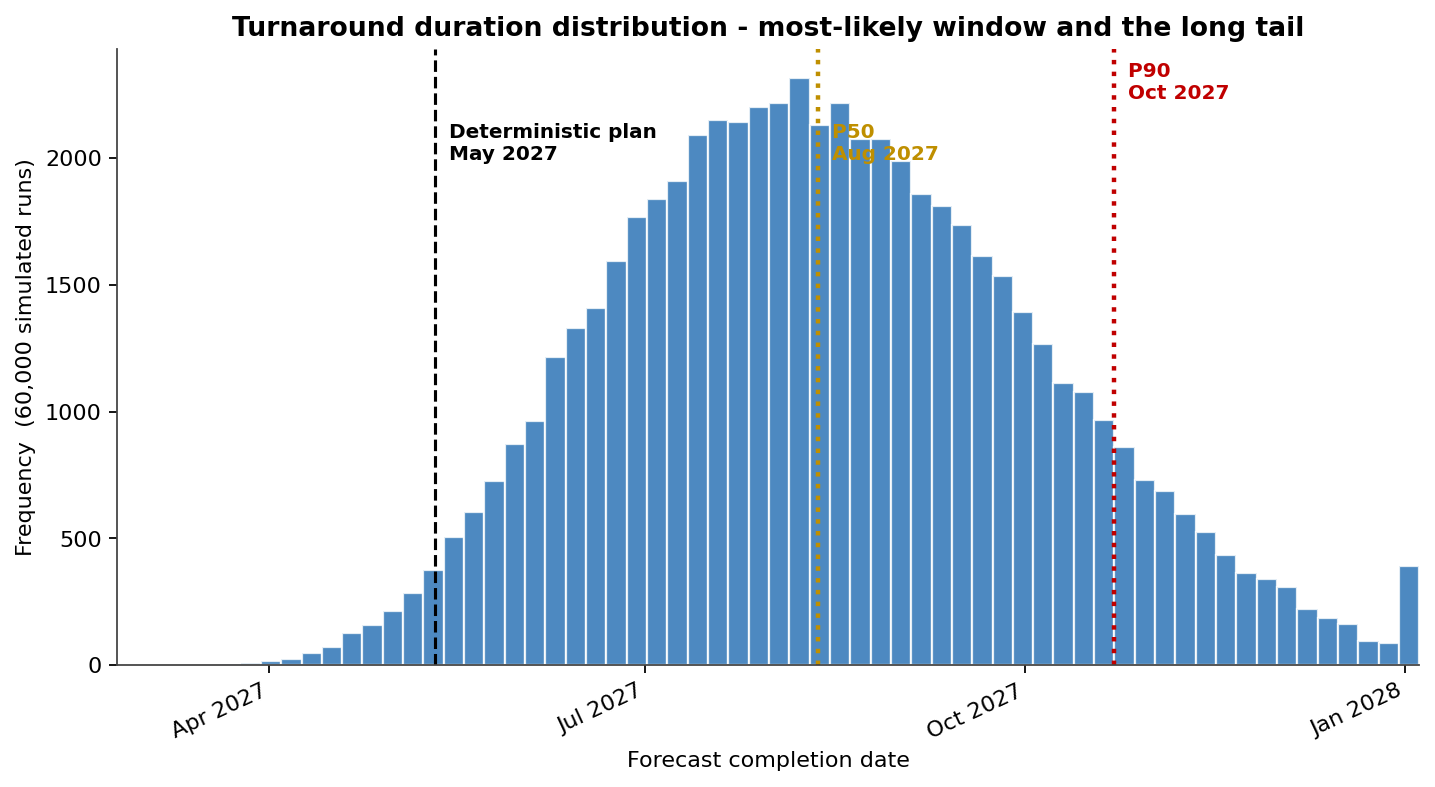
The duration distribution is the headline. The bulk of outcomes clusters near the P50 of 339 days, but the right tail runs out to a P90 of 411 days - 165 days beyond the 246-day deterministic plan. That tail, not the mode, is the downtime exposure: the plan is beaten in only 2% of runs, and the P80 duration is 385 days.
The model
Eleven activities with three-point PERT durations on a critical-path network, plus six discrete risk events - long-lead slips, discovered scope, compressor damage, labour gaps, leak-test and start-up upsets. One Monte-Carlo of 60,000 iterations drives every chart.
P90 runs 165 days past the deterministic plan
The simulated finish spans P50 339, P80 385 and P90 411 days against a 246-day plan. Reaching P80 requires 139 days of contingency - the discovered-scope and long-lead tails are brutal once the unit is open.
How the turnaround phases
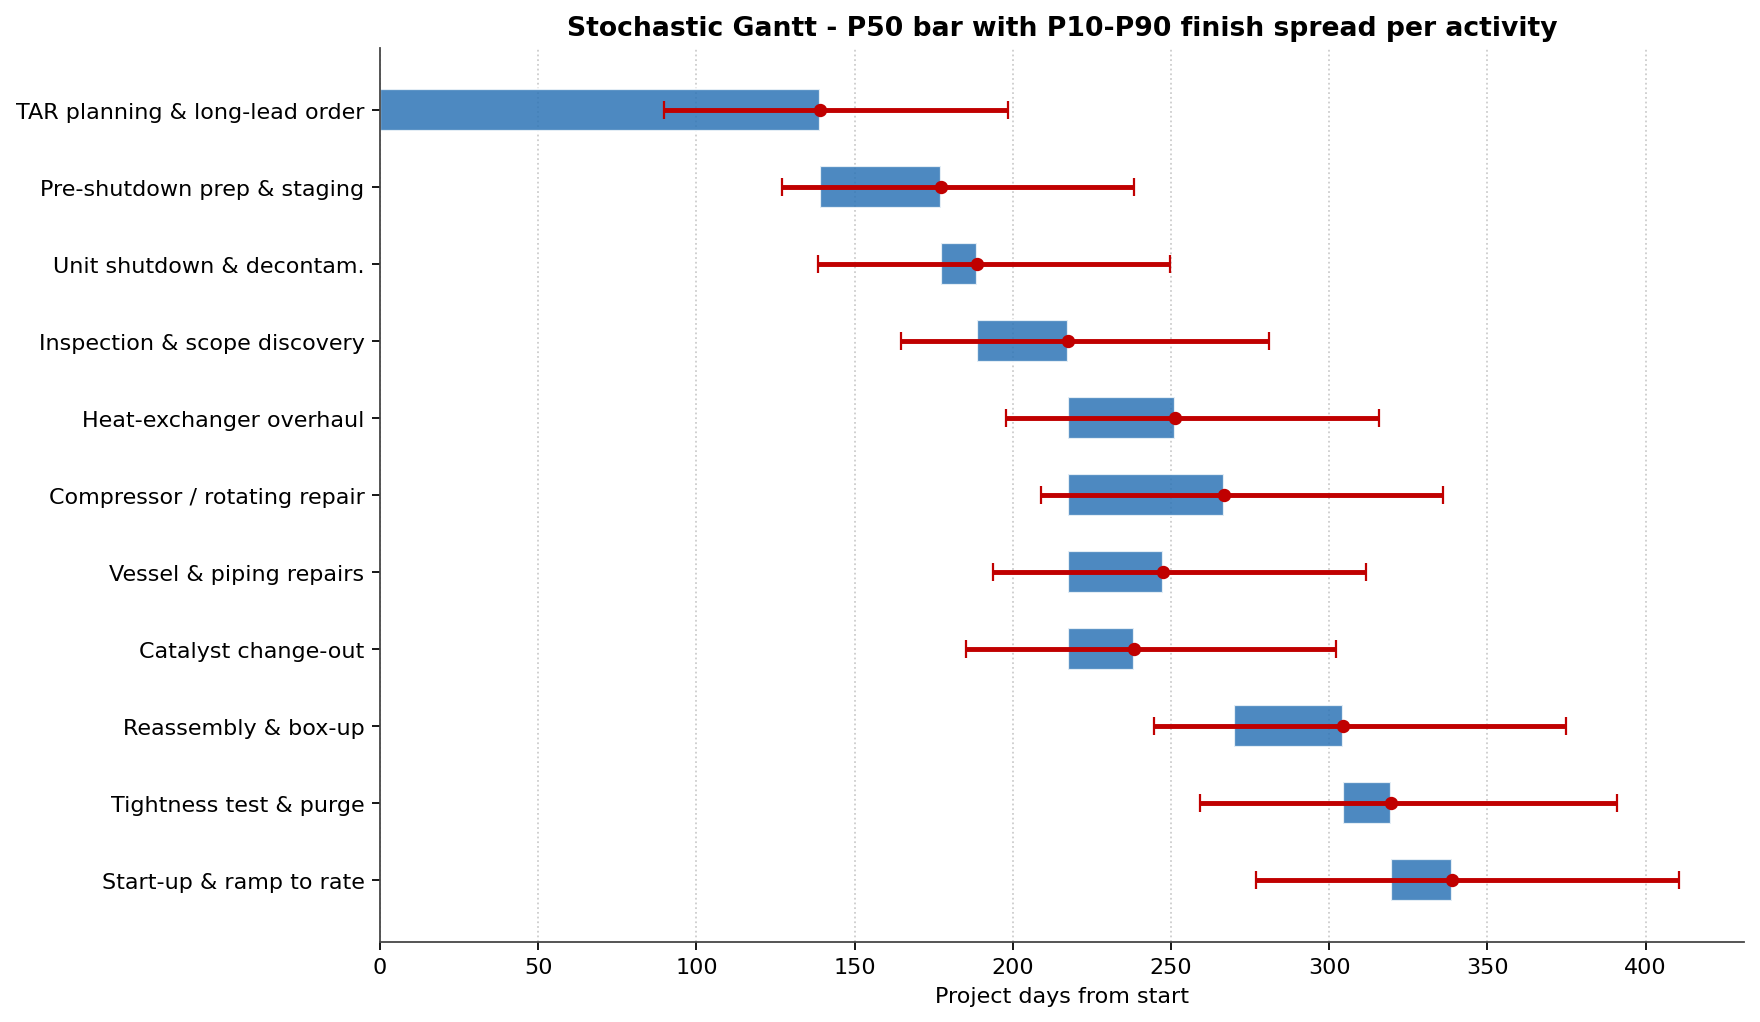
The Gantt shows the turnaround sequence and its spread. The repair activities - exchanger, compressor, vessel - carry the widest P10-P90 bands because discovered scope can balloon them once the unit is opened and inspected.
TAR planning leads at 0.79 cruciality
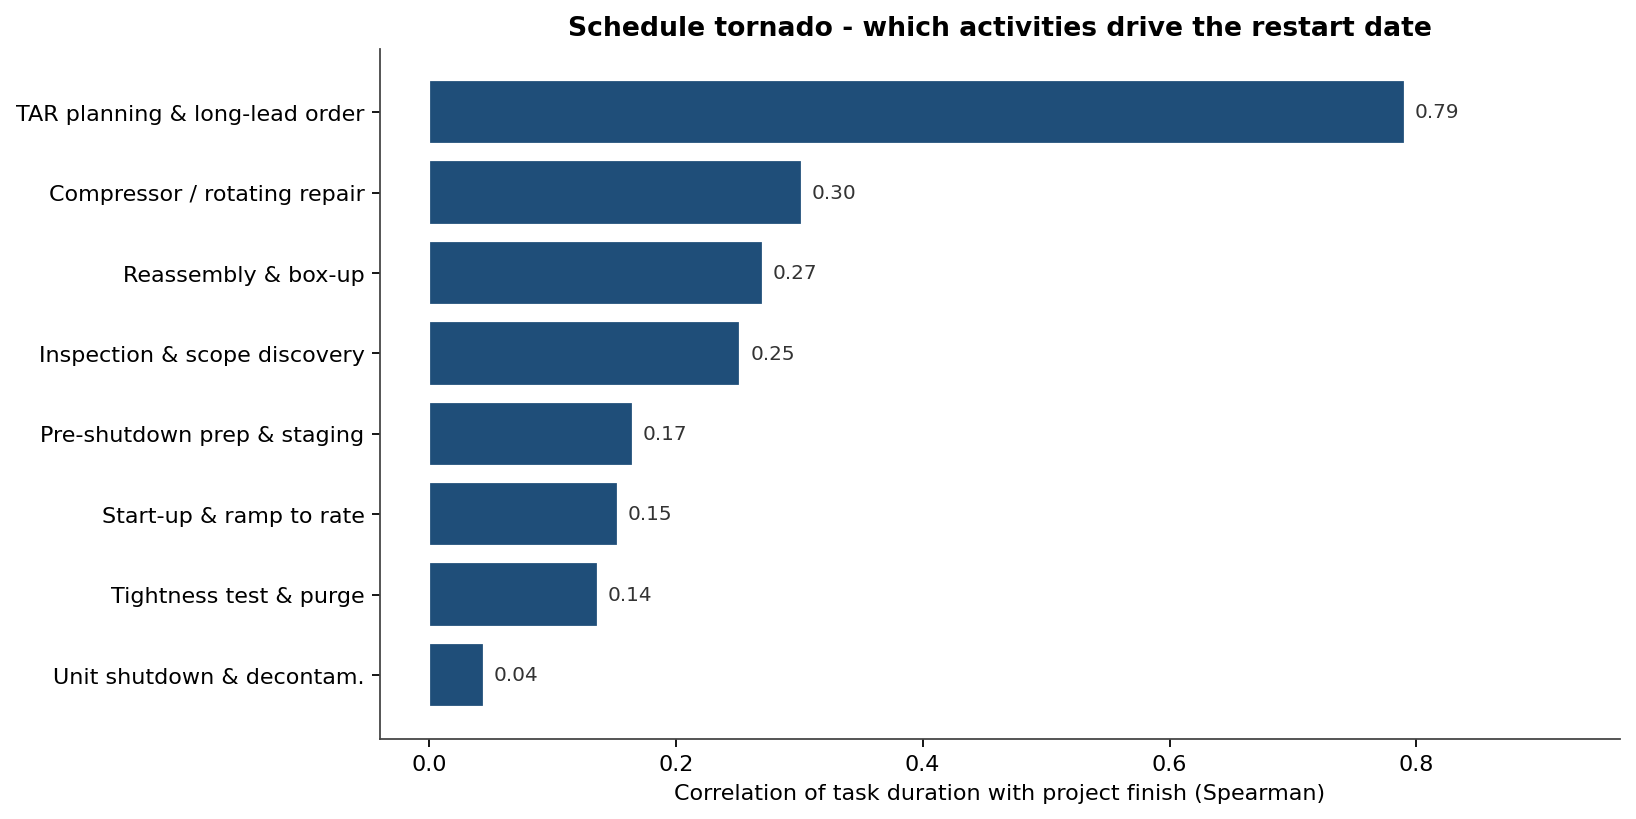
The tornado ranks activities by correlation with the restart date. TAR planning and long-lead ordering dominates at a cruciality of 0.79 - it gates everything - with compressor/rotating repair a distant second at 0.30. The restart date is set months before the unit shuts, in the procurement of long-lead spares.
Deferred margin tracks every downtime day - 29% over budget
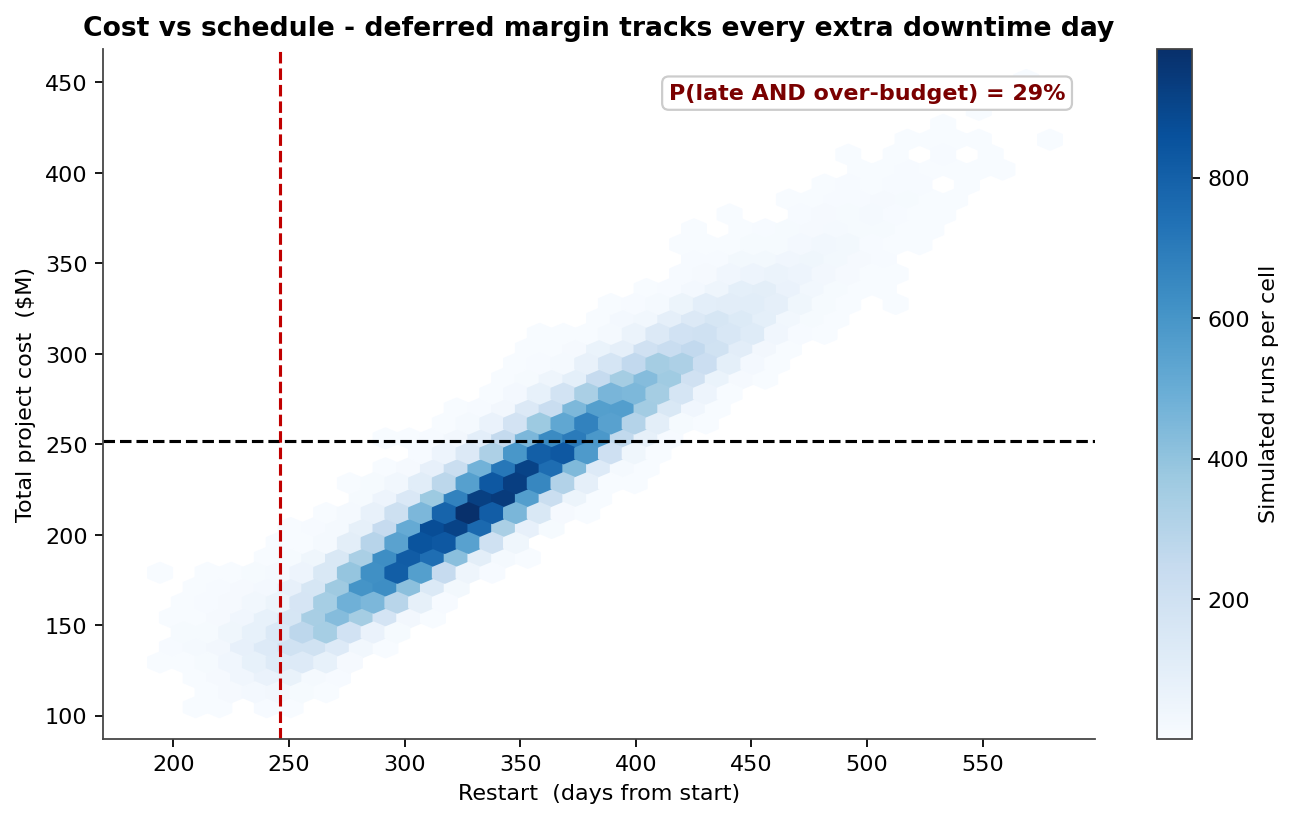
Cost is overwhelmingly schedule-driven: every day the unit is down past plan defers about $0.9M of refining margin, so cost and schedule overrun together. The joint density shows 29% of runs finishing both late and over the $252M budget; at P80 the turnaround reaches 385 days and an all-in $268M, already $16M past budget. The all-in cost mean is $227M with a P90 of $291M. Every day of certainty bought on the long-lead front end caps both axes at once.
Where the discrete-risk delay concentrates
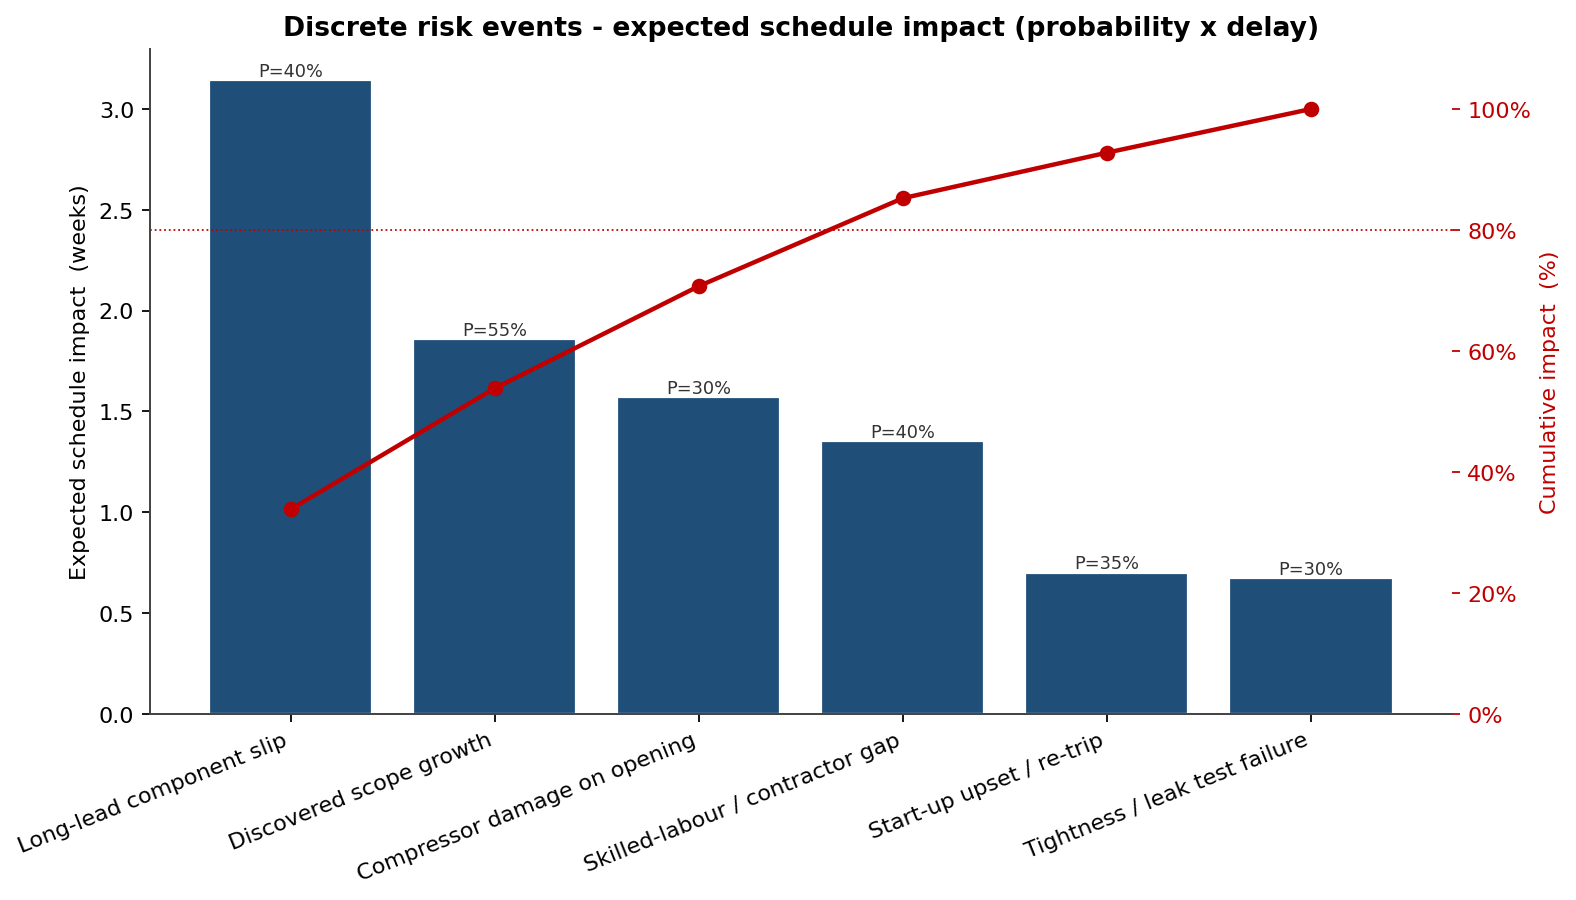
The Pareto ranks the discrete risk events by expected schedule impact. Long-lead component slip tops it at 3.1 expected weeks with discovered scope growth next at 1.9 weeks; the top four of six events carry ~80% of the expected discrete-risk delay - confirming the long-lead chain as the place to act first.