

Exploration project risks
A deepwater wildcat is the sharpest end of project risk in the upstream business: a single well can cost hundreds of millions, and its two big exposures move together - every day of schedule slip is also a day of rig stand-by and overhead. The clearest way to see that is not a schedule chart or a cost chart but both at once. This case study runs a Tamara schedule-risk model of an 11-activity exploration-to-FID programme - seismic through drilling, appraisal and sanction - to show how cost and schedule overrun as one problem.
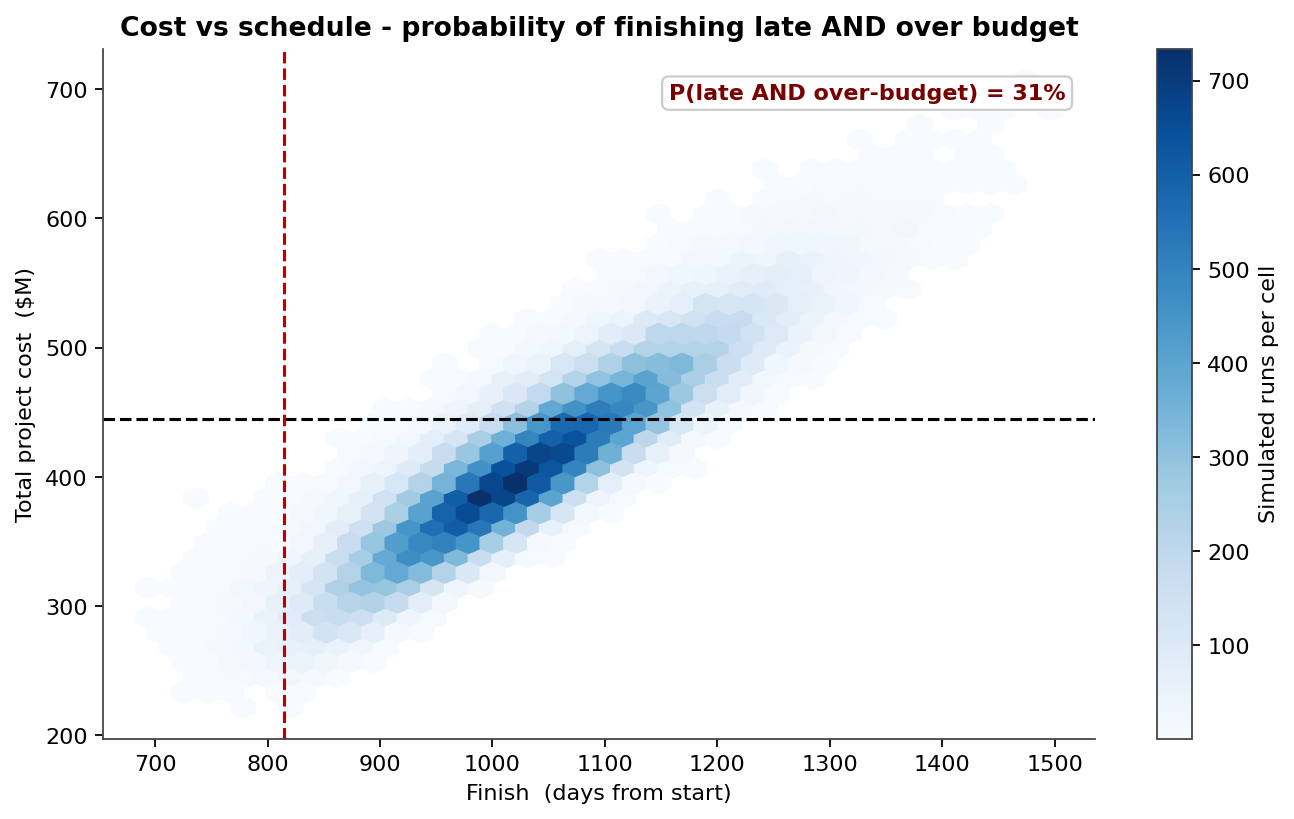
The joint cost-vs-schedule density is the single most decision-relevant output here. Each cell bins simulated campaigns; the cloud climbs from lower-left to upper-right because every extra day past the 815-day deterministic plan adds about $0.55M of overhead. The plan line and the $445M budget line carve out the danger quadrant: 31% of runs finish both late and over budget. At P80 the campaign lands at 1,127 days and $468M - already $23M past budget.
The model
Eleven activities, each with a three-point PERT duration estimate, chained through a critical-path network. Six discrete risk events sit on top - permit delays, weather, rig slips, geology - each with a probability and a delay impact. One Monte-Carlo of 60,000 iterations drives every chart below.
31% of runs finish late AND over budget
The 815-day deterministic rollup is beaten in just 1% of simulations. Reaching an 80% confidence date needs 312 days of contingency - more than ten months - and because cost rides on schedule, that same slip pushes 31% of runs past the $445M budget on the cost axis.
The FID-date distribution runs to P90 1,178 days
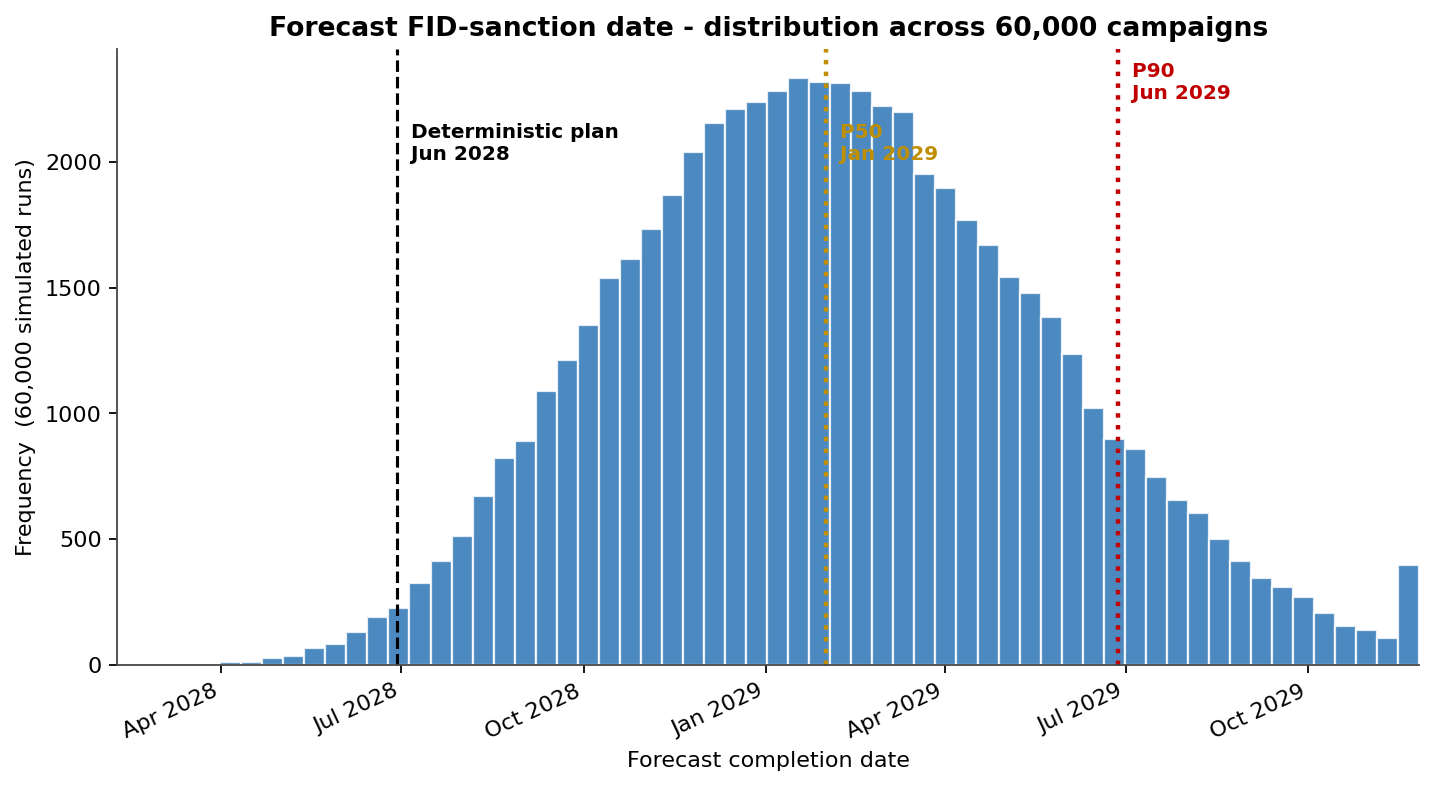
The finish-date distribution shows where the schedule axis of that joint plot comes from. The bulk of outcomes clusters near the P50 of 1,031 days, but the right tail runs to a P90 of 1,178 days - 363 days beyond the 815-day plan. The P80 lands at 1,127 days; the deterministic plan sits at the far left, in the thin first percentile.
Permitting drives the FID date at 0.61 cruciality
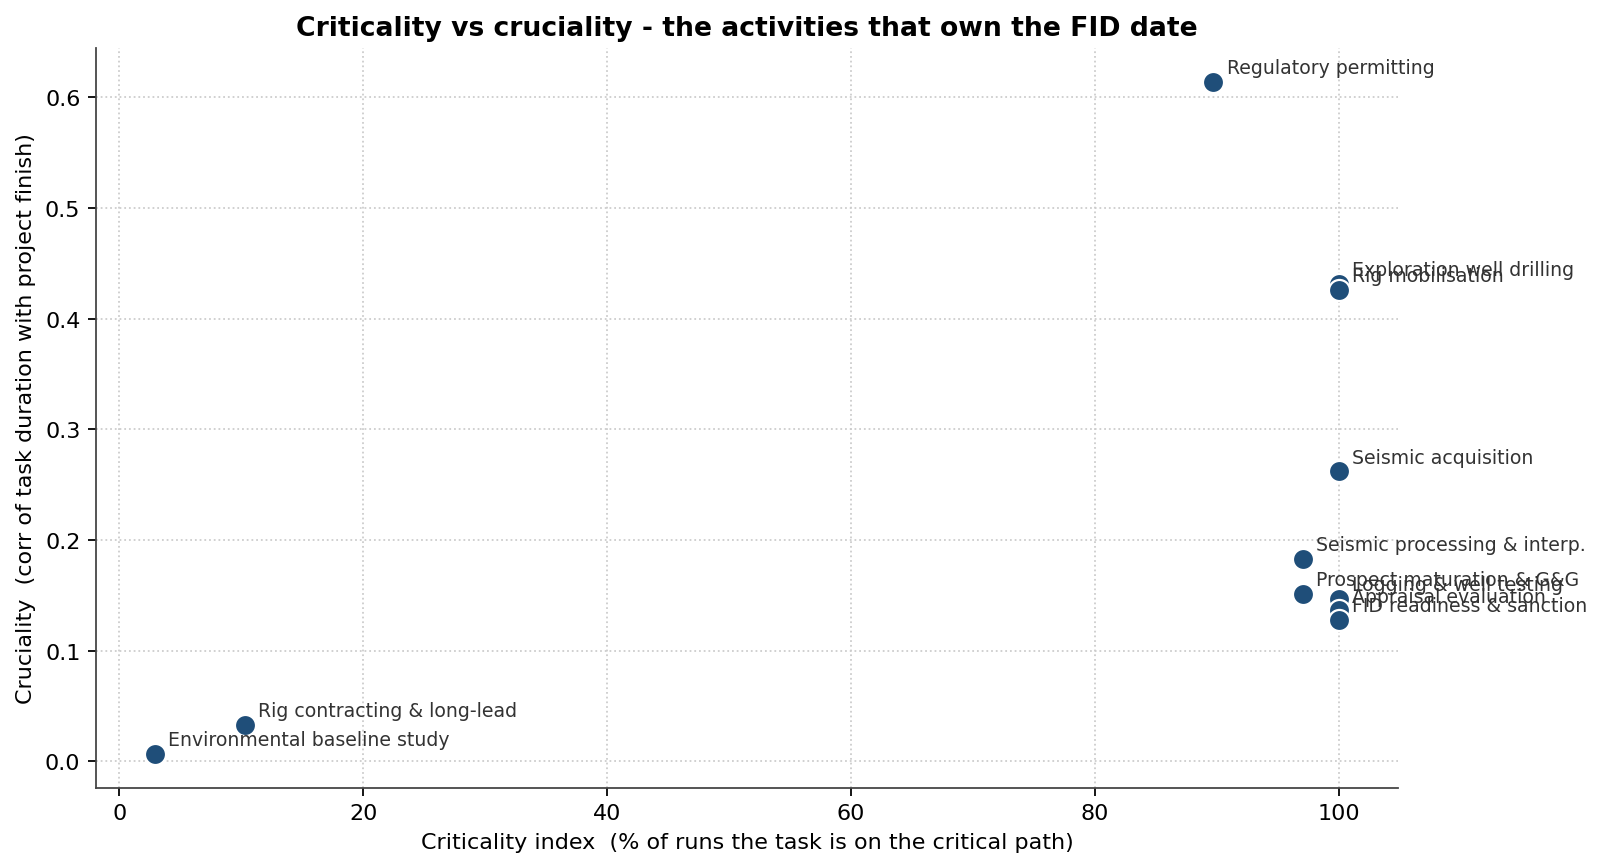
The criticality-vs-cruciality scatter places each activity by how often it sits on the critical path (x) against how strongly its duration correlates with the FID date (y). Regulatory permitting is the standout in the top-right - on the critical path in 90% of runs with a cruciality of 0.61 - the single activity worth the most management attention, ahead of exploration well drilling and rig mobilisation at 0.43.
Mitigation cuts overrun probability from 31% to 5%
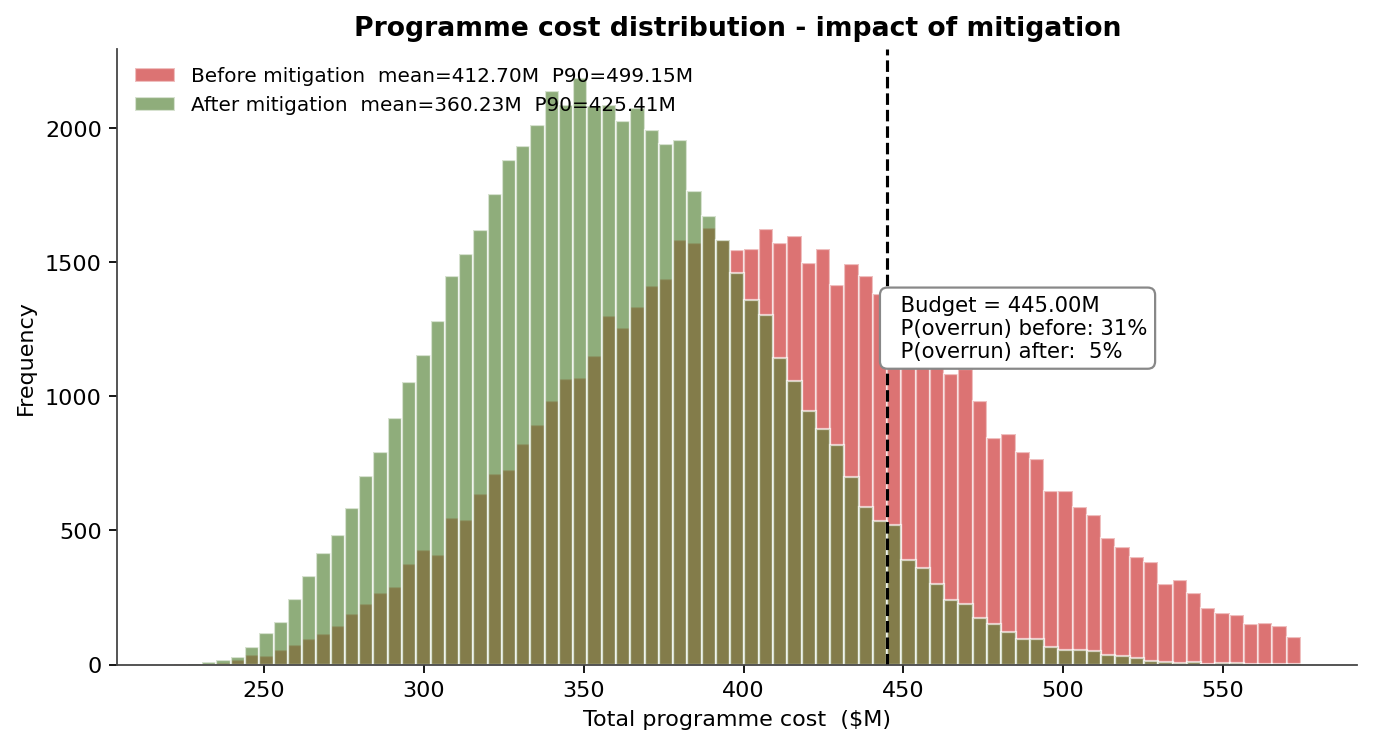
Cost is schedule-driven here: every day beyond plan carries about $0.55M of rig stand-by and overhead. The before-mitigation cost distribution has a mean of $413M and a P90 of $499M against a $445M budget - a 31% chance of overrun. The mitigation case (secured rig slot, calm-season drilling, early permitting) pulls the mean to $360M, the P90 to $425M, and cuts the overrun probability to 5%; the P80 finish improves from 1,127 to 1,013 days.
Where the discrete-risk delay concentrates
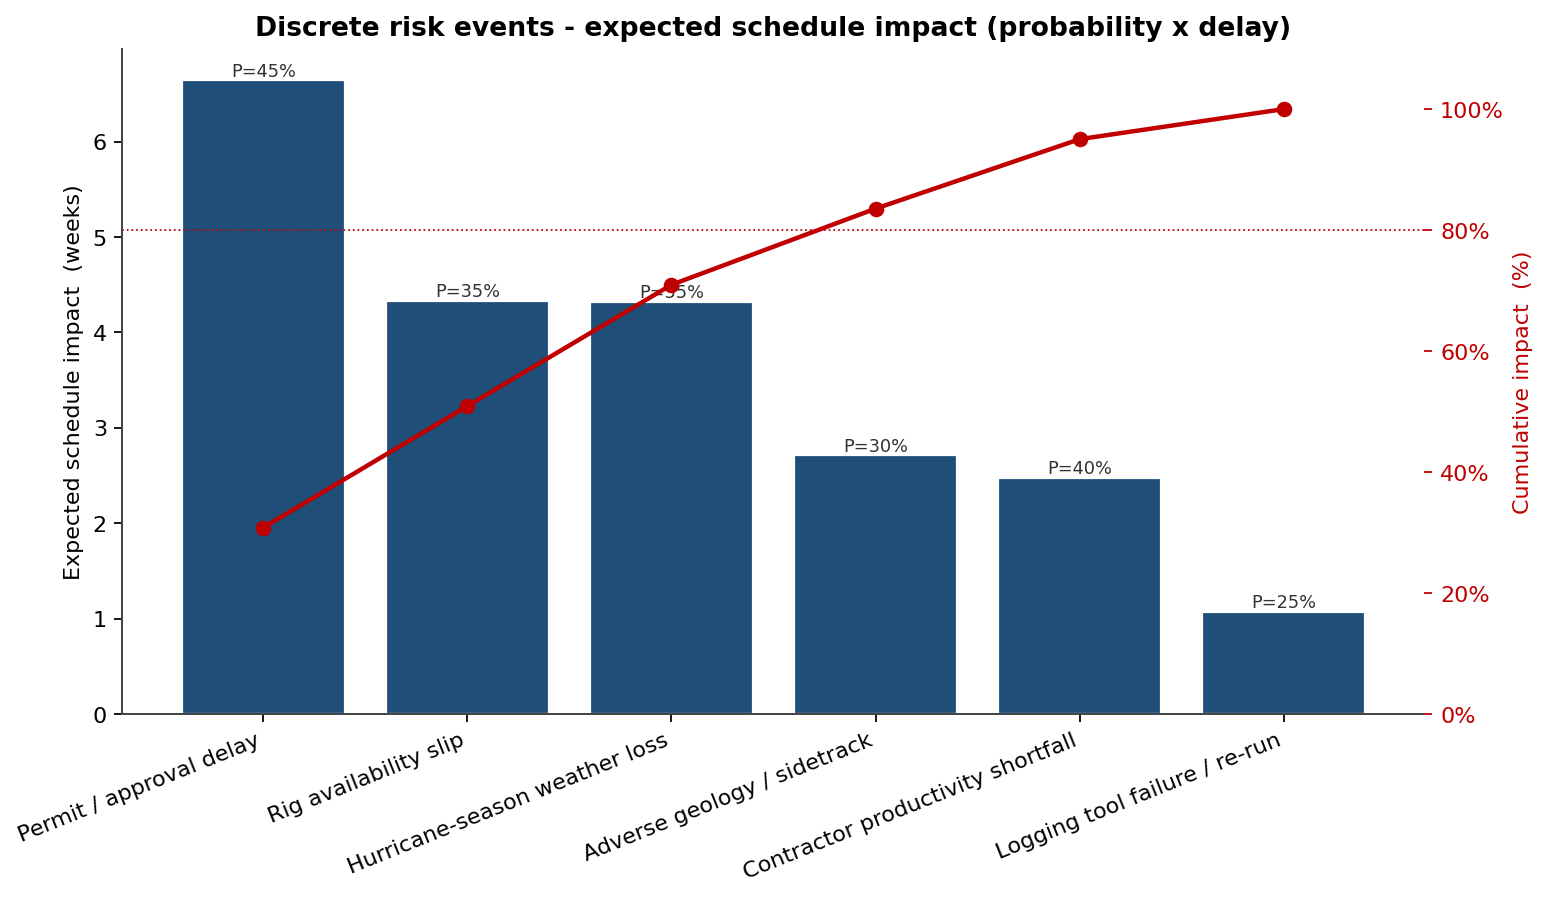
The Pareto ranks the discrete risk events by expected schedule impact. Permit/approval delay carries the most at 6.6 expected weeks, followed by rig availability and hurricane-season weather loss at 4.3 weeks each. The top four of six events account for ~80% of the expected discrete-risk delay - so that is where contingency budget and management effort belong.