

Mine exploration project risks
A remote greenfield mineral-exploration programme runs eleven activities -- access and camp mobilisation, airborne geophysics, ground mapping, rig mobilisation, two drilling campaigns, assay analysis, resource estimation, infrastructure scoping, permitting and a pre-feasibility report. Six discrete exploration risks (geological uncertainty, contractor shortfalls, logistics, weather, permitting delays and cost escalation) can each push the programme out. Tamara runs the whole network as one 60,000-iteration Monte-Carlo, so every chart below is driven by the same model.
Exploration is funded in stages against milestones, and the standing camp and rig day-rates run whether drilling is on schedule or not. So the decision that matters most up front is not the headline date but the reserve behind it: how much schedule contingency does each level of confidence actually require?
The contingency a sponsor must actually budget
The ladder reads each confidence level straight off the 60,000 simulated pre-feasibility dates: the extra days beyond the 815-day deterministic plan needed to hit it. It is a decision table, not a forecast curve.
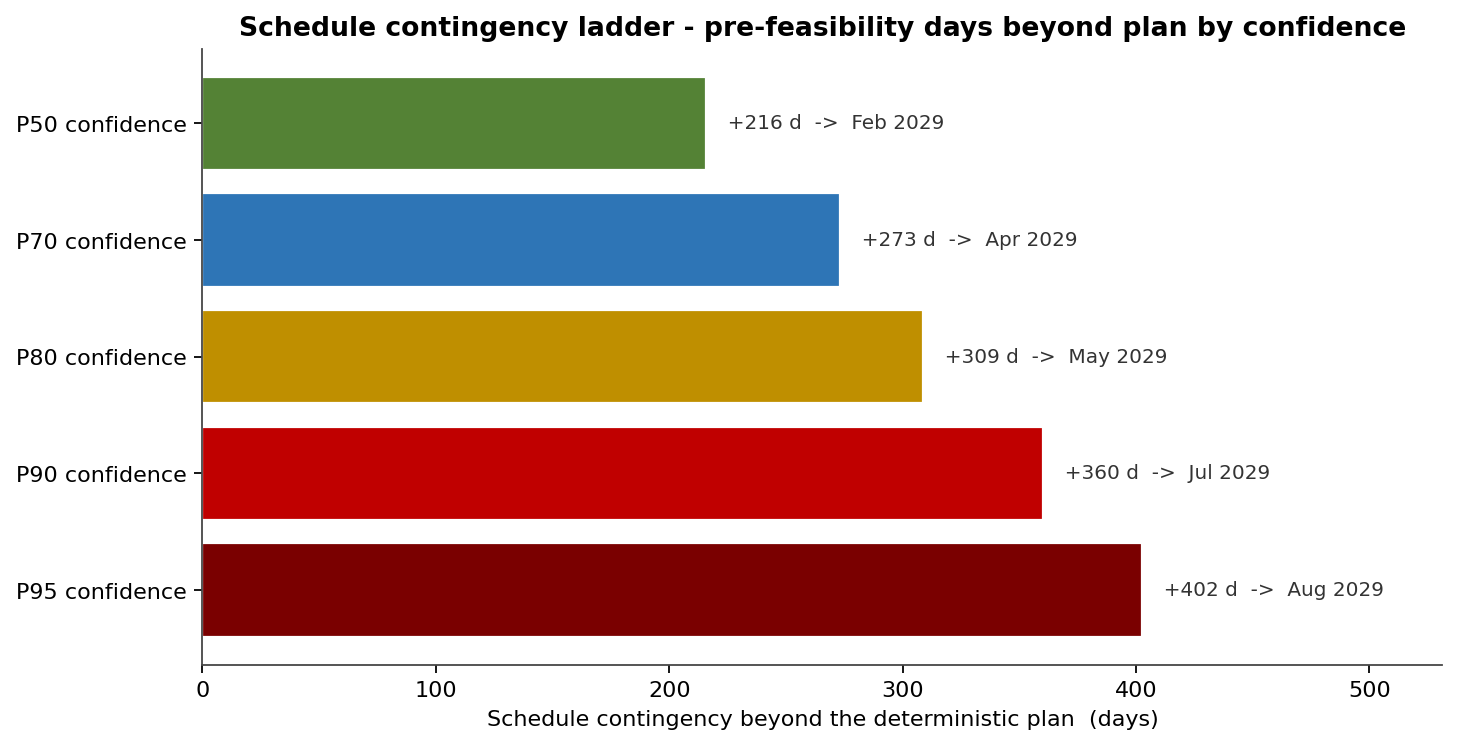
Hitting P50 takes +216 days (pre-feasibility at 1,031); P90 needs +360 days (1,175); and P95 demands +402 days (1,217). The deterministic 815-day plan sits below P10 -- only 1% of runs finish by it. The steady climb from P50 to P95 is the cost of certainty: buying the last increments of confidence adds nearly two-thirds again to the reserve, which is the trade-off a staged-funding board should see before committing the next tranche.
The finish date as a distribution
Behind the ladder is the full forecast. The histogram shows how the 60,000 simulated pre-feasibility dates spread, with the deterministic plan, P50 and P90 marked.
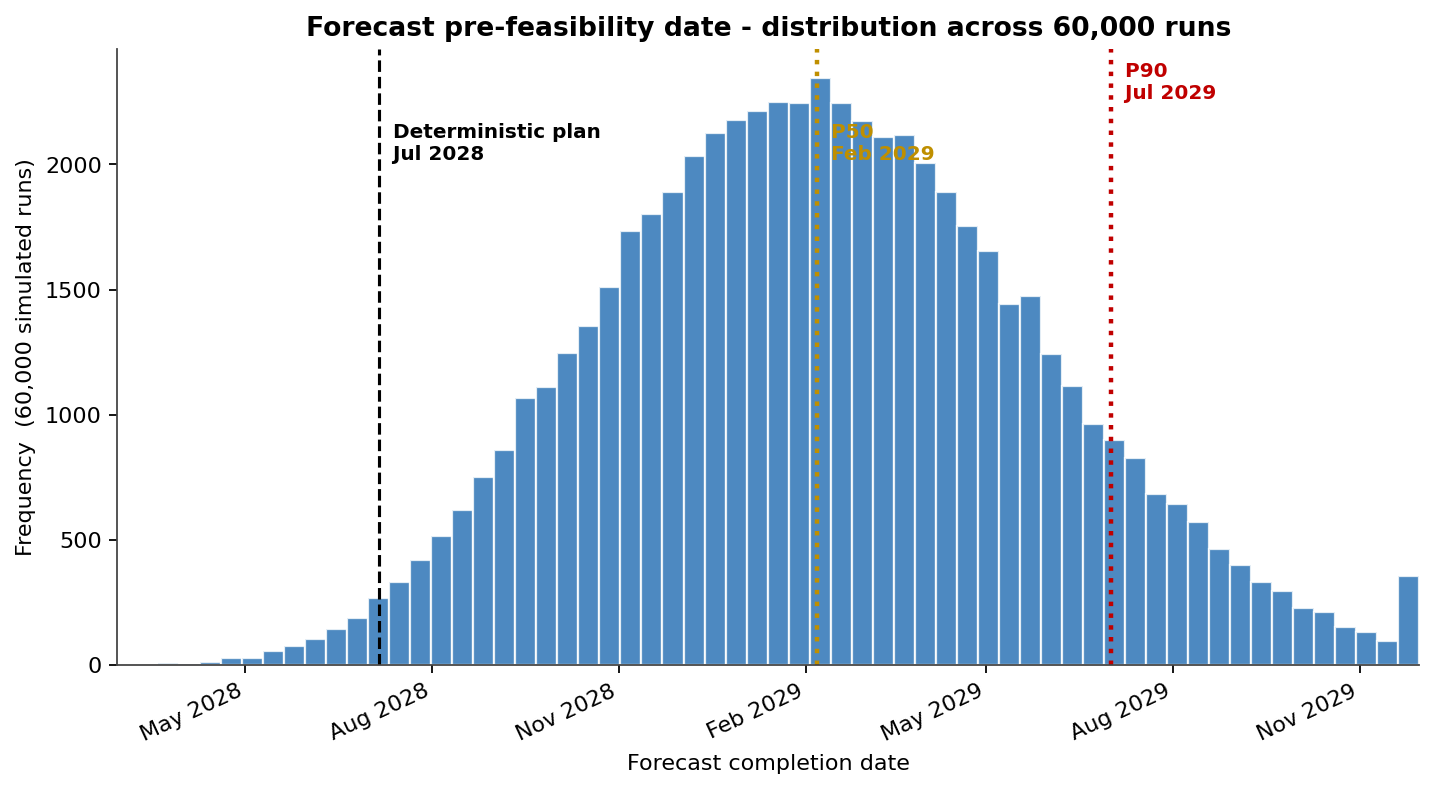
The bulk sits far to the right of the 815-day plan, centred on the P50 of 1,031 days with a P90 of 1,175, and a mean of 1,034. The schedule contingency from plan to P80 is 309 days -- about 10.1 months. The long right tail past the P90 is the deep-slippage scenario that exhausts both the schedule reserve and the funding tranche.
What actually drives the date
The histogram shows the spread; the tornado says which activity is responsible. It ranks each activity by the Spearman correlation between its own duration and the pre-feasibility date across all 60,000 runs.
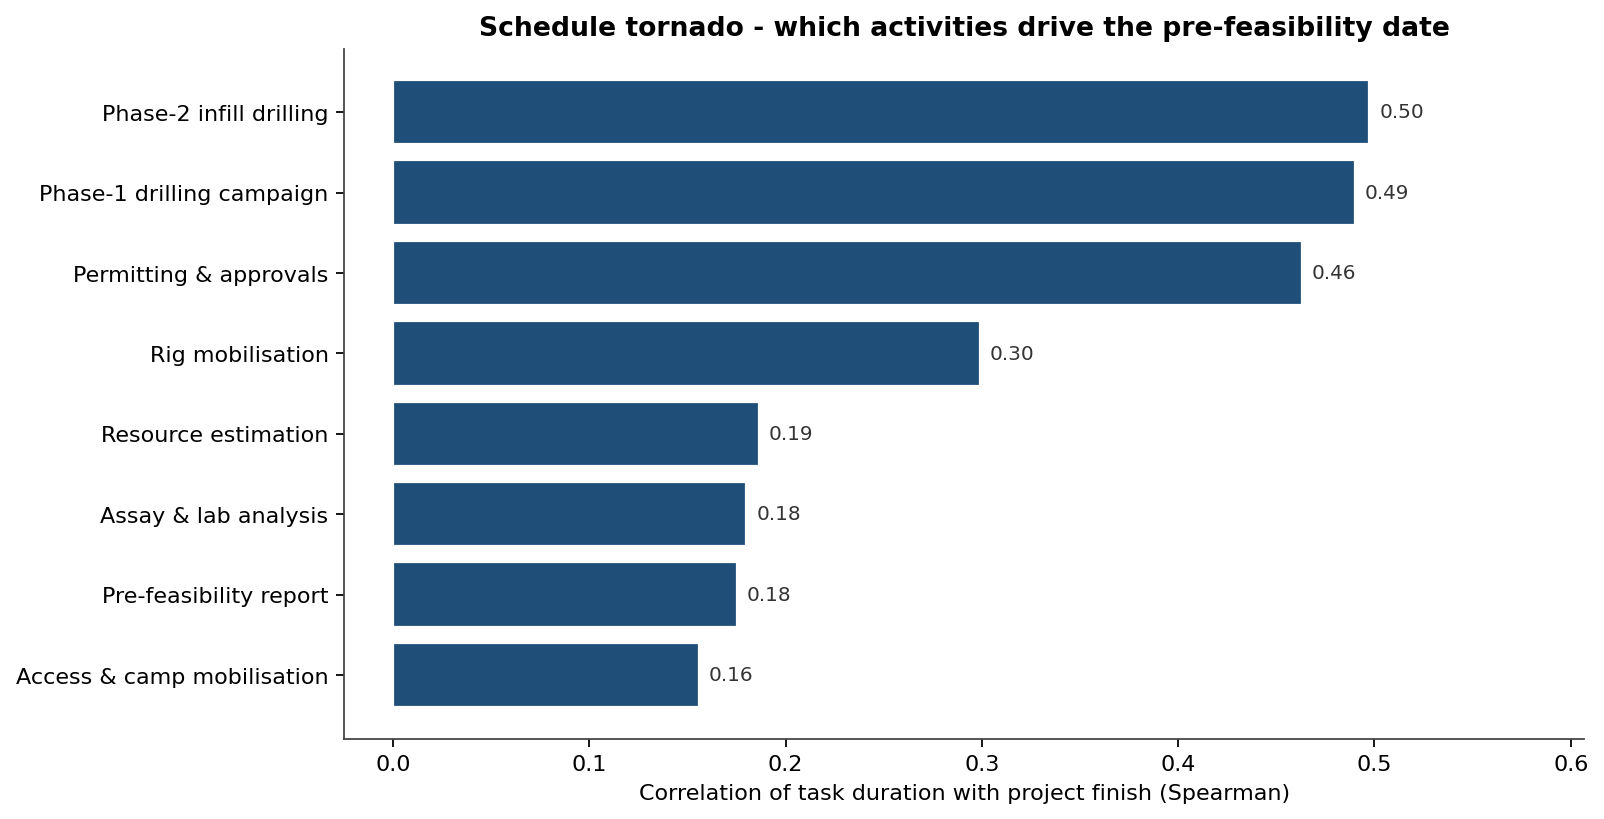
Phase-2 infill drilling tops the tornado at 0.50, with the Phase-1 drilling campaign (0.49) and permitting & approvals (0.46) close behind. The two drilling campaigns are where extra rig capacity or contractor performance moves the date most.
Cost: the price of slipping
A standing camp and rig day-rates make every slipped day expensive. The before/after histogram shows total programme cost and the effect of mitigation.
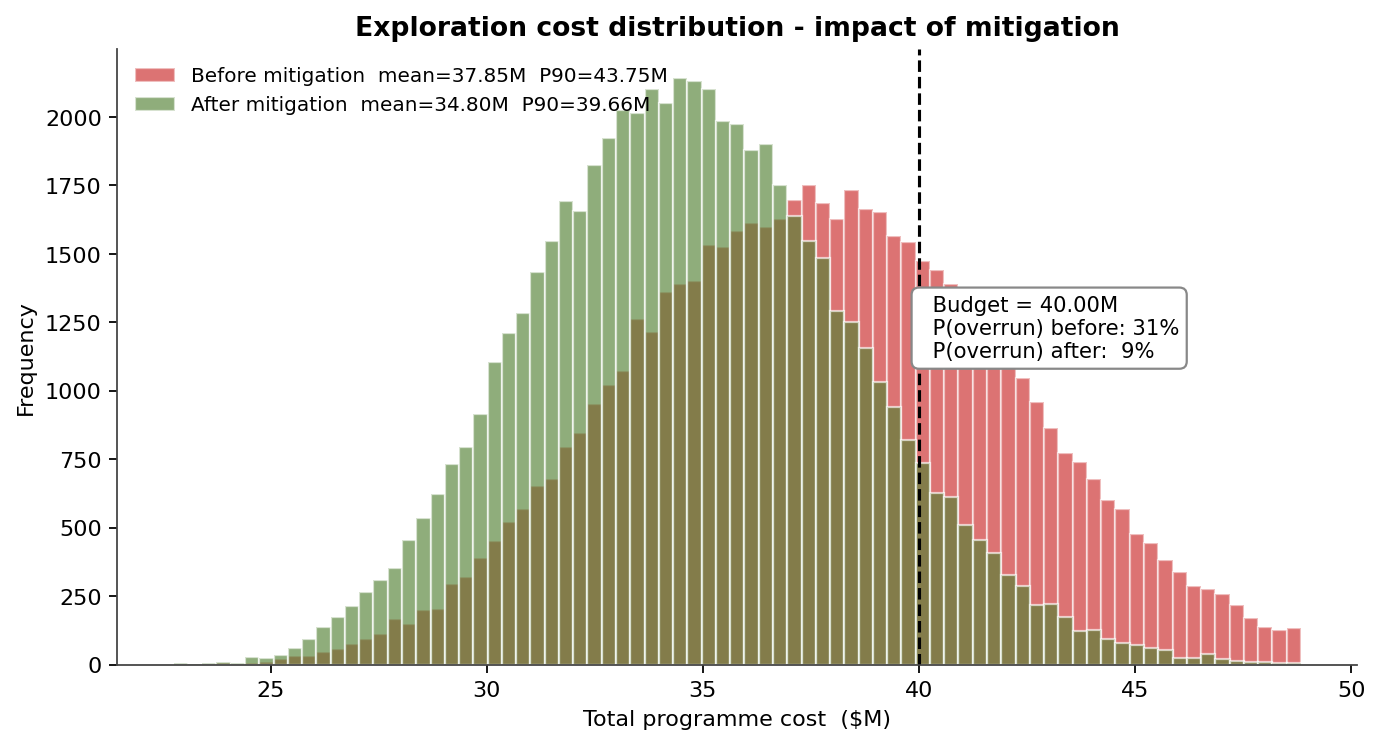
Before mitigation the cost averages $37.8M with a P90 of $43.7M, and 31% of runs breach the $40M budget. Mitigation -- extra drilling rigs, contractor training, equipment pre-positioning and cost hedging -- pulls the mean to $34.8M, the P90 to $39.7M, and the probability of breaching budget from 31% down to 9%. The gap between the curves is the value of de-risking the drilling campaigns, quantified.
What the discrete exploration risks add
Six discrete risks can each fire on top of activity-duration uncertainty. The Pareto ranks them by expected schedule impact -- probability times mean delay.
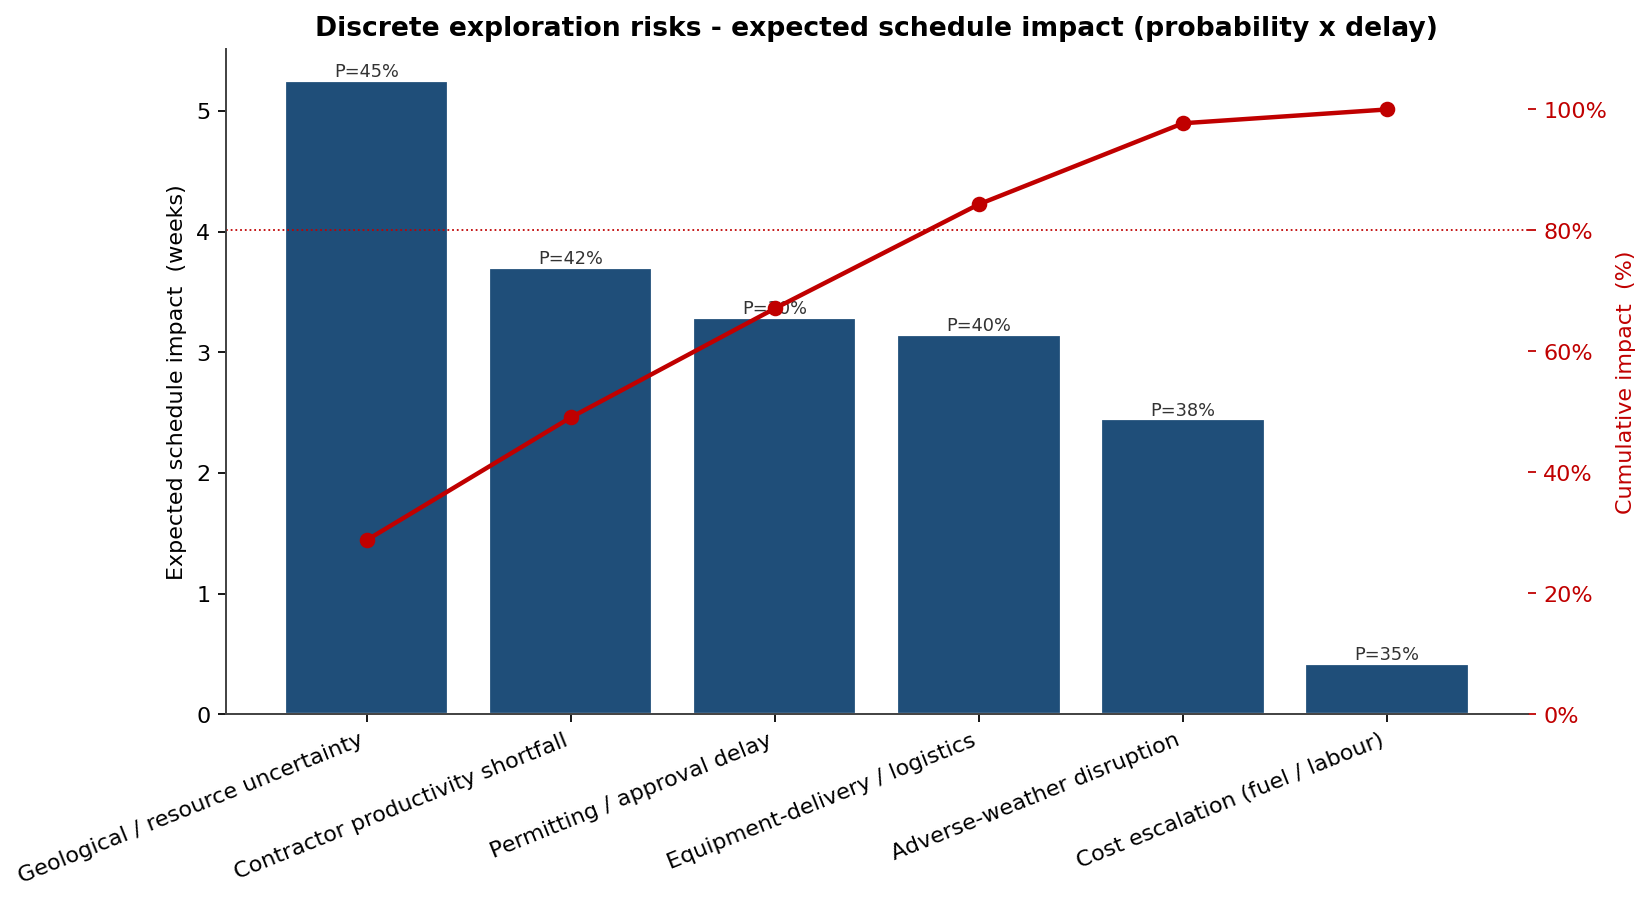
The top four of six risks carry roughly 80% of the expected discrete-risk delay. Geological / resource uncertainty leads at 5.2 weeks expected, followed by a contractor productivity shortfall at 3.7 weeks, a permitting / approval delay at 3.3 weeks and equipment-delivery / logistics at 3.1 weeks. Cost escalation barely touches the schedule (0.4 weeks) -- its damage shows up in the cost chart, not the timeline.
From chart to decision
Tamara turns a staged exploration programme into a quantified funding case. The contingency ladder sizes the reserve at each confidence level; the histogram shows the full forecast; the tornado names Phase-2 drilling as the dominant driver; the Pareto ranks the discrete threats; and the cost chart prices the mitigation. Together they convert an optimistic 815-day plan into the schedule-and-cost reserves a board needs to release the next tranche.