

Equipment failure probabilities
An open-pit production-capacity expansion lives and dies by its heavy mobile fleet. Eleven activities -- pre-strip, haul-road build, crusher install, conveyor setup, excavator and haul-truck commissioning, ore-hauling and crushing ramps, tailings management and capacity verification -- depend on equipment that breaks down. Six discrete equipment-failure risks (haul-truck downtime, crusher failure, excavator hydraulics, conveyor fatigue, spare-parts shortfalls and contractor-equipment reliability) can each stall the schedule. Tamara runs the whole network as one 60,000-iteration Monte-Carlo, so every chart below is driven by the same model.
When equipment reliability is the dominant uncertainty, the first question a maintenance-planning sponsor asks is direct: which failure modes actually cost the most schedule? That is a ranking problem, so the analysis leads with it.
The failure modes that cost the most schedule
The Pareto ranks the six discrete failure modes by expected schedule impact -- probability times mean delay -- with the cumulative line showing how few dominate. It is the priority list for preventive-maintenance and spares budget.
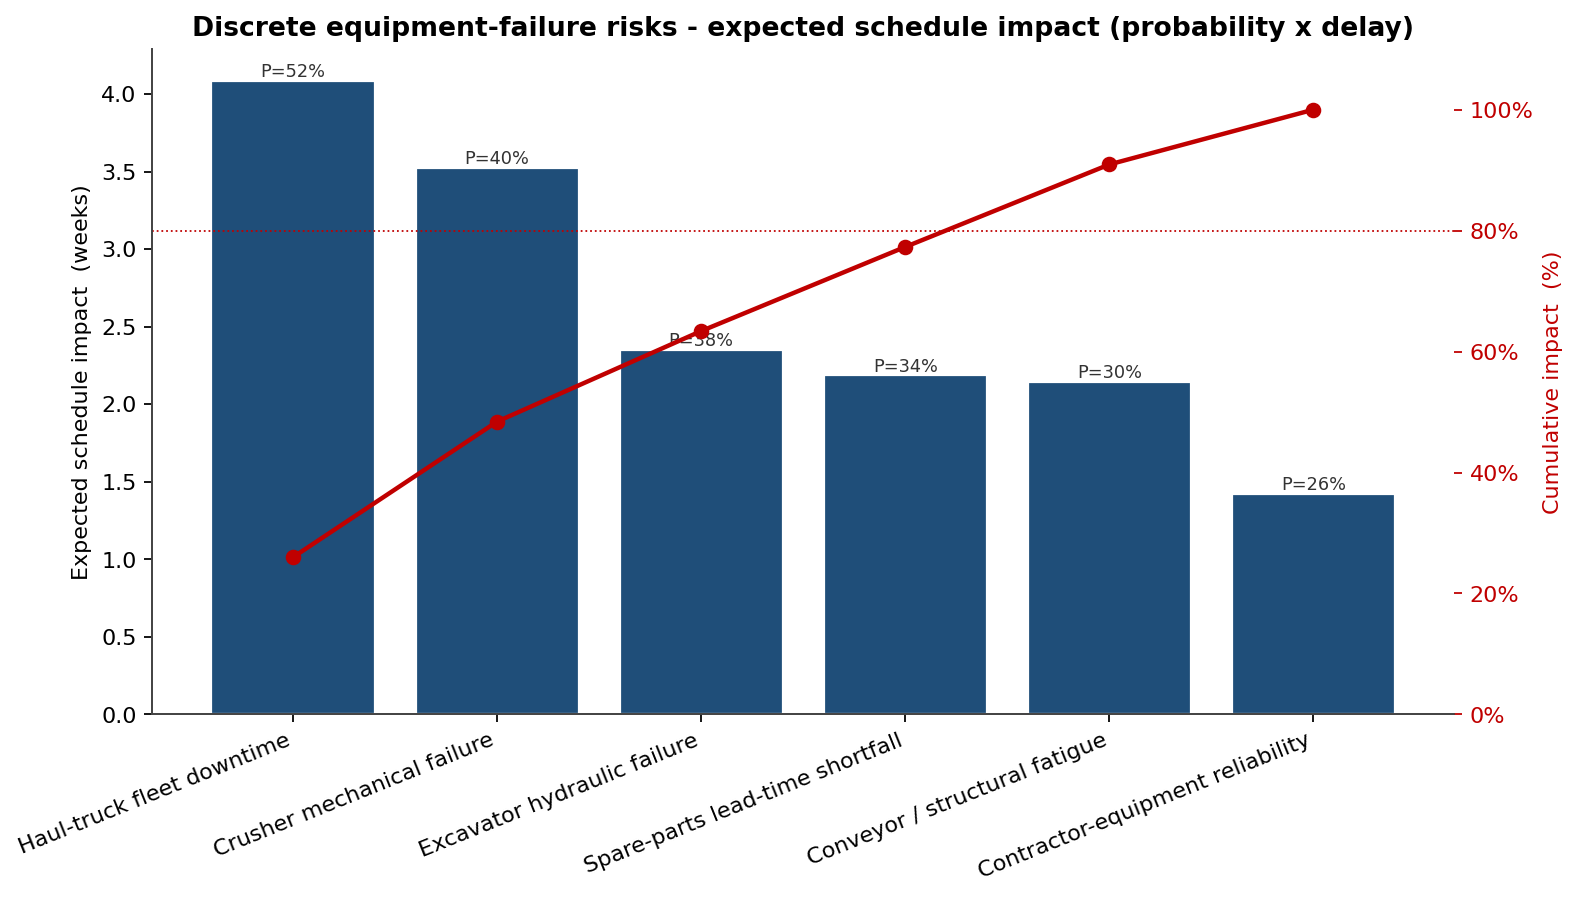
Haul-truck fleet downtime dominates at 4.1 weeks expected -- the single largest schedule threat -- followed by crusher mechanical failure at 3.5 weeks and excavator hydraulic failure at 2.4 weeks. The top five of six failure modes carry roughly 80% of the expected discrete-risk delay. Reliability spend on the haul fleet and crusher returns more schedule certainty than anything else on the list.
Which activities to de-risk first
Failure modes hit activities. This scatter places each activity by how often it lands on the critical path (horizontal) against how strongly its duration correlates with the capacity-online date (vertical). The top-right corner is where failures do the most damage.
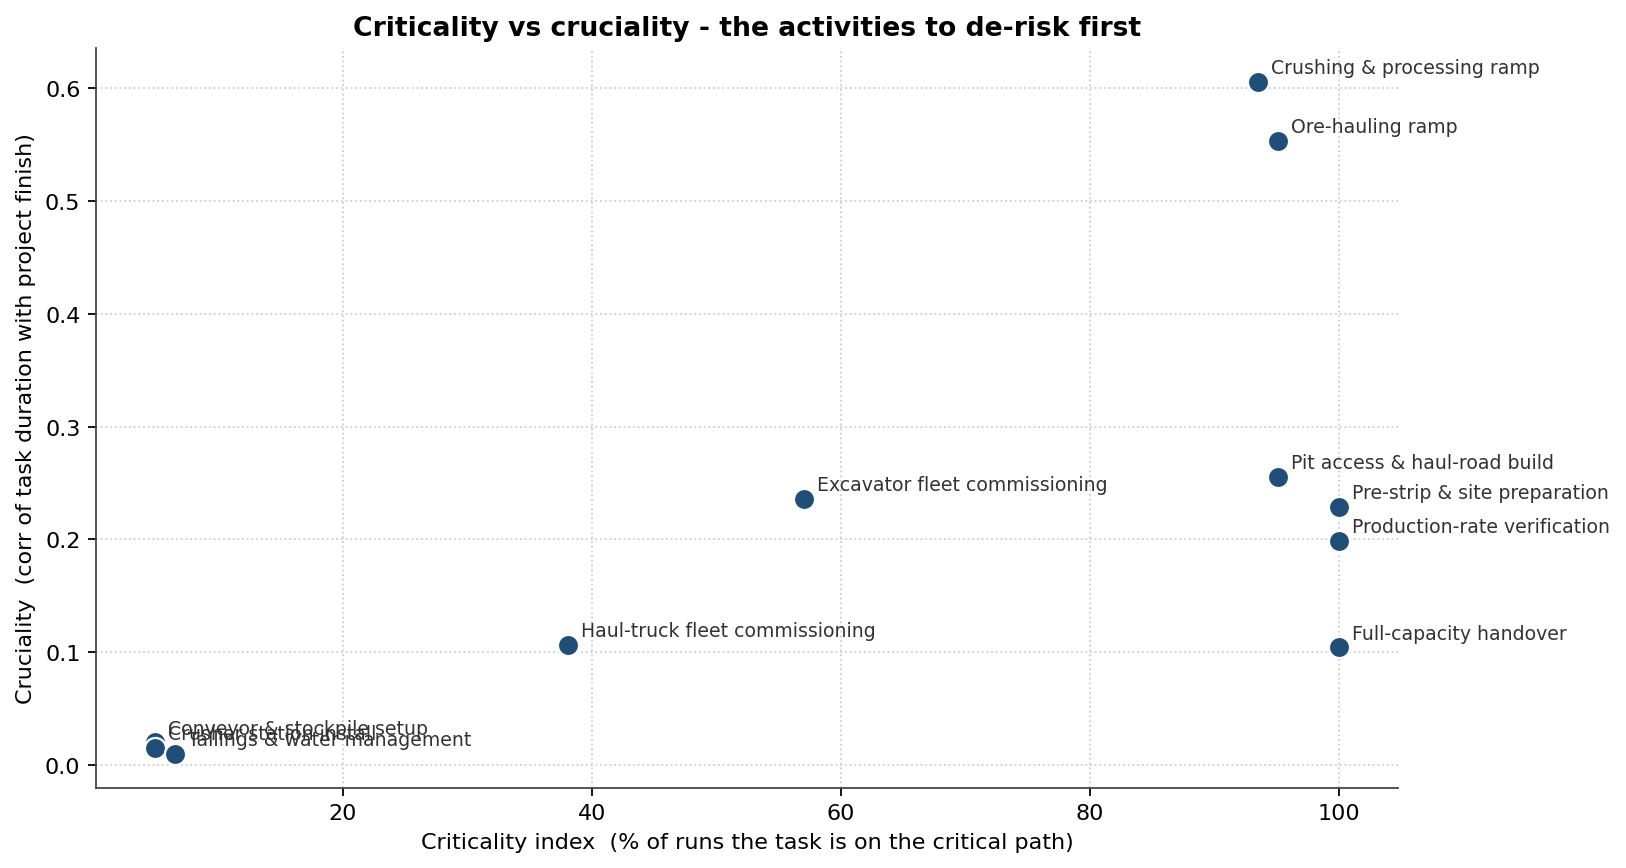
The crushing & processing ramp sits furthest top-right -- cruciality 0.61 at 94% critical -- with the ore-hauling ramp (95% critical, 0.55) and pit access & haul-road build (95% critical, 0.26) following. The crushing-and-hauling chain is where equipment reliability translates most directly into the capacity-online date.
The stochastic Gantt: where the spread lives
Seen as raw timing, the stochastic Gantt shows each activity's P50 finish bar with a P10-P90 whisker. The widest whiskers mark the activities whose timing is least certain.
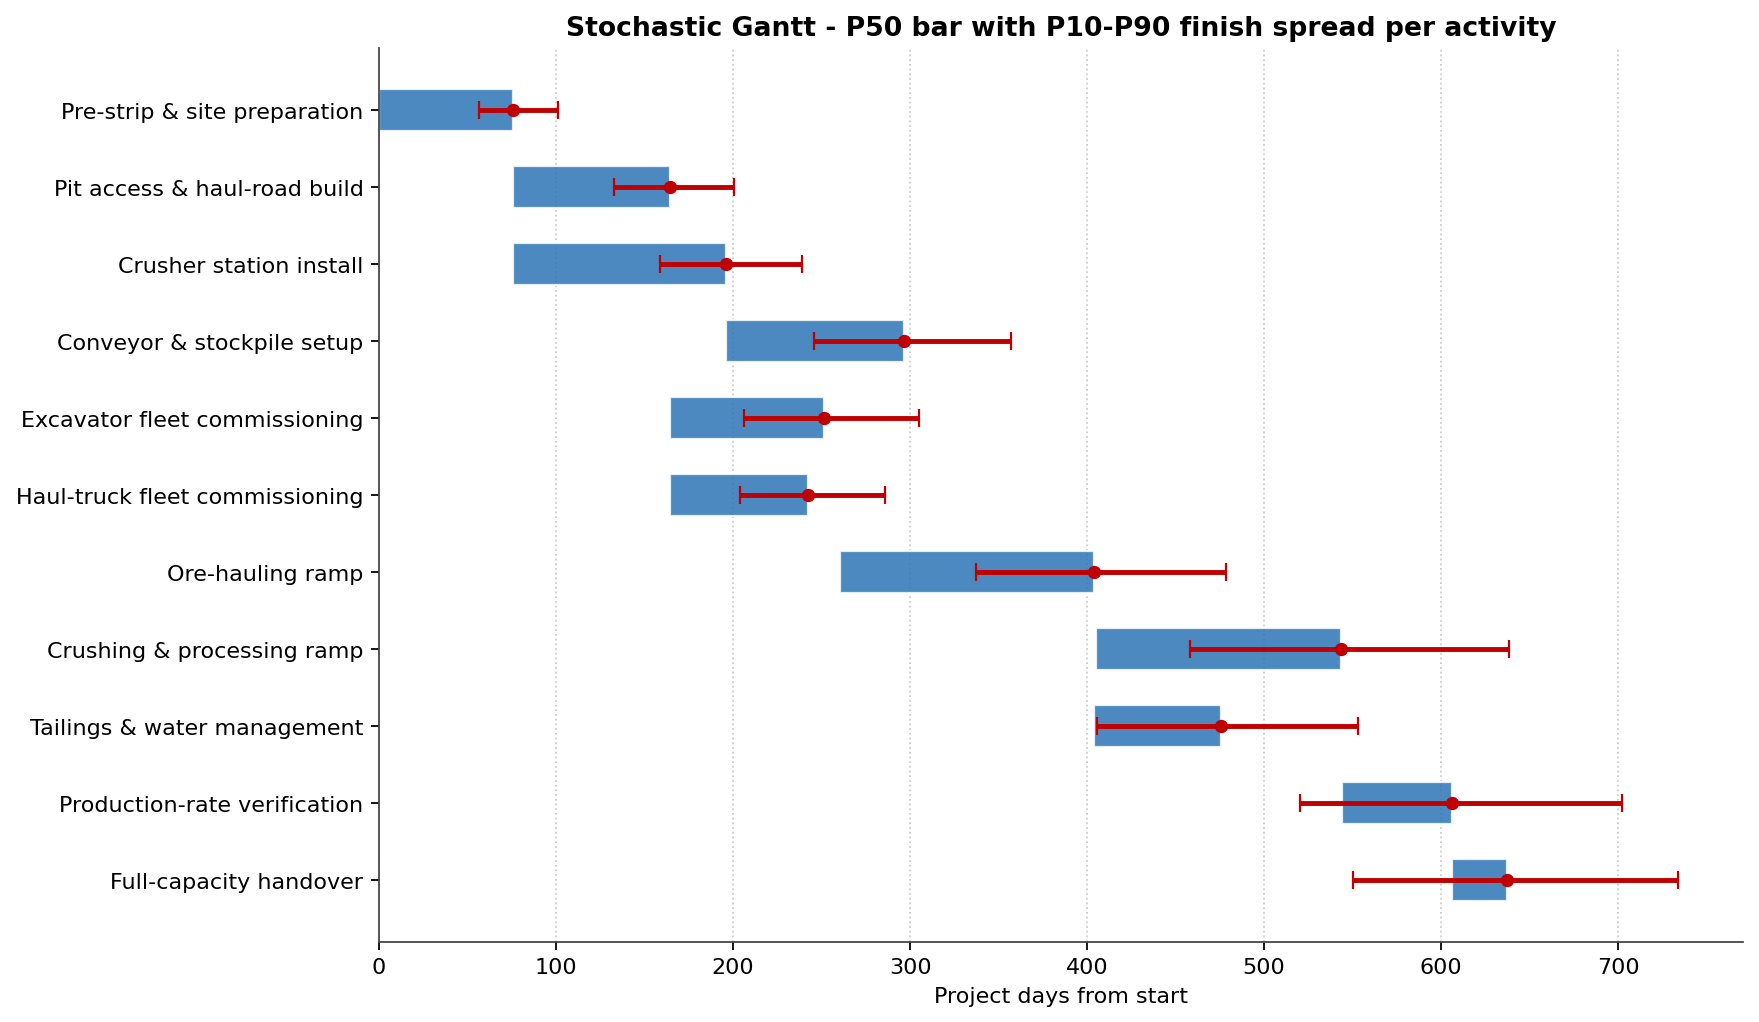
The hauling-chain and crushing-ramp activities carry the widest whiskers -- the same legs that top the scatter, now seen as the timing spread that equipment failures inject.
Cost and schedule slip together - 25% of runs are late AND over budget
Deferred production and a standing fleet make every slipped day expensive, so cost and schedule are coupled. The chart plots every run as a point -- capacity-online finish on the horizontal axis, total cost on the vertical -- with the 488-day plan and the $52M budget splitting it into quadrants.
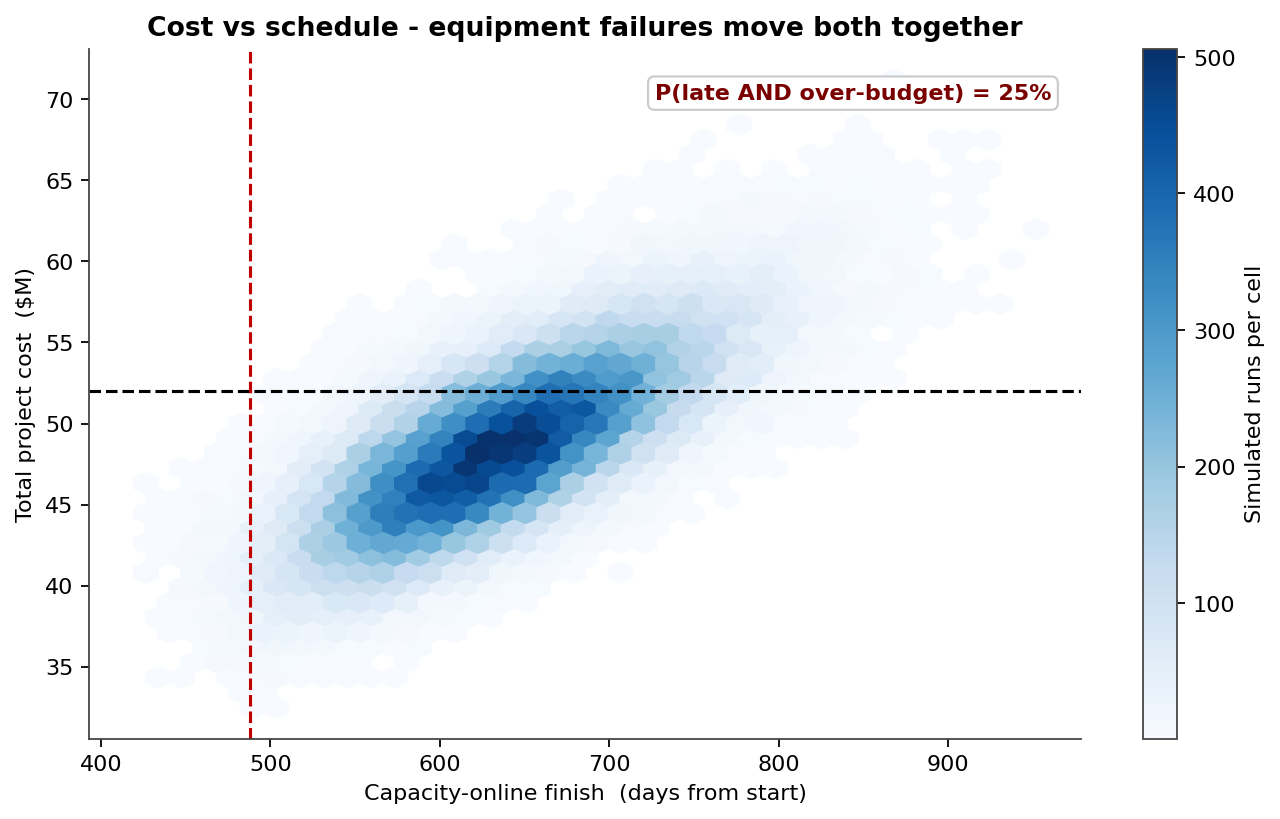
The cloud runs up and to the right: late expansions are expensive expansions. In 25% of runs the project is both late and over budget. The cost distribution averages $48.8M with a P90 of $55.1M, and 25% of runs breach the $52M budget. Because the failures drive both axes at once, preventive maintenance that compresses the schedule also pulls cost back inside the line.
How much contingency the schedule needs
Finally, the ladder turns the finish distribution into a reserve decision: the extra days beyond the 488-day plan required to hit each confidence level.
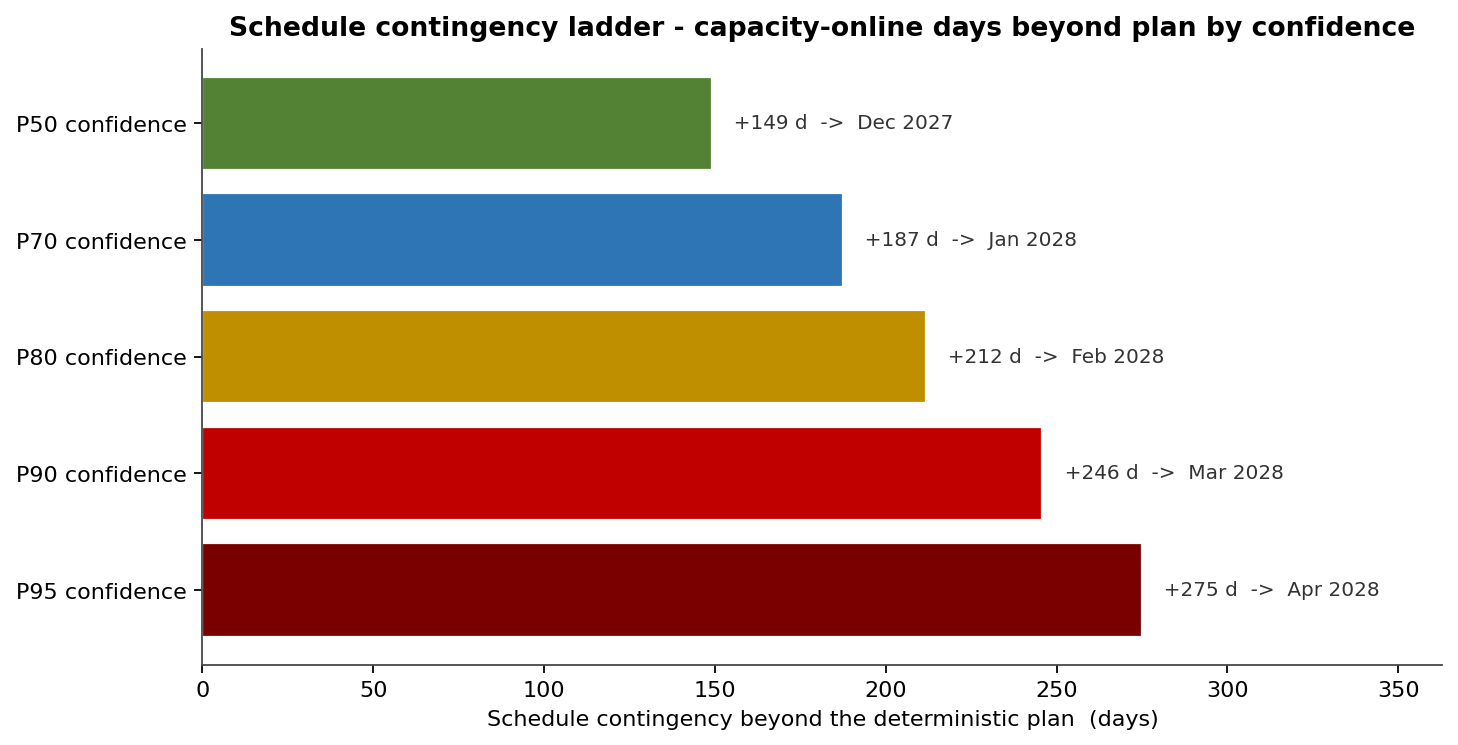
Hitting P50 takes +149 days (capacity online at 637); P90 needs +246 days (734); and P95 demands +275 days (763). The deterministic 488-day plan sits below P10 -- effectively a best case. The ladder gives maintenance planners a defensible reserve to hold against fleet reliability.
From chart to decision
Tamara reframes equipment reliability as a quantified schedule-and-cost risk. The Pareto names haul-truck downtime as the dominant failure mode; the scatter points to the crushing-and-hauling chain as the activities to protect; the Gantt and ladder size the spread and the reserve; and the joint chart shows that 25% of runs miss on both date and budget together. Together they convert "equipment might break" into a costed maintenance and contingency plan.