

Quality control uncertainties
A first-article qualification and quality-system build-out programme for a critical aerospace component runs through eleven activities -- material procurement, inspection, precision machining, testing, assembly, finishing, metrology, a rework loop, qualification testing and PPAP approval -- before the part can be released to production. Six discrete quality risks (defect-rate batches, inspection backlogs, out-of-tolerance machining, nonconformance, test failures and documentation rejections) can each inject delay and cost. Tamara runs the whole network as one 60,000-iteration Monte-Carlo, so every chart below is driven by the same model.
The trap in a qualification programme is treating schedule and budget as separate problems. They are not: the same quality slips that push the finish date out are the ones that burn the budget. The question is how tightly the two move together.
Cost and schedule slip together - 20% of runs are late AND over budget
The chart below plots every simulated run as a point: qualification finish day on the horizontal axis, total programme cost on the vertical. The dashed lines mark the 453-day deterministic plan and the $21.0M budget, splitting the cloud into quadrants.
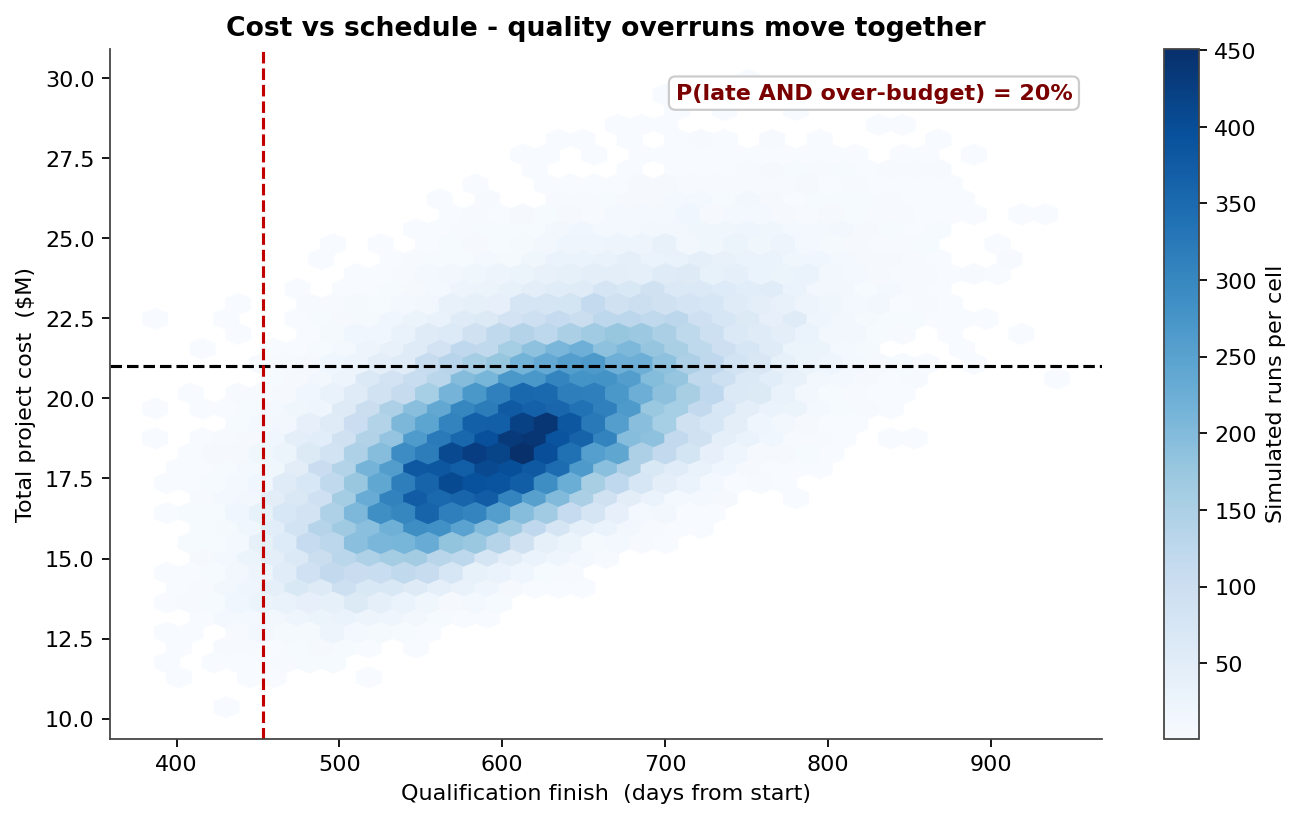
The density runs up and to the right -- late runs are also expensive runs. In 20% of all simulations the programme is both late and over budget, landing in the worst quadrant. The cost distribution averages $18.9M with a P90 of $22.2M, and 20% of runs breach the $21.0M budget. Because the failure modes are correlated, a single mitigation that compresses the schedule also pulls cost back inside the line.
Which activities to de-risk first
If schedule and cost move together, the leverage is in the activities that drive the finish date. This scatter places each activity by how often it lands on the critical path (horizontal) against how strongly its duration correlates with the finish date (vertical). The top-right corner is where to spend de-risking effort.
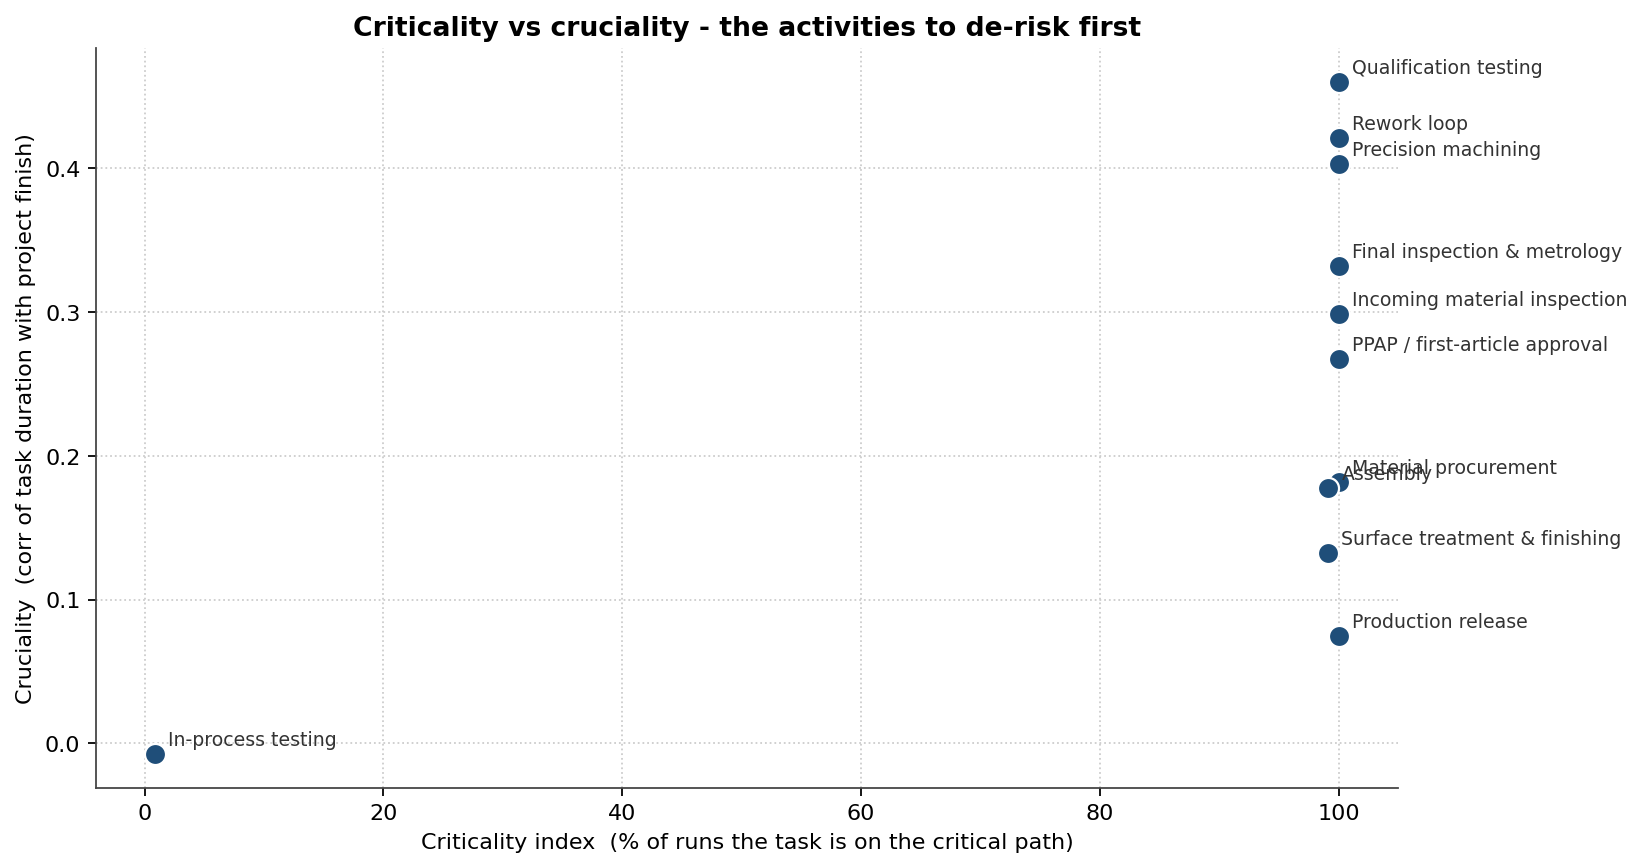
Qualification testing sits furthest top-right -- 100% critical, cruciality 0.46 -- with the rework loop (100% critical, 0.42) and precision machining (100% critical, 0.40) close behind. Final inspection & metrology (100% critical, 0.33) rounds out the cluster. These four activities are where tighter process control buys the most schedule certainty.
How much contingency the schedule needs
Knowing the finish is uncertain, the practical question is how many days of reserve to hold for a given confidence. The ladder reads straight off the simulated finish distribution: each rung is the extra time beyond the 453-day plan required to hit that confidence level.
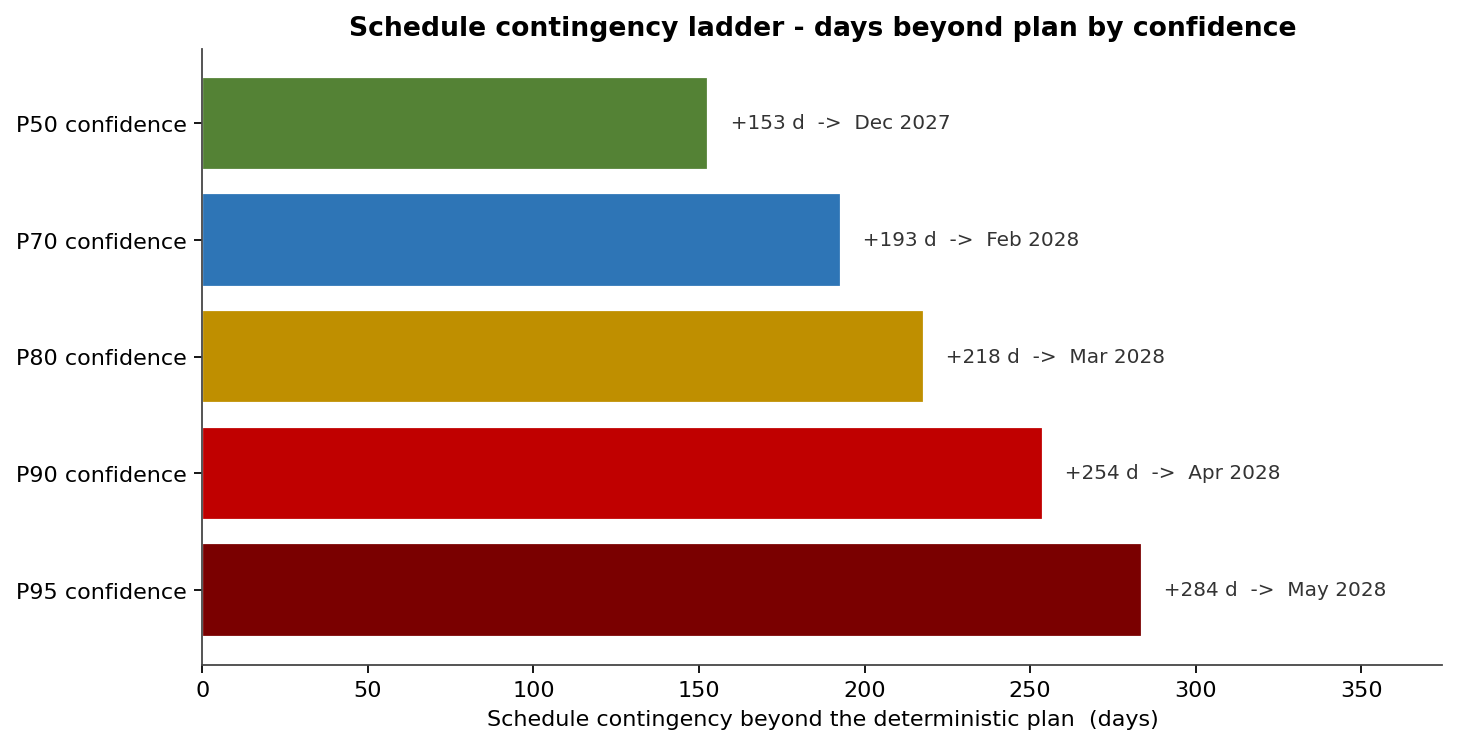
Hitting P50 takes +153 days (finish 606); P80 needs +218 days (671); and P90 demands +254 days (707), rising to +284 days at P95. A sponsor who commits to the deterministic 453-day plan is effectively committing below P10. The ladder turns "add some buffer" into a defensible reserve figure.
What the discrete quality risks add
Beyond activity-duration uncertainty, six discrete quality risks can each fire. The Pareto ranks them by expected schedule impact -- probability times mean delay -- with the cumulative line showing how a few dominate.
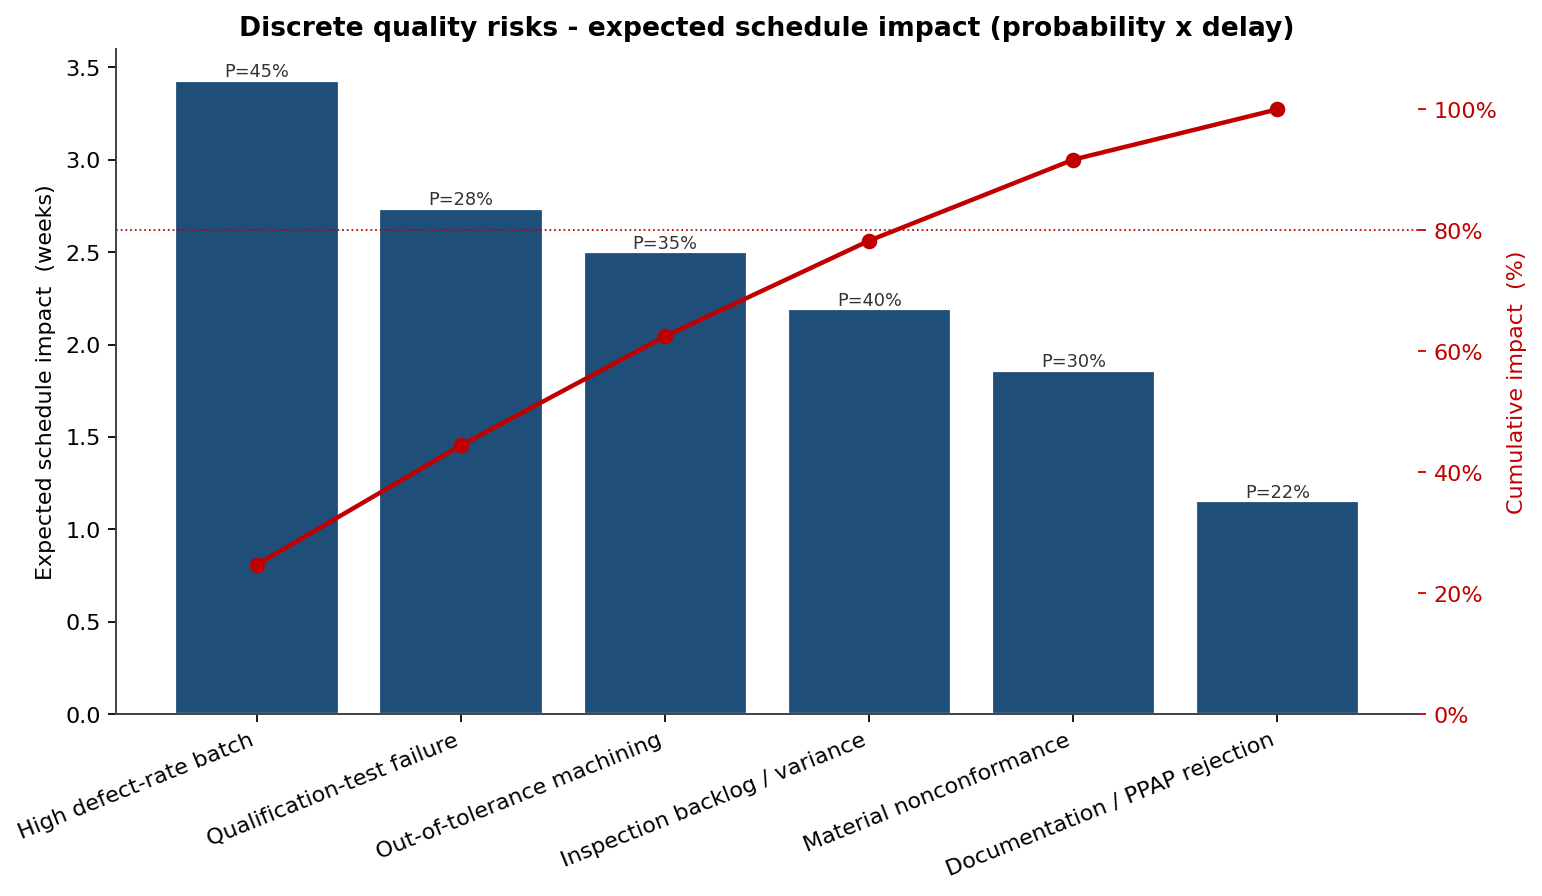
The top five of six risks carry roughly 80% of the expected discrete-risk delay. A high defect-rate batch leads at 3.4 weeks expected, followed by a qualification-test failure at 2.7 weeks and out-of-tolerance machining at 2.5 weeks. That ranking is the priority list for tightening process controls and inspection capacity.
The finish date as a distribution
Pulling the schedule view back together, the histogram shows the full spread of simulated qualification dates -- the same forecast the contingency ladder summarises, seen as a shape.
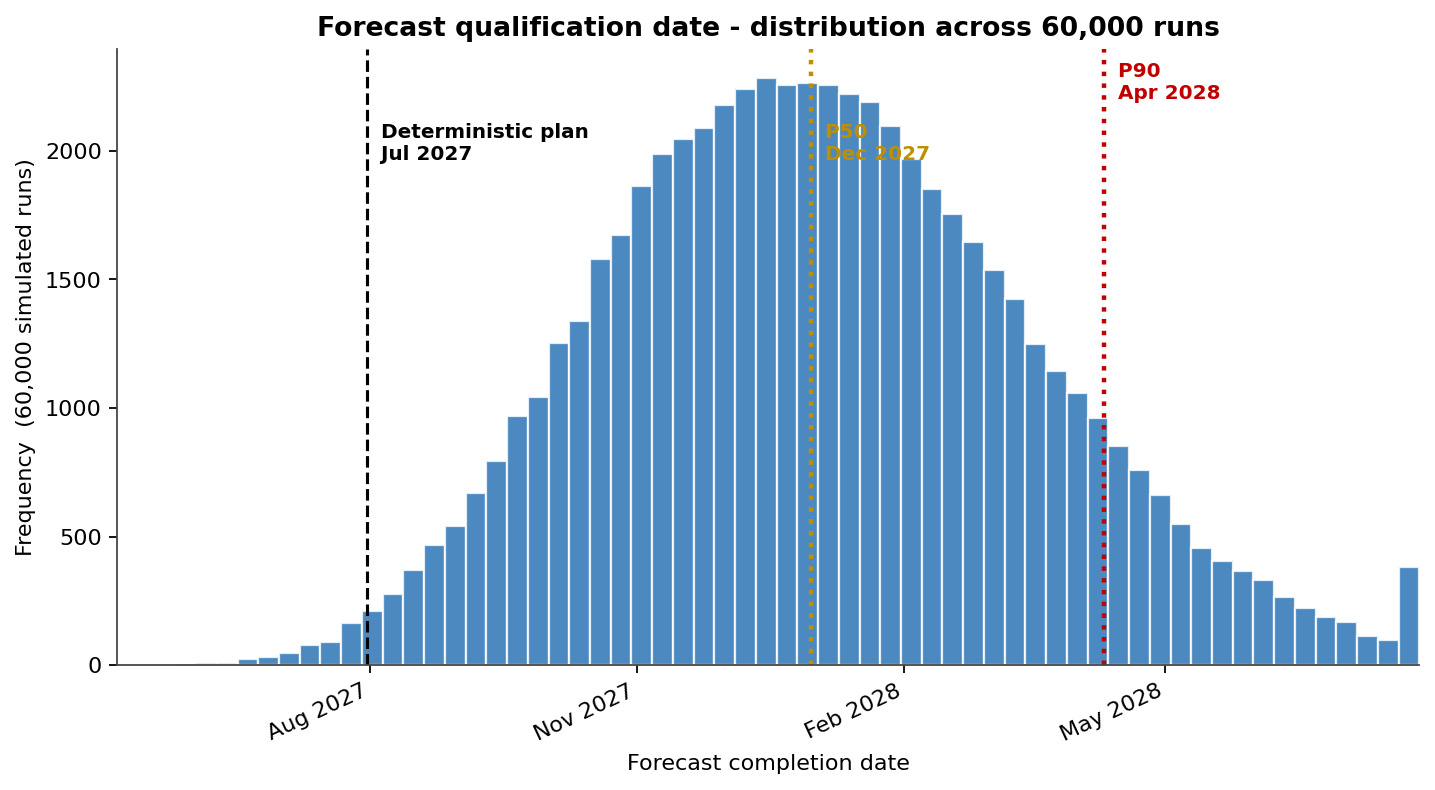
The bulk sits well past the 453-day plan, centred on the P50 of 606 days with a P90 of 707, and only 1% of runs finish by the deterministic plan. The long right tail is the qualification slippage that, left unmanaged, is also the budget overrun in the first chart.
From chart to decision
Tamara reframes quality-control uncertainty as a single coupled schedule-and-cost risk. The joint chart proves the two slip together; the scatter says which activities to de-risk; the contingency ladder sizes the reserve; the Pareto ranks the discrete threats; and the histogram shows the full forecast. Together they turn a tidy 453-day plan into a quantified, defensible qualification commitment.