

Industry: Energy
Product: Tamara
Application: Grid stability analysis
The Plan Said 770 Days. The Likely Energisation Date Lands a Full Quarter Later
A national grid operator scoped a reinforcement programme — a new 400 kV substation, transmission-line reconductoring and a synchronous-condenser / battery stability package — to absorb rising renewable penetration before a contracted winter-peak reliability deadline. The deterministic plan, an eleven-activity most-likely roll-up, put energisation at day 770. Until that date the grid would keep running on a constrained stability margin, paying congestion-management and constraint costs every settlement period. The first question a system operator needs answered is not a single date but the full picture of when energisation is actually likely to fall.
Rebuilt in Tamara, Vose Software's Monte Carlo project risk tool, with Beta-PERT durations on every activity and six discrete risk events layered on top, the deterministic date becomes a distribution. The histogram of the simulated energisation date is the headline:
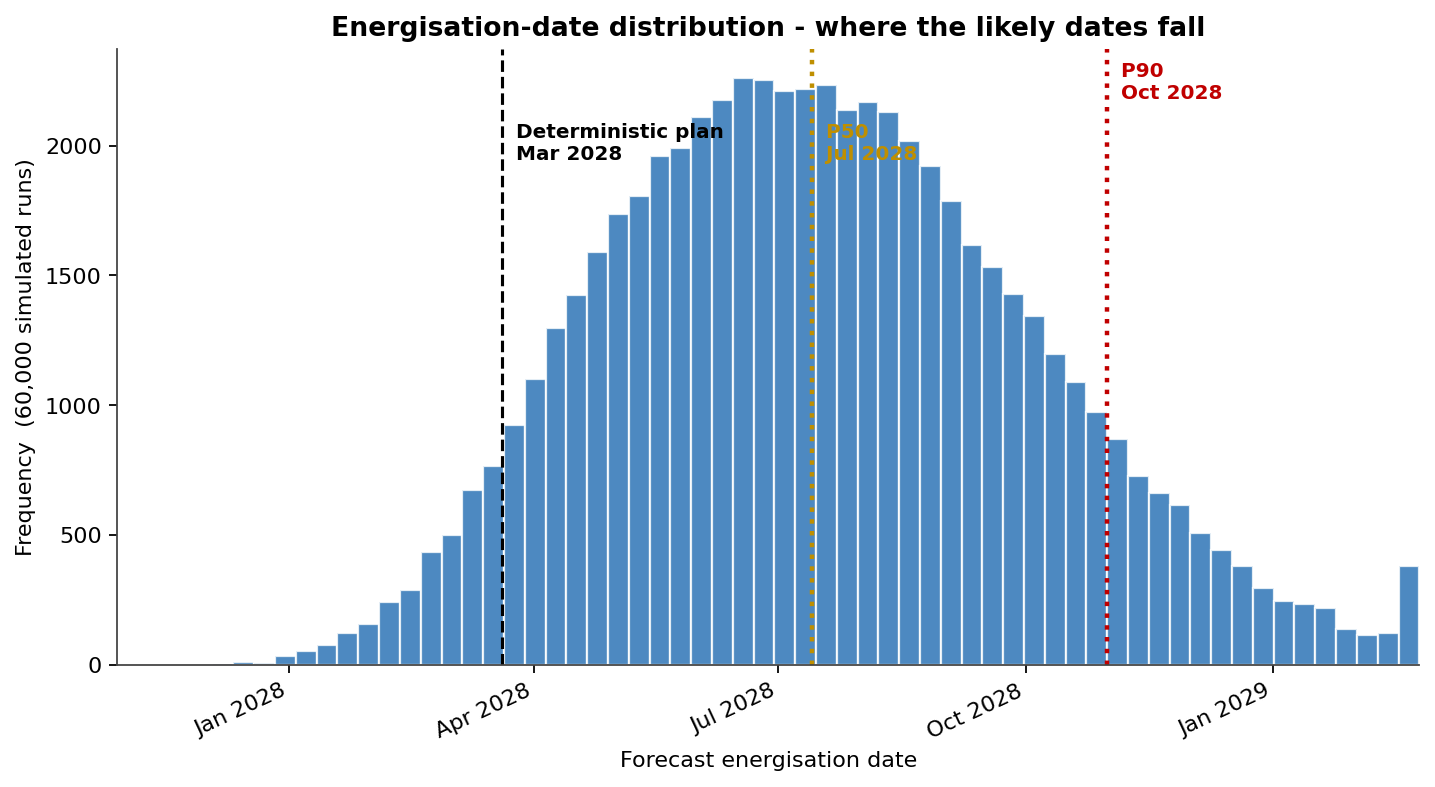
The mass of the 60,000 simulated programmes piles up well to the right of the plan: the P50 lands at day 885 and the P90 at day 995. The deterministic date is not the centre of the histogram — it sits near its left foot, with only a 6% chance of being met. A reliability deadline should never be placed where the distribution says it almost never happens.
How much contingency the deadline needs
Turning the histogram into a decision, the contingency ladder reads off how many days of buffer beyond the deterministic plan each confidence level requires:
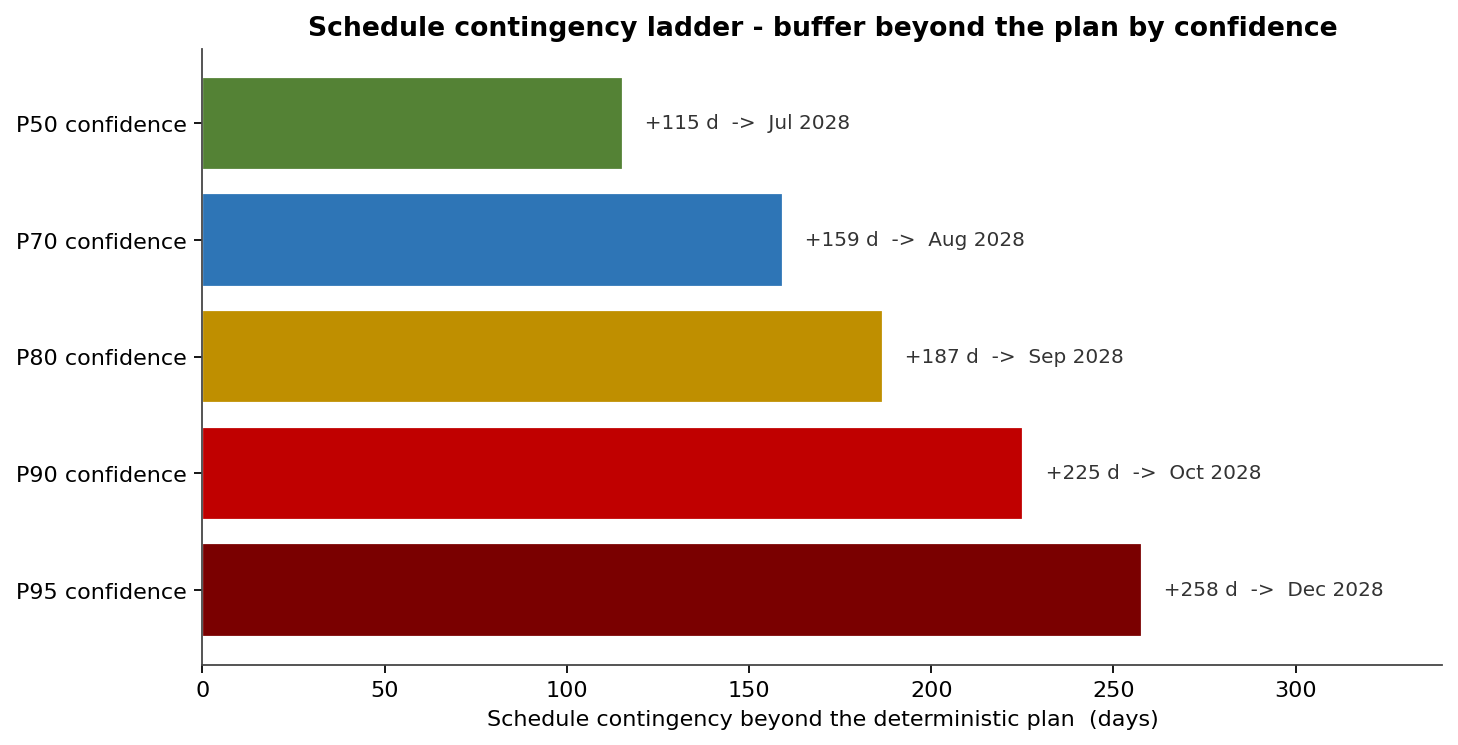
| Confidence | Buffer beyond plan | Energisation day |
|---|---|---|
| P50 | +115 days | 885 |
| P70 | +159 days | 929 |
| P80 | +187 days | 957 |
| P90 | +225 days | 995 |
| P95 | +258 days | 1028 |
Committing to the winter-peak deadline at 80% confidence means carrying 187 days (about 6.1 months) of schedule contingency over the headline plan — the difference between a plan and a commitment the operator can actually rely on.
Which activities to de-risk
Tamara reports each activity's criticality index (how often it lands on the critical path) and its cruciality (how strongly its duration moves the energisation date), and plots one against the other. The top-right corner is where management attention pays off:
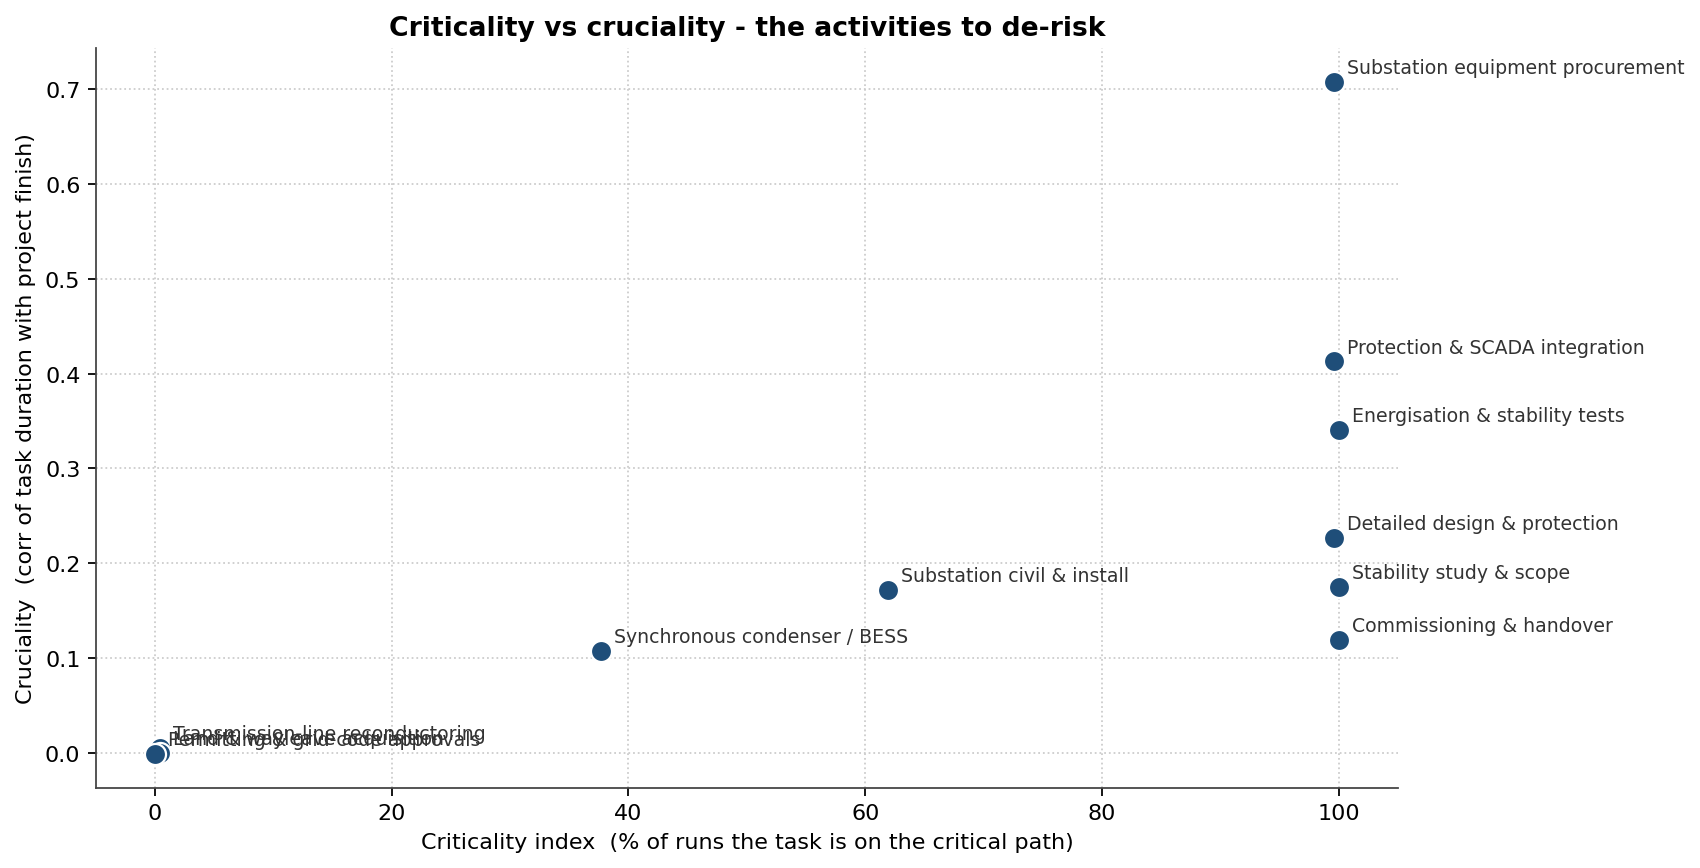
Substation equipment procurement dominates outright (cruciality 0.71) — the single most powerful lever in the programme — followed by protection and SCADA integration (0.41) and energisation and stability tests (0.34). A day of certainty bought on the long-lead transformer and switchgear order moves the energisation date more than anything else the team can do, and a wayleave dispute or transformer slip lands directly on one of these already-critical activities.
What the slip costs
Every day beyond the deterministic plan carries extended programme overhead plus the congestion-management and constraint payments the grid keeps incurring while the reinforcement is late, so the schedule distribution drives the cost distribution. Tamara let the team price a mitigation package — an early long-lead transformer order, pre-agreed outage windows and advance wayleave negotiation — and compare before/after on the same axis:
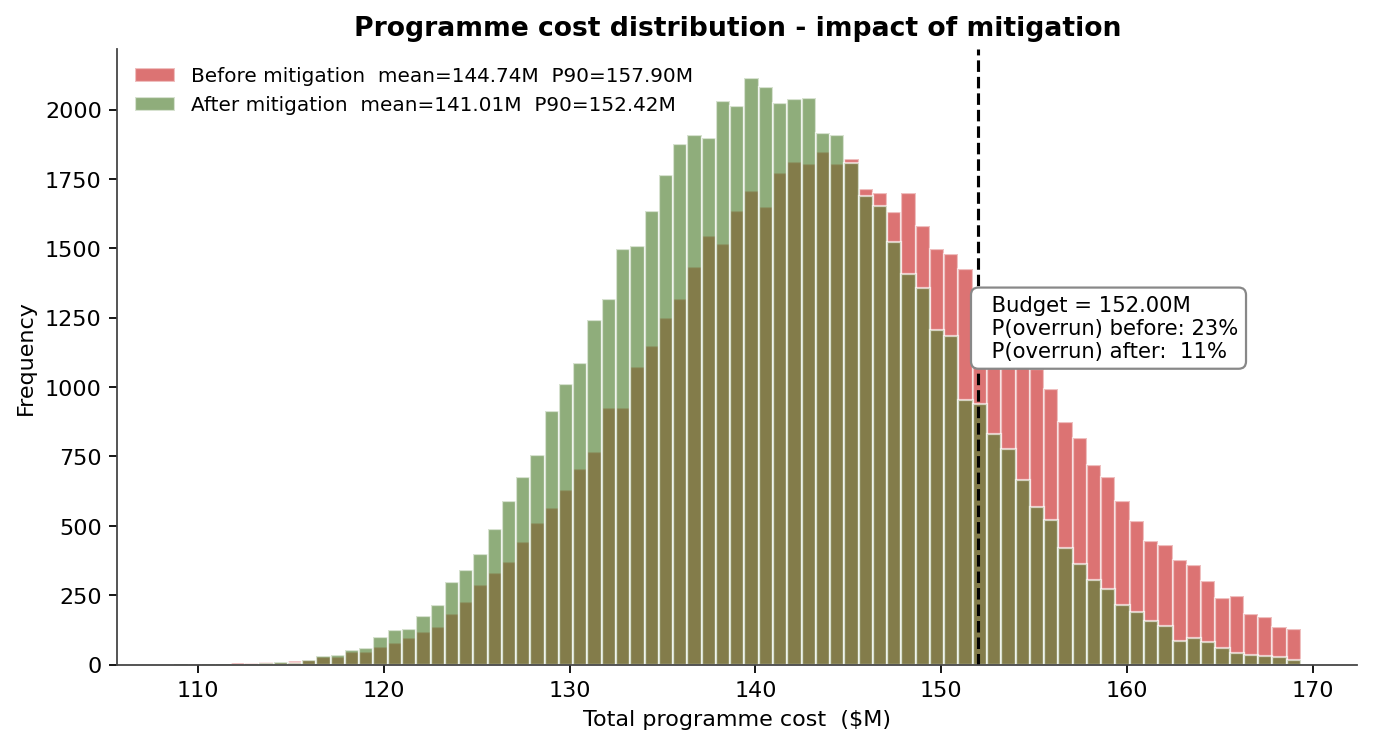
Without mitigation the all-in programme cost runs to a mean of $145M and a P90 of $158M, with a 23% probability of breaching the $152M budget. The mitigation package cuts the P80 energisation by 53 days (957 → 904 days), and because schedule drives cost, the overrun probability falls from 23% to 11% — value that lands largely in avoided constraint payments rather than in the activities the package touches directly.
The discrete risks that drive the tail
The six discrete events were modelled as Bernoulli risks. Ranking them by expected schedule impact (probability × delay) gives a clean Pareto:
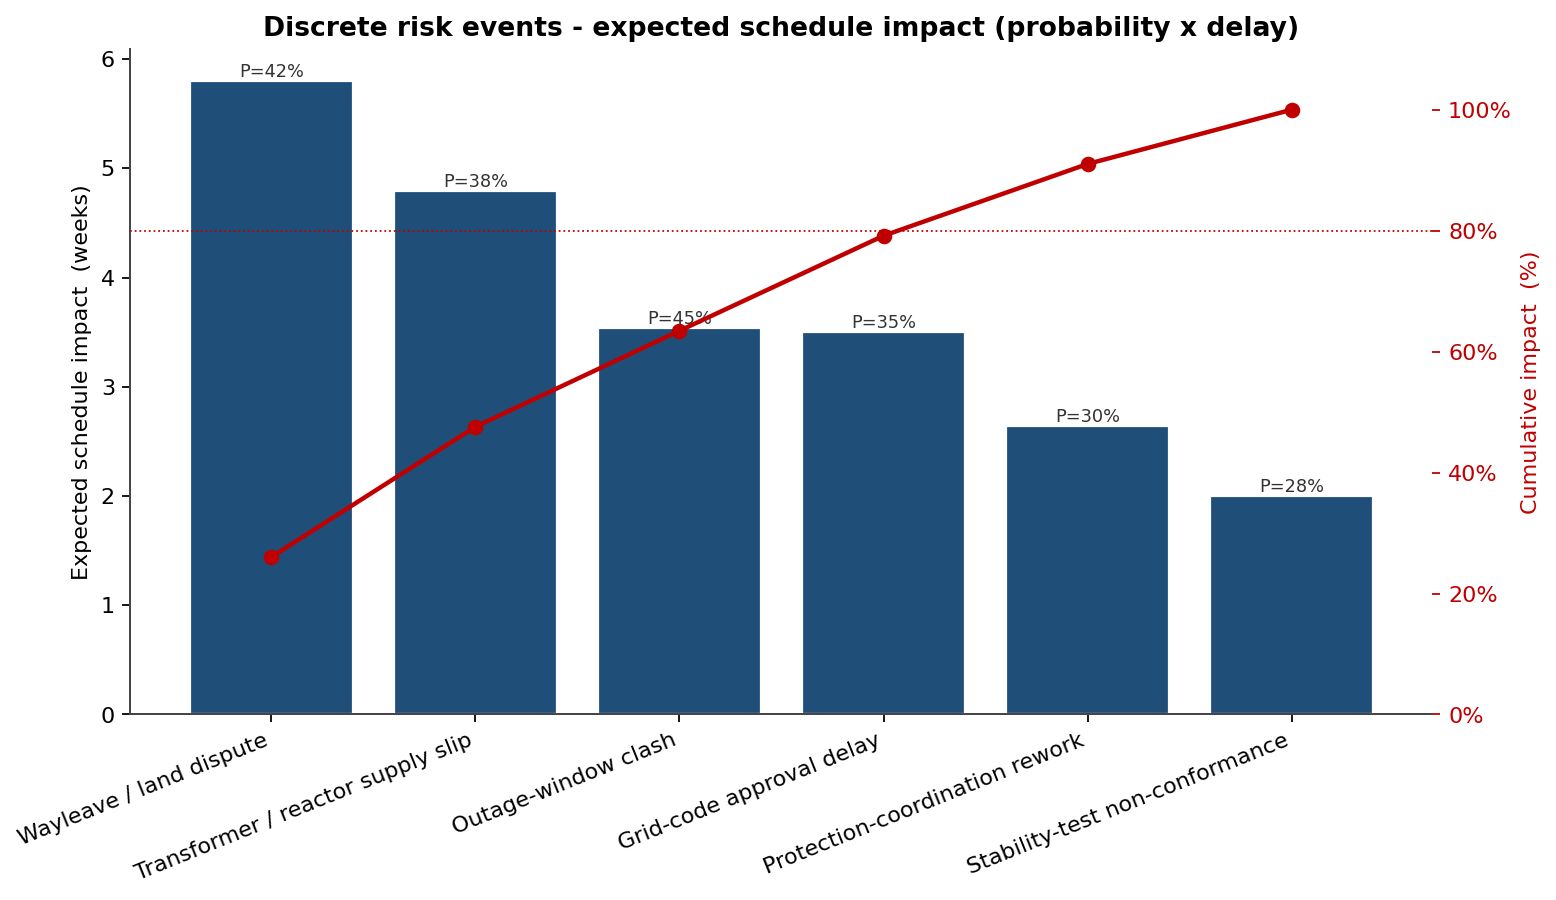
Five of the six events carry ~80% of the expected discrete-event delay — a wayleave/land dispute (5.8 weeks expected), a transformer/reactor supply slip (4.8), an outage-window clash (3.5), a grid-code approval delay (3.5) and protection-coordination rework (2.6). Once the ranking is visible, the risk-response effort can be aimed where it pays.
What Tamara changed
- The reliability commitment moved from the deterministic day-770 plan to a risk-informed P80, so the system operator could plan its winter-peak margin honestly.
- A 6.1-month schedule contingency was quantified and funded, rather than discovered through accumulating constraint costs.
- Risk-reduction effort was concentrated on substation equipment procurement — the dominant cruciality driver at 0.71 — instead of spread evenly across the bar chart.
- A mitigation package was approved on its tail-clipping effect, cutting budget-overrun probability from 23% to 11%.
Tamara Functionality Used
- Monte Carlo schedule simulation over the full activity network, with Beta-PERT durations and parallel-path logic.
- Finish-date distribution and contingency-ladder analysis quantifying the buffer each confidence level requires.
- Discrete risk-event modelling (Bernoulli occurrence × Triangular impact) layered onto task durations and costs.
- Criticality and cruciality analysis distinguishing how often a task is critical from how much its variability moves the energisation date.
- Integrated cost–schedule modelling linking energisation slip to extended overhead and constraint-payment cost.
- Scenario comparison quantifying a mitigation package's before/after impact on both the P80 energisation and the budget-overrun probability.
Grid stability is bought on a deadline, and a deadline is a distribution. Tamara is what turns "when is the margin restored?" into a probability the operator, the regulator and the market can all rely on.