

Industry: Energy
Product: Tamara
Application: Energy market price fluctuations
The Budget Was $277M. The Simulation Puts a 19% Probability on Breaching It — and Schedule Slip Is Why
A 600 MW combined-cycle gas plant was developed against a single number: a deterministic, most-likely roll-up of eleven activities and a budget of $277M. But for a price-exposed plant the budget is where the risk bites hardest. The plant's economics depended on energising into a forward power-price window the developer had modelled and partly contracted around, and every day the commercial-operation date (COD) slipped pushed first power into a softer price regime while financing carry and escalation kept accruing. Schedule slip does not stay on the schedule — it lands in the cost.
Rebuilt in Tamara, Vose Software's Monte Carlo project risk tool, with Beta-PERT durations and costs on every activity and six discrete risk events layered on top, the deterministic cost becomes a distribution. The cost chart is the headline of this case:
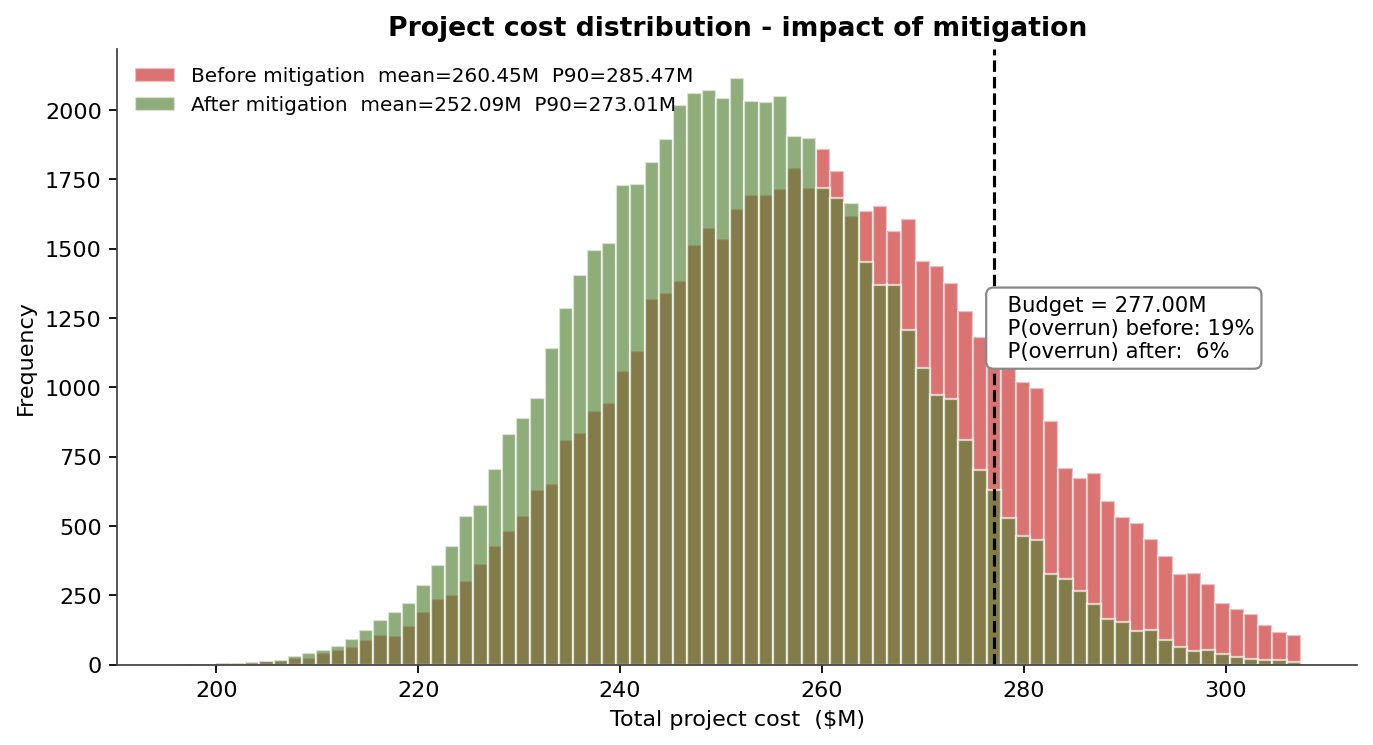
Without mitigation the all-in cost runs to a mean of $260M and a P90 of $285M, with a 19% probability of breaching the $277M budget. A mitigation package — an early reserved turbine slot, a firm interconnection agreement and a partial fuel hedge — pulls the green distribution left to a $252M mean and a $273M P90, and cuts the overrun probability to 6%. Because the same actions also compress the COD, the package pays for itself in avoided carry and price slip, not in the line items it touches directly.
Cost and schedule are one risk, not two
The cost tail is not independent of the schedule tail — it is driven by it. Tamara plots the two together, finish day against total cost, one cell per simulated build:
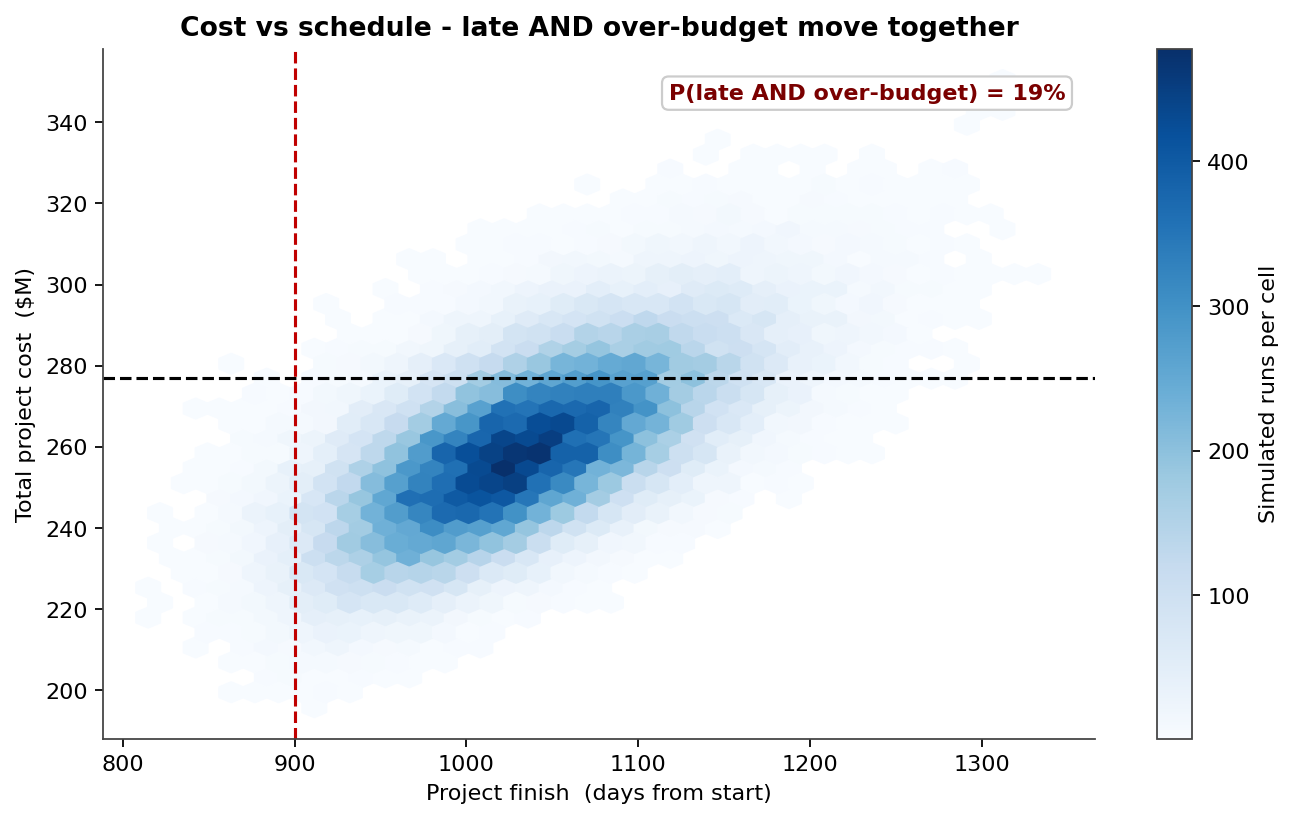
The cloud runs diagonally: late builds are the expensive ones, because every day past the deterministic plan carries financing carry, escalation and the softer-price-window penalty. 19% of runs land in the bad quadrant — both later than the deterministic COD and over budget. The deterministic COD (day 900) is the optimistic corner of this picture, with only a 1% chance of being met, and the P80 finish sits 195 days (about 6.4 months) beyond it. Modelling cost and schedule separately would miss exactly this coupling.
Where the duration risk actually lives
Tamara reports each activity's cruciality — the rank-correlation between its duration and the COD, i.e. how much its variability actually moves the date.
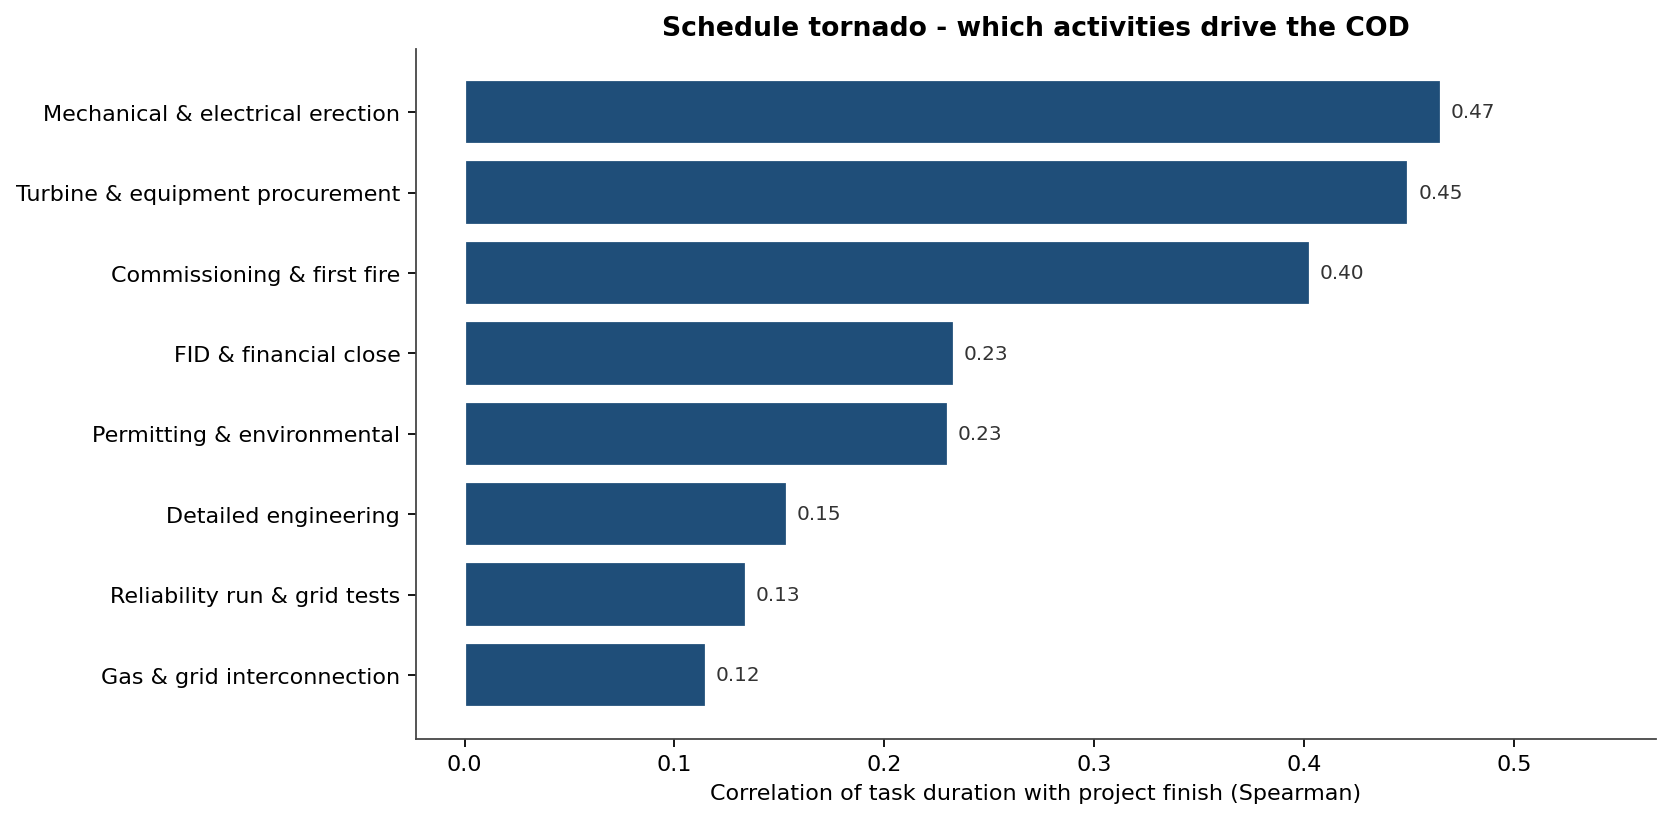
Mechanical and electrical erection dominates (cruciality 0.47), with turbine and equipment procurement close behind (0.45) and commissioning and first fire (0.40) third. This is the action list: buying duration certainty on erection and the long-lead turbine package compresses the COD distribution — and therefore the cost — far more than squeezing tasks the team merely finds convenient.
Activity-level spread
The same simulation places every activity in time as a band, not a bar:
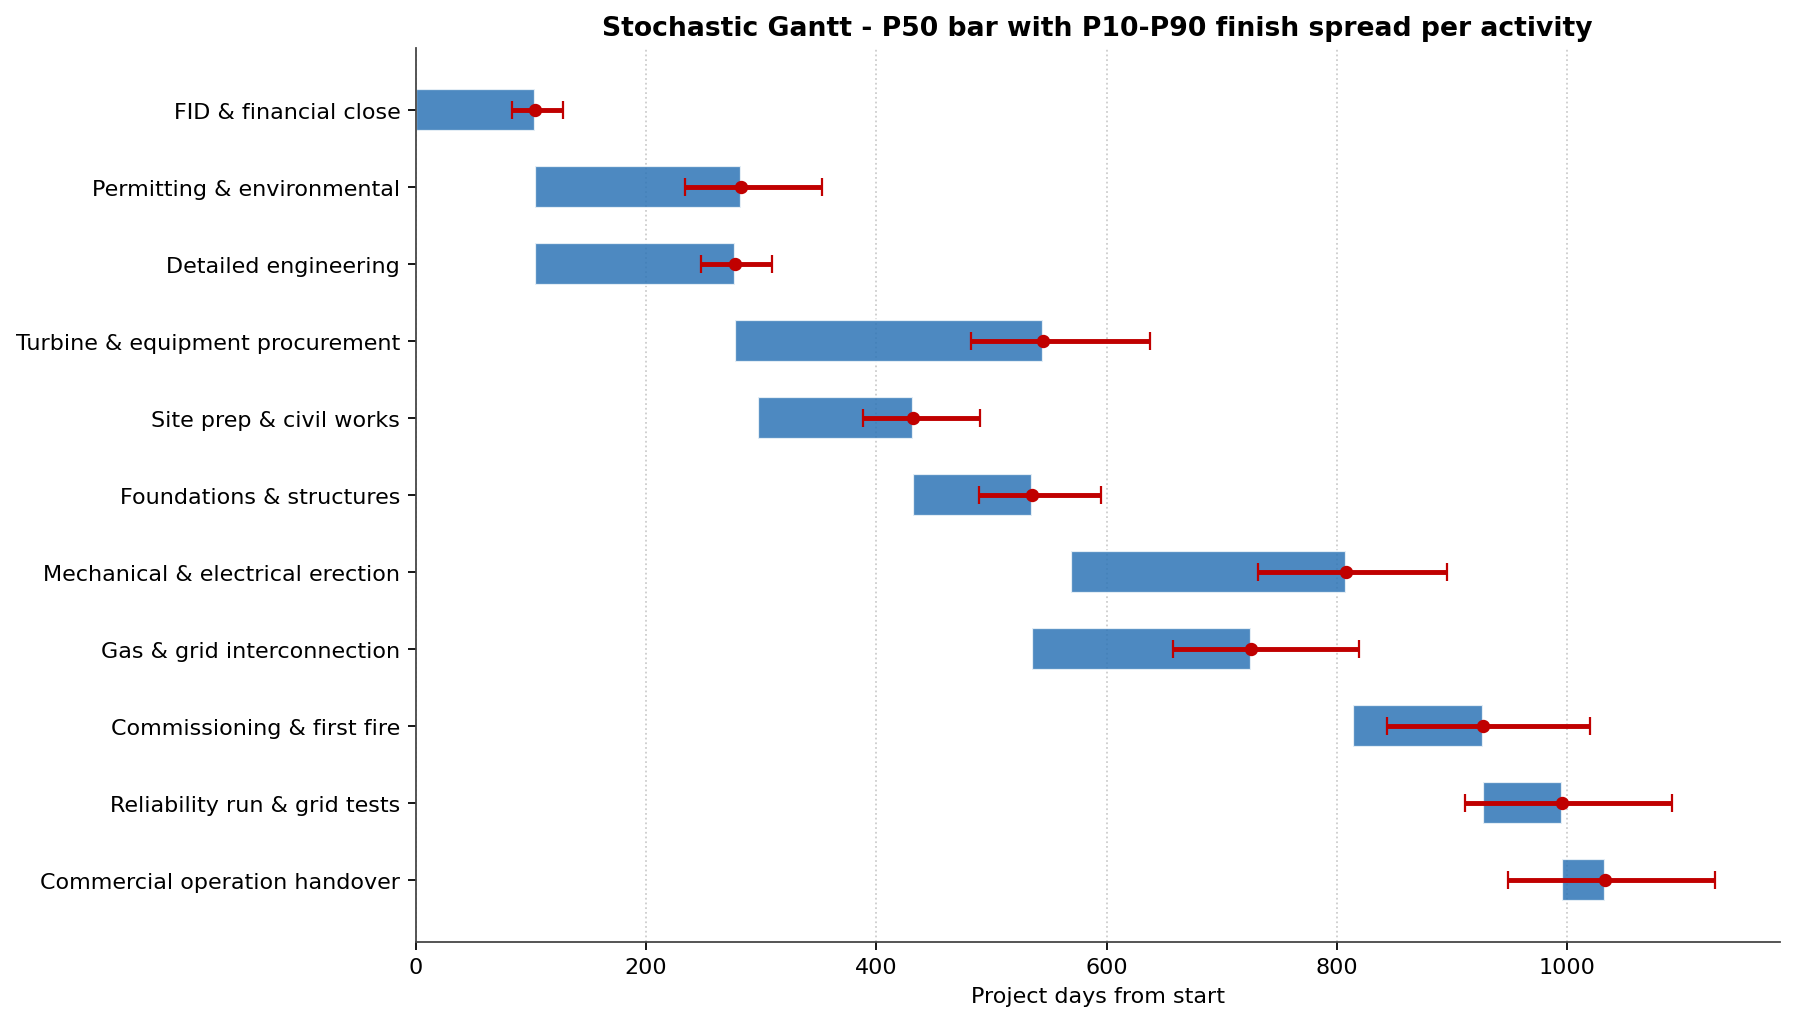
The whiskers widen downstream because uncertainty compounds along the chain: each activity inherits the spread of everything it waits on, and the procurement and erection bars carry the longest tails — the same activities the tornado flags.
The discrete risks that drive the tail
Beyond continuous duration uncertainty, six discrete events were modelled as Bernoulli risks — each may or may not occur, but if it does it adds delay and cost. Ranking them by expected schedule impact (probability × delay) gives a clean Pareto:
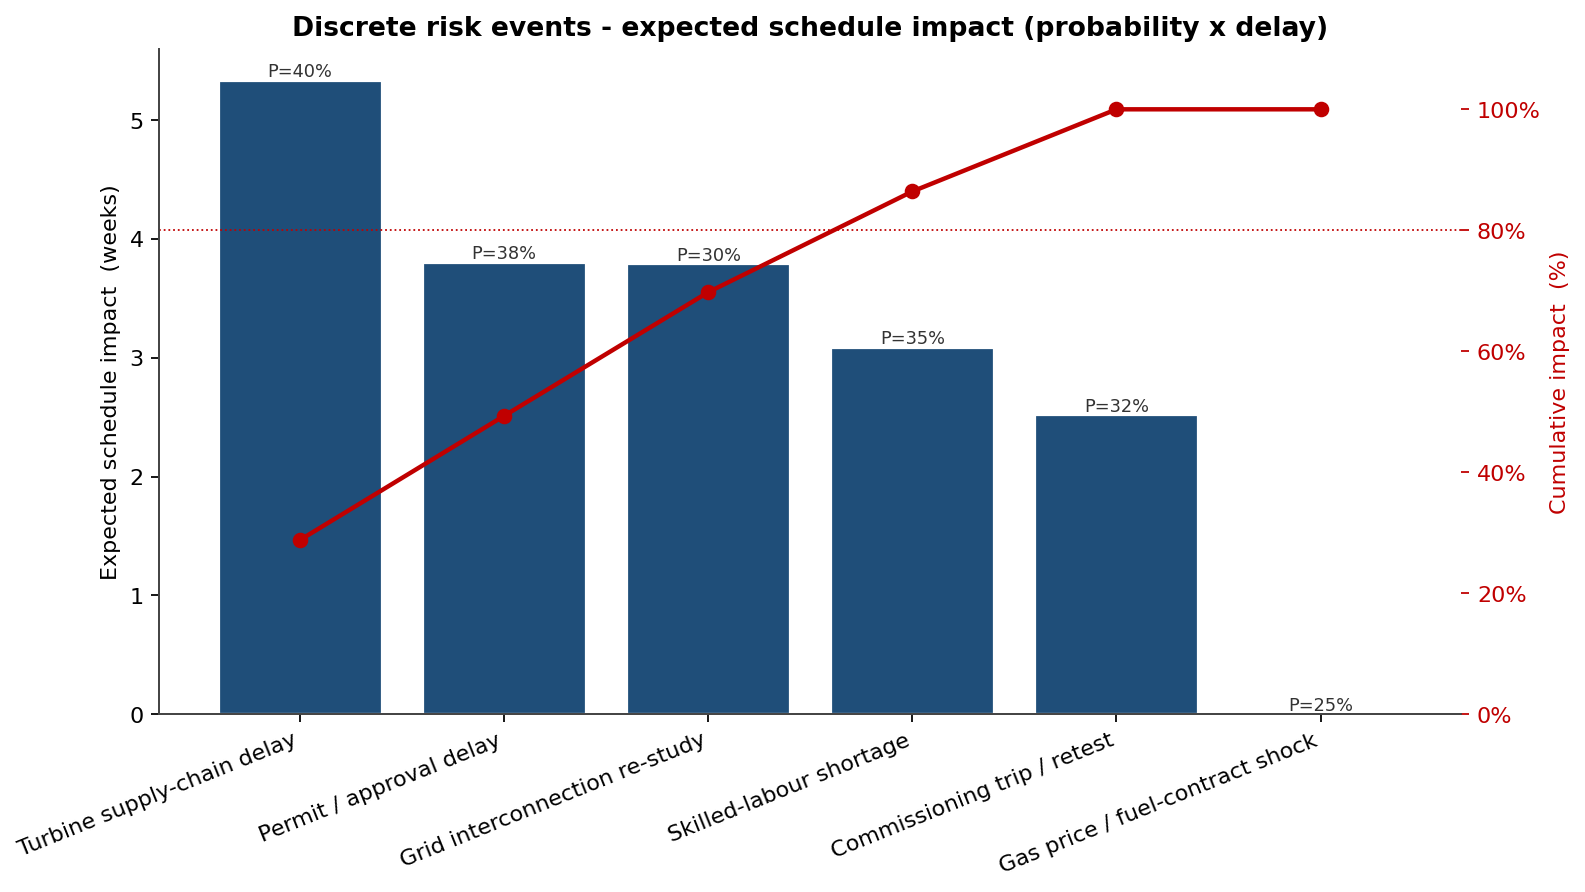
Four of the six events carry ~80% of the expected discrete-event delay — a turbine supply-chain delay (5.3 weeks expected), a permit/approval delay (3.8), a grid-interconnection re-study (3.8) and a skilled-labour shortage (3.1). The gas-price/fuel-contract shock carries no schedule impact at all — it is a pure cost risk, and the Pareto correctly isolates it. These same events dominate the cost tail, which is why the mitigation package targets exactly them.
What Tamara changed
- The budget moved from a single number to a risk-informed probability of overrun (19%), which the mitigation package then cut to 6%.
- Cost and schedule were managed as one coupled risk: 19% of runs are both late and over budget, and the turbine package drives both.
- A 6.4-month schedule contingency was quantified and funded, rather than discovered one slipped milestone at a time as the price window closed.
- Risk-reduction effort was redirected to erection and the turbine package — the two highest-cruciality activities — instead of being spread evenly across the bar chart.
Tamara Functionality Used
- Monte Carlo simulation of cost and schedule over the full activity network, with Beta-PERT durations and costs and parallel-path logic.
- Discrete risk-event modelling (Bernoulli occurrence × Triangular impact) on durations and costs, including a pure cost-only price shock.
- Joint cost–schedule density quantifying the probability of being late and over budget together.
- Criticality and cruciality analysis distinguishing how often a task is critical from how much its variability moves the COD.
- Stochastic Gantt and discrete-risk Pareto for communicating schedule uncertainty and prioritising risk response.
- Scenario comparison quantifying a mitigation package's before/after impact on the overrun probability and the P80 COD.
In a price-exposed development the schedule is the revenue case and the cost is where it shows up. Tamara is what turns "what will it cost?" into a probability the developer, the lender and the offtaker can all plan around.