

Weapon System Development Risks: The Handful of Events That Drive the Slip
A defense contractor signs a fixed-price contract to develop a next-generation missile-defense system. The programme runs for years - requirements, technology maturation, seeker and propulsion development, integration, ground and flight test, qualification. On a fixed-price deal, every month of schedule slip is the contractor's own money, and the slip is rarely spread evenly: a small number of discrete development events do most of the damage. Tamara, Vose Software's project schedule and cost risk tool, runs the whole development network as a Monte-Carlo simulation and ranks those events by the schedule they actually cost.
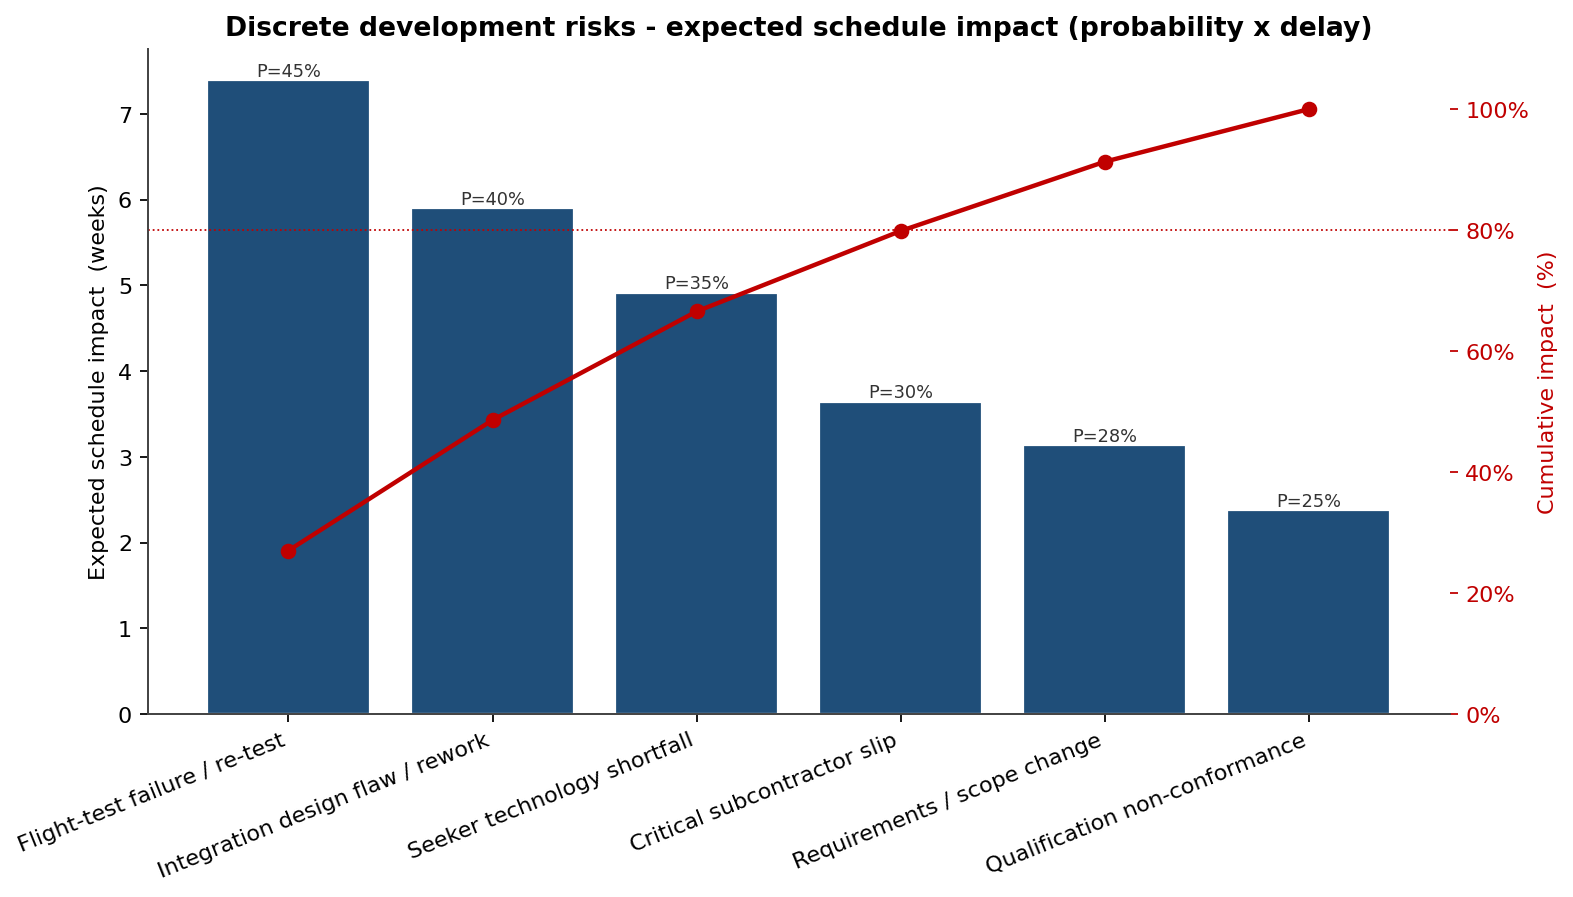
The risk Pareto is the headline. It ranks the six discrete development risk events by expected schedule impact - probability times average delay, in weeks - with a cumulative line. Flight-test failure / re-test (6.4 weeks) tops the chart, followed by integration design flaw / rework (5.1 weeks), seeker technology shortfall (4.2 weeks), and critical subcontractor slip (3.0 weeks). Those top four of six events carry roughly 80% of the total discrete-risk delay exposure. On a fixed-price programme that is the to-do list in priority order: spend risk-reduction money on the test and integration chain first, because that is where the schedule - and the contractor's margin - leaks fastest.
Four of six events carry 80% of the delay exposure
Each phase duration is also modelled with a Beta-PERT distribution, and those discrete events add delay on top. The deterministic plan - every phase at its most-likely duration, no risk firing - completes in 1,560 days (4.3 years) from the 3 August 2026 start.
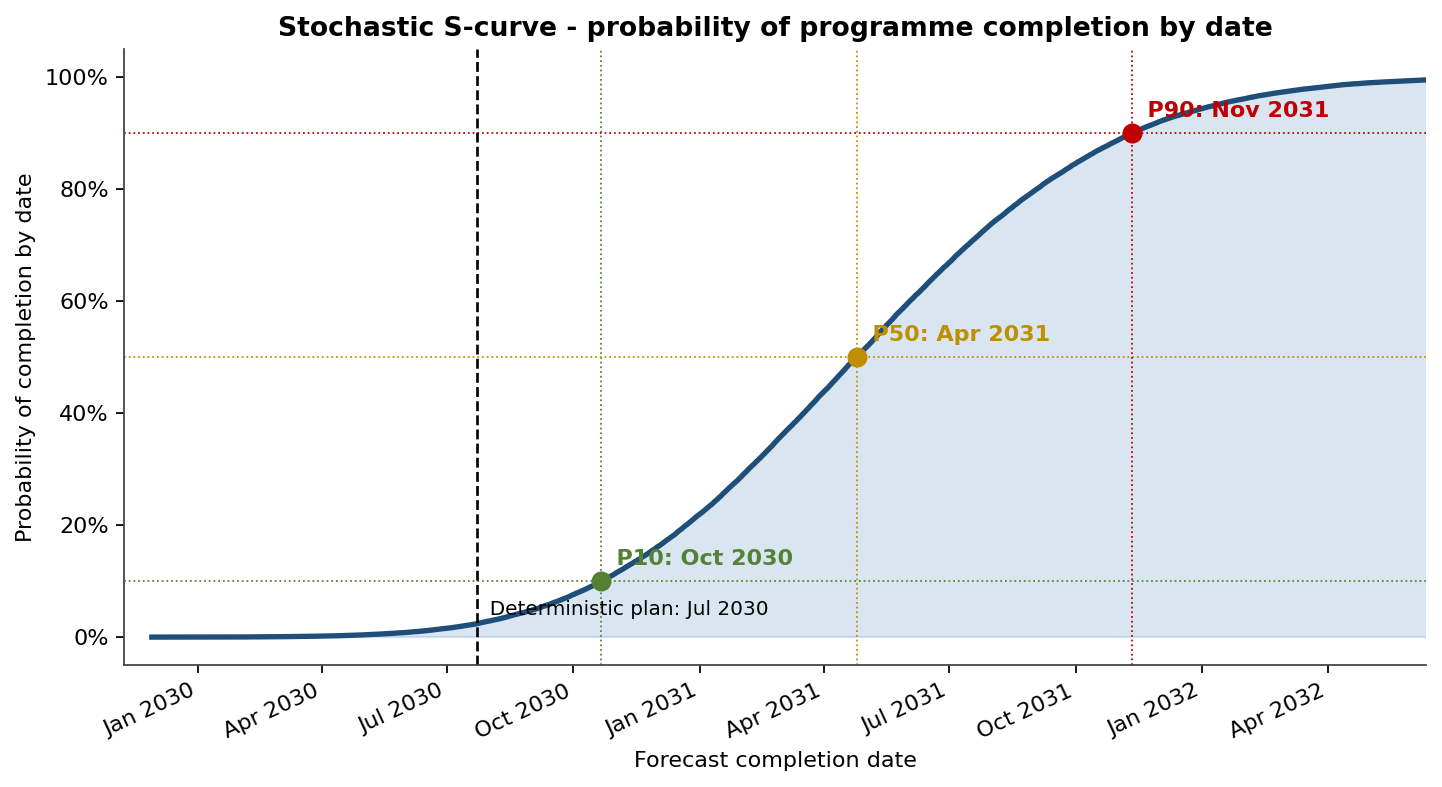
The S-curve shows how rarely that plan holds. The deterministic 4.3-year plan has only a 3% chance of being met once development and integration risk are modelled. The P50 completion slips 205 days past the plan and the P90 reaches 452 days late - well over a year of schedule erosion. The programme needs a P80 contingency of 312 days (10.3 months) beyond the published plan.
Which phases actually drive the delivery date
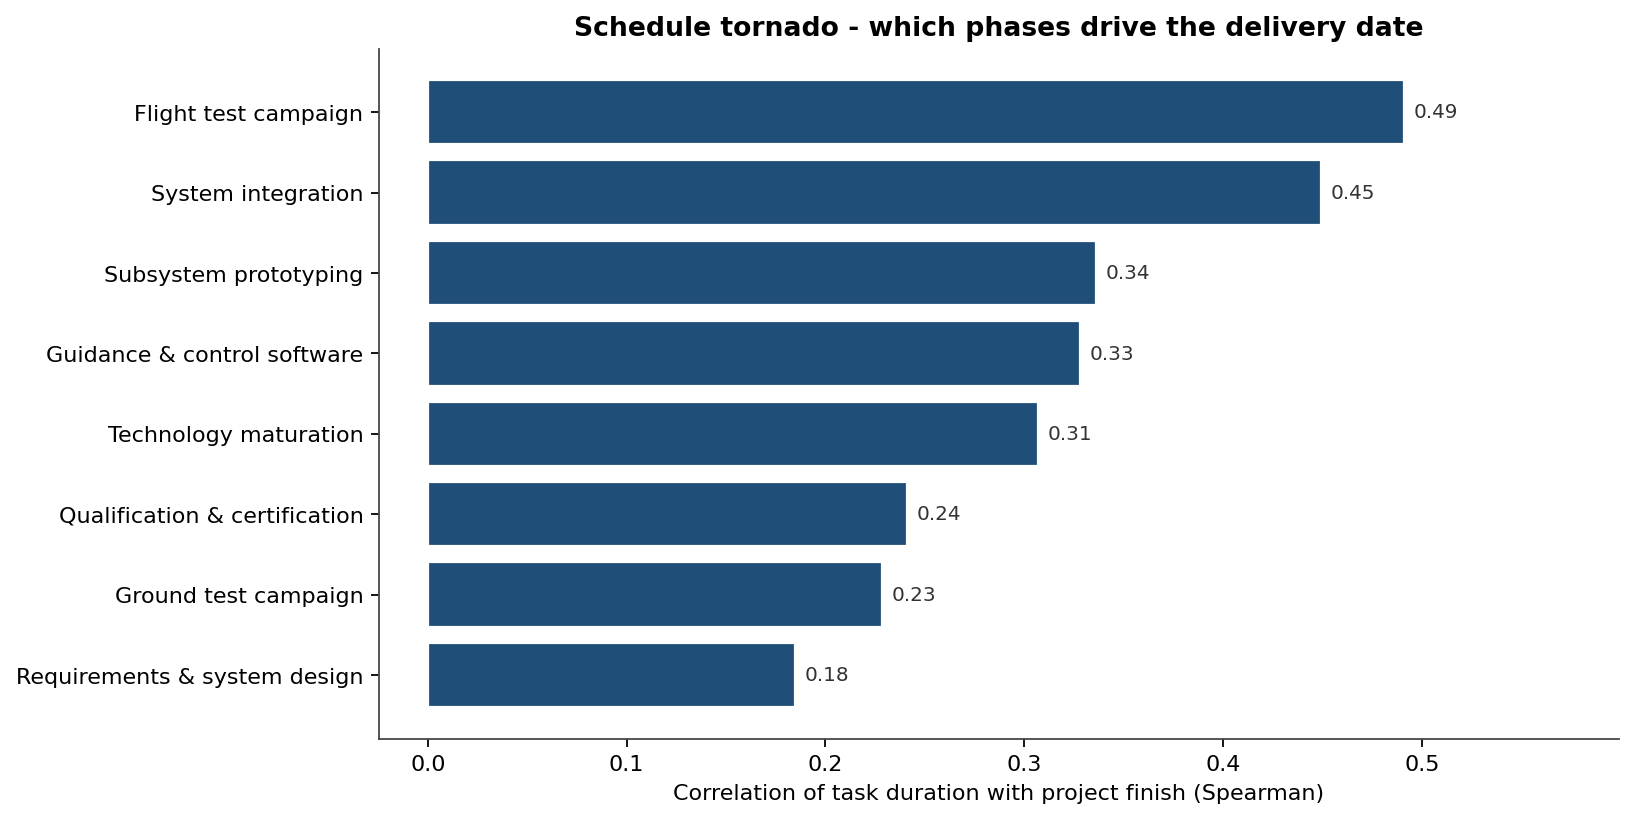
The schedule tornado ranks each phase by the correlation (cruciality) between its duration and the completion date. Flight test campaign (0.49), system integration (0.46), and technology maturation (0.39) top the chart - the technically hardest phases, the same chain the Pareto's discrete events strike, and where early risk-reduction testing buys the most schedule certainty.
Mitigation moves the whole cost distribution
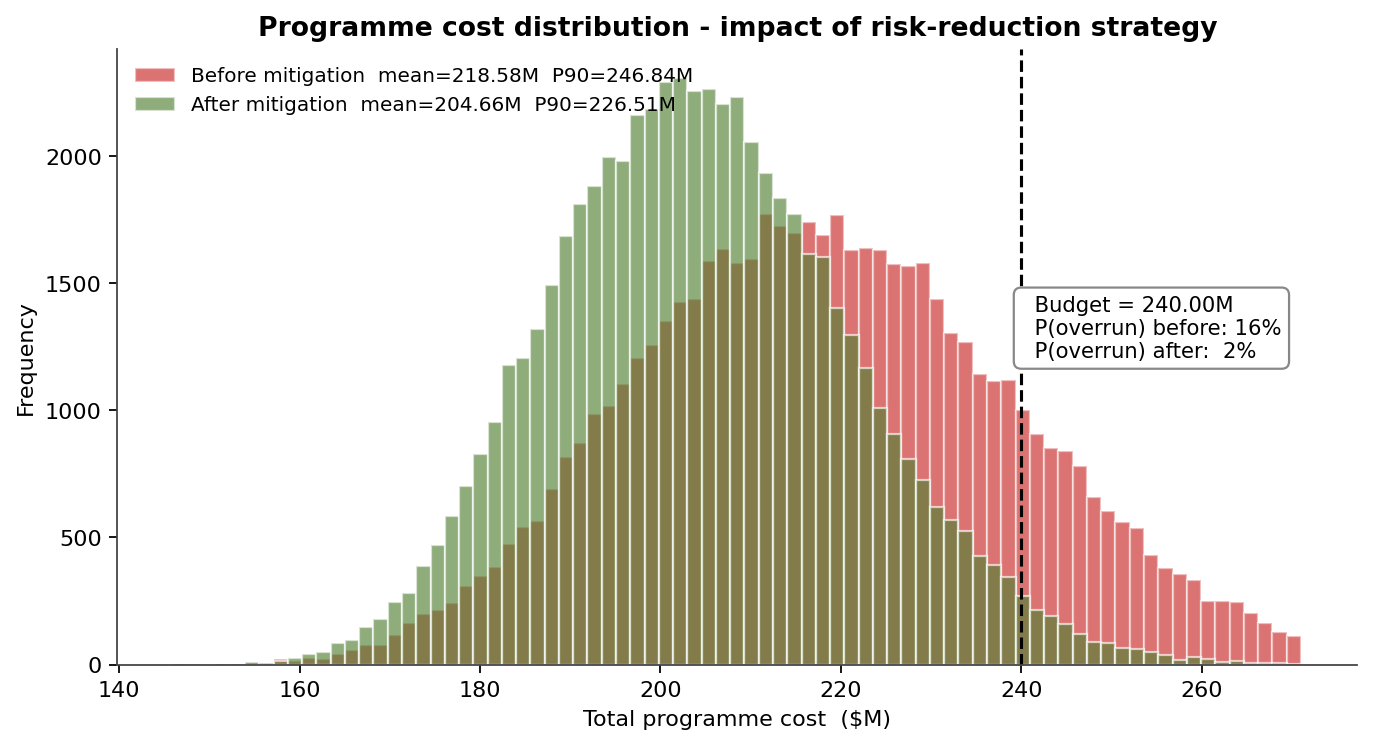
Schedule risk is cost risk, and on a fixed-price contract it is the contractor's cost. Before mitigation the programme runs a mean of $233M with a P90 of $268M and a 38% chance of breaching the $240M fixed price. A risk-reduction strategy - enhanced subcontractor oversight, early and parallel risk-reduction testing on the seeker and integration - shifts the distribution left to a mean of $222M, a P90 of $253M, and cuts the overrun probability to 22%.
Where the schedule uncertainty accumulates
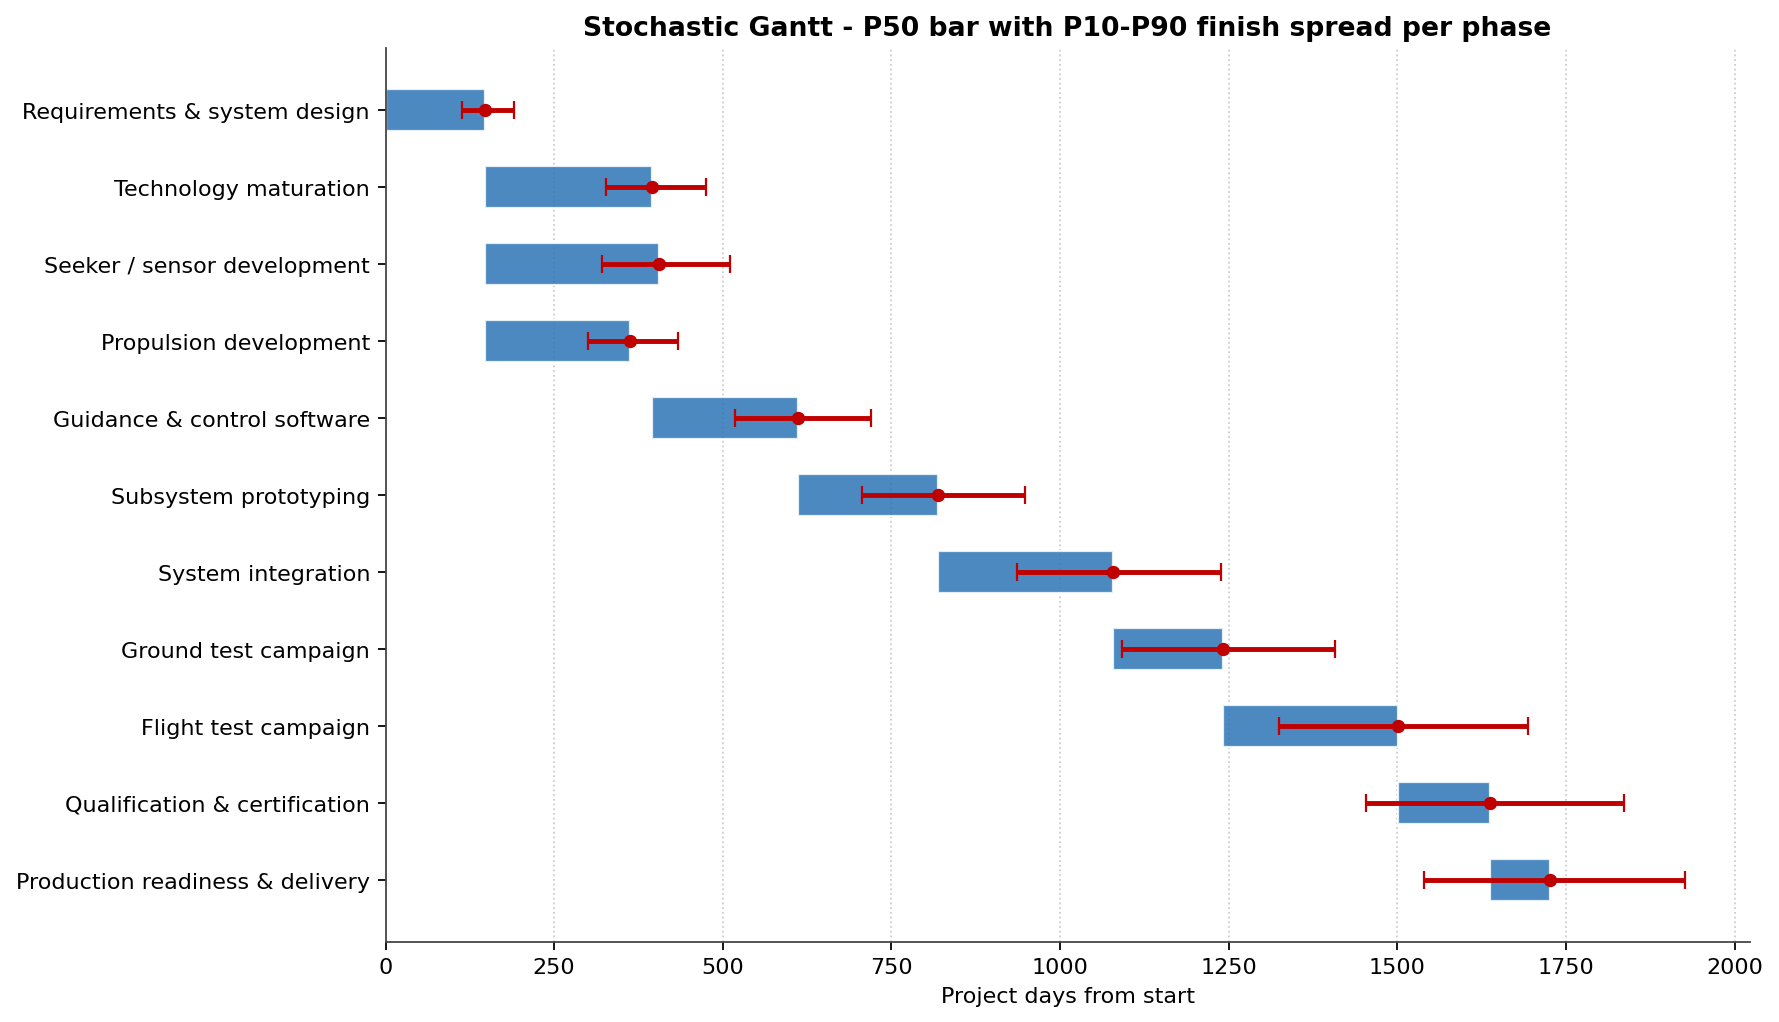
The stochastic Gantt shows where that uncertainty concentrates phase by phase. Each bar runs to its phase's P50 finish, with red whiskers spanning P10 to P90. System integration, flight test, and technology maturation carry the widest bands - the same phases the Pareto and tornado flag, where untested technology drives the spread.
The combined picture - a Pareto that names the four events worth mitigating, a 3% chance of holding the plan, and a 10.3-month P80 contingency - lets the contractor price the fixed-price bid against a realistic cost distribution and fund risk-reduction where it pays back, before signing.
This article is part of our Tamara case study series. Contact us to discuss how Tamara can quantify schedule and cost risk on your programmes.