

Mission Planning Uncertainties: When the Mission Arrives Late AND Over Budget
A combatant command must field an advanced defense system to a remote theatre by a fixed operational ready-date and within a fixed sustainment budget. The timeline runs from mission planning and reconnaissance through resource allocation, equipment pre-positioning, strategic transport, forward-base setup, deployment, training and a final readiness exercise. Schedule and cost are not separate worries: every day the operation runs long burns standby and sustainment money, so a slip is also an overrun. Tamara, Vose Software's project schedule and cost risk tool, runs the whole operation as a Monte-Carlo simulation and maps that joint exposure directly.
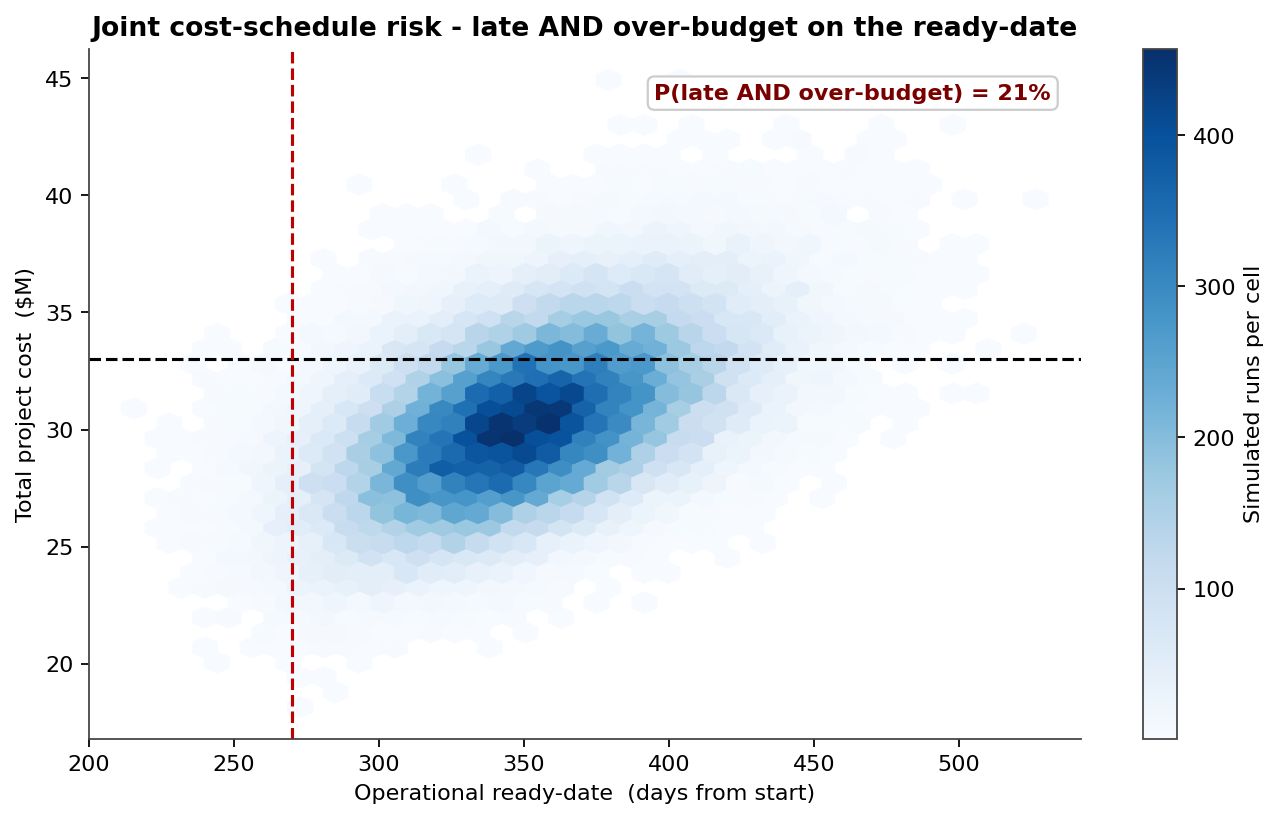
The joint cost-schedule density is the headline. Every simulated mission is plotted by its operational ready-date (horizontal) and its total cost (vertical), with the deterministic plan and the $33M budget drawn as crosshairs. The quadrant that matters is top-right - missions that arrive late and over budget at the same time - and 22% of the 60,000 simulated missions land there. Because standby overhead couples the two axes, the cloud tilts up and to the right: missions that slip tend to be the same ones that overrun. A plan judged only against the schedule, or only against the budget, would hide that one-in-five chance of failing both at once.
A 199-day, $33M plan with a 22% chance of failing both at once
Each phase duration is modelled with a Beta-PERT distribution, and six discrete mission risk events - adverse weather, airlift disruption, terrain-driven recon delay, cyber and geopolitical holds - add delay to specific phases. The deterministic plan reaches operational readiness in 199 days from the 6 July 2026 start, yet holds only 6% of the time; the realistic timeline needs a P80 contingency of 38 days (5.4 weeks) beyond the published plan.
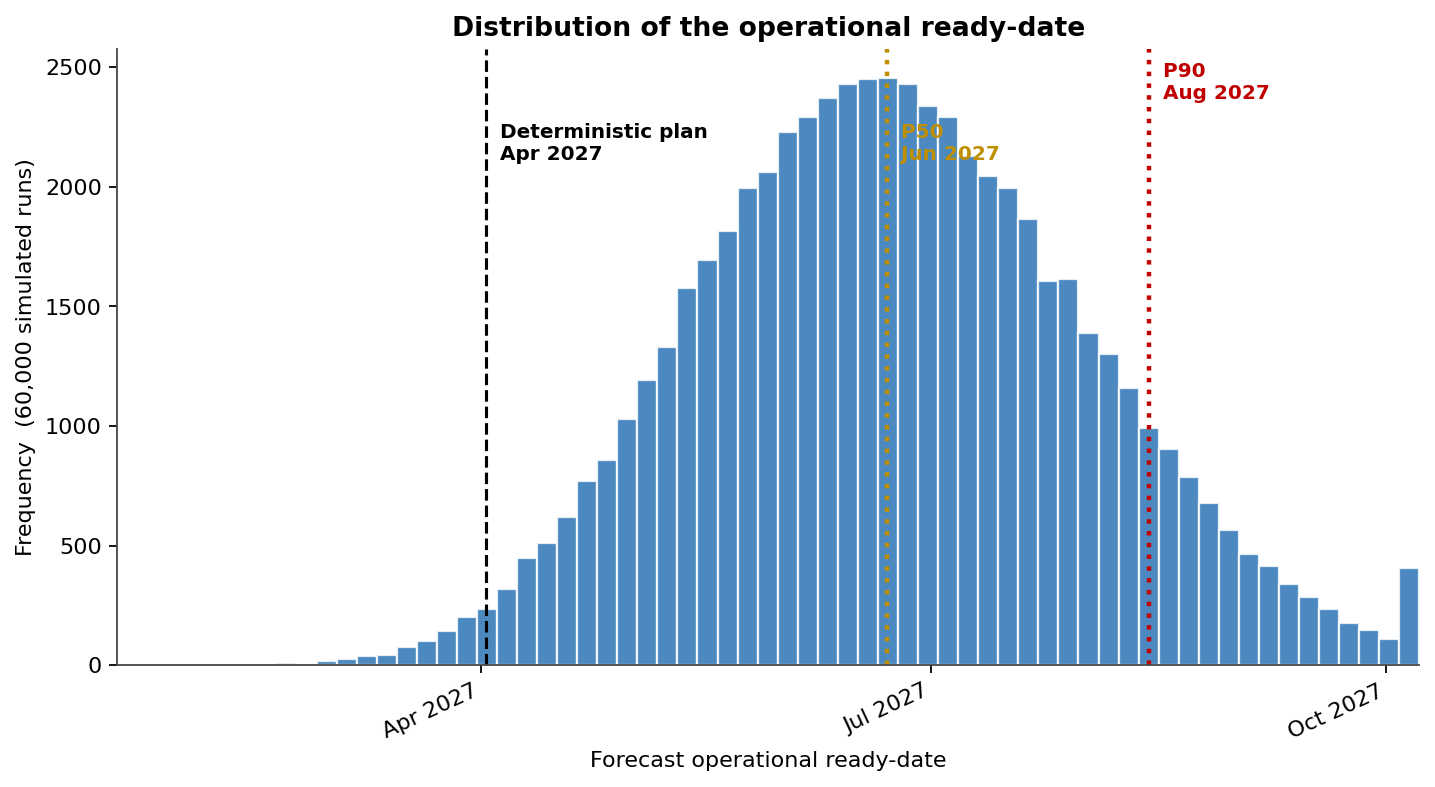
The ready-date histogram shows the schedule axis of that joint risk on its own. The deterministic 199-day plan sits on the far-left edge of the spread, the P50 lands 33 days later, and the long right tail reaches the P90 at 84 days late - the shape of a plan that can only slip, never gain.
Which phases to de-risk
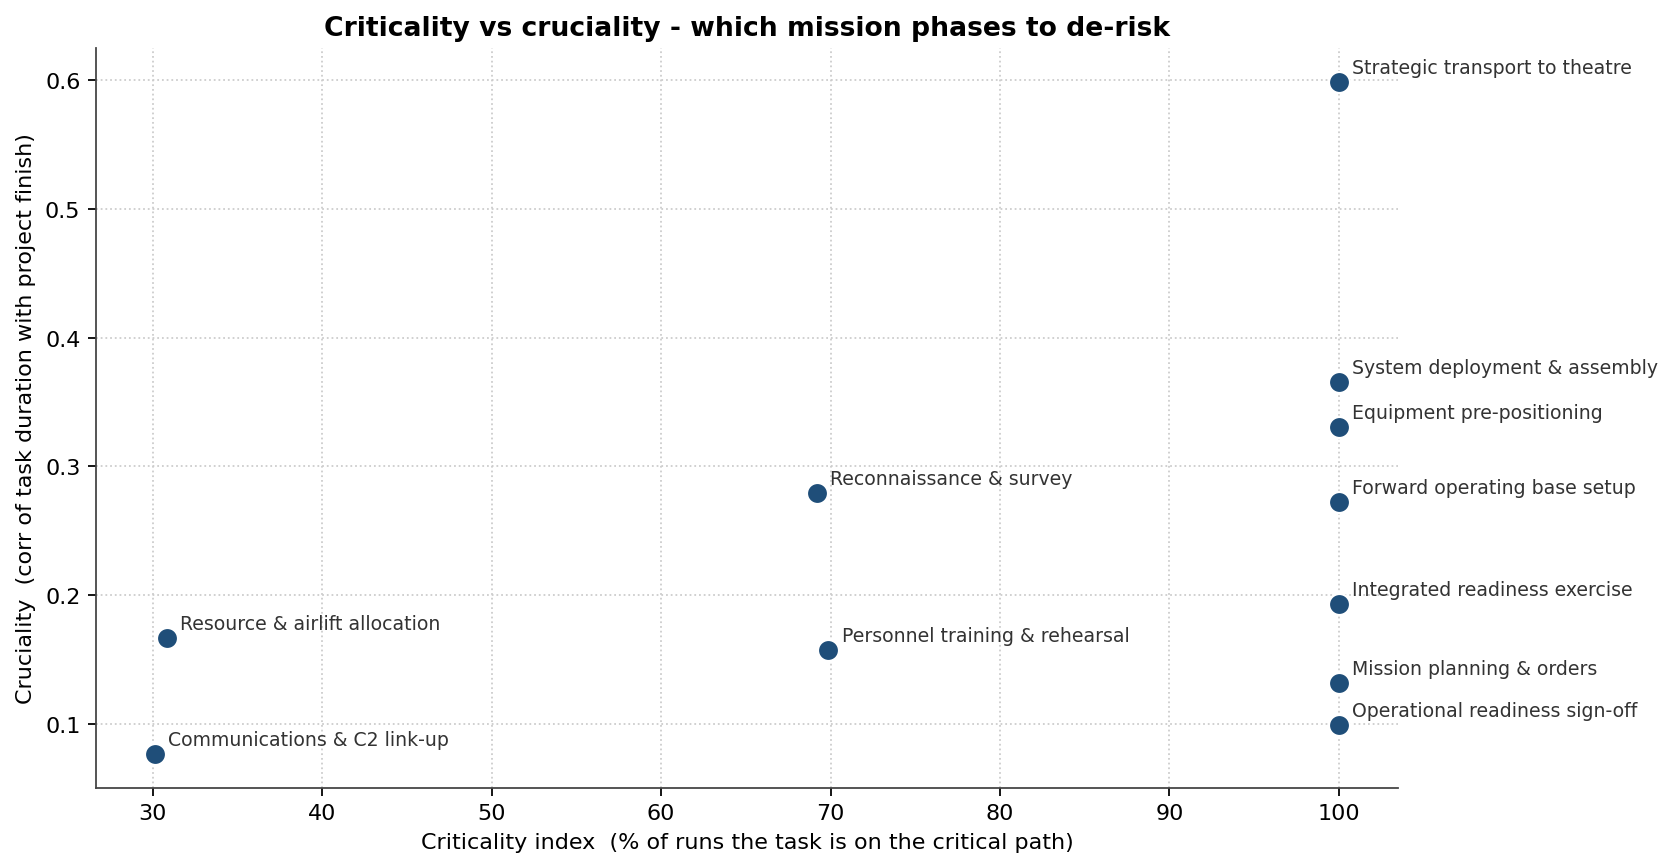
The criticality-vs-cruciality scatter places each phase by how often it sits on the critical path against how strongly its duration correlates with the ready-date. The top-right cluster is where pre-positioning and dedicated airlift pay back. Strategic transport to theatre (critical 92%, cruciality 0.47), forward operating base setup (100%, 0.44), and equipment pre-positioning (92%, 0.43) lead, with system deployment & assembly (0.39) and the integrated readiness exercise (0.34) close behind - the logistics-heavy phases most exposed to weather and airlift variability. Communications & C2 link-up, on the critical path only 63% of the time at cruciality 0.24, is a far weaker driver.
Mitigation moves the whole cost distribution
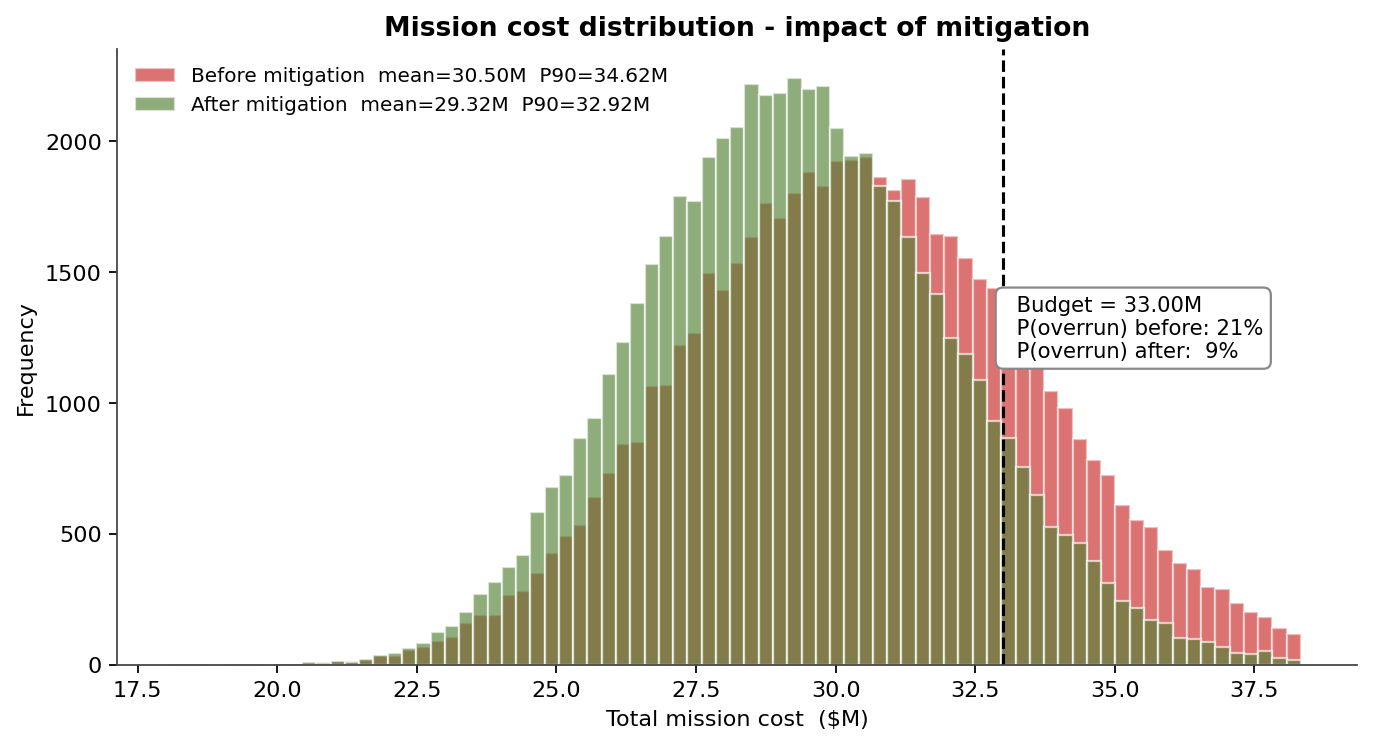
Schedule risk is cost risk: every day beyond the plan carries sustainment and standby overhead. Before mitigation the mission costs a mean of $22.5M with a P90 of $27.5M and a 30% chance of breaching the $33M budget. A mitigation package - forward pre-positioning of critical equipment, dedicated airlift, and advanced weather forecasting - shifts the distribution left to a mean of $21.5M, a P90 of $25.8M, and cuts the overrun probability to 14%.
The discrete mission risks ranked by expected delay
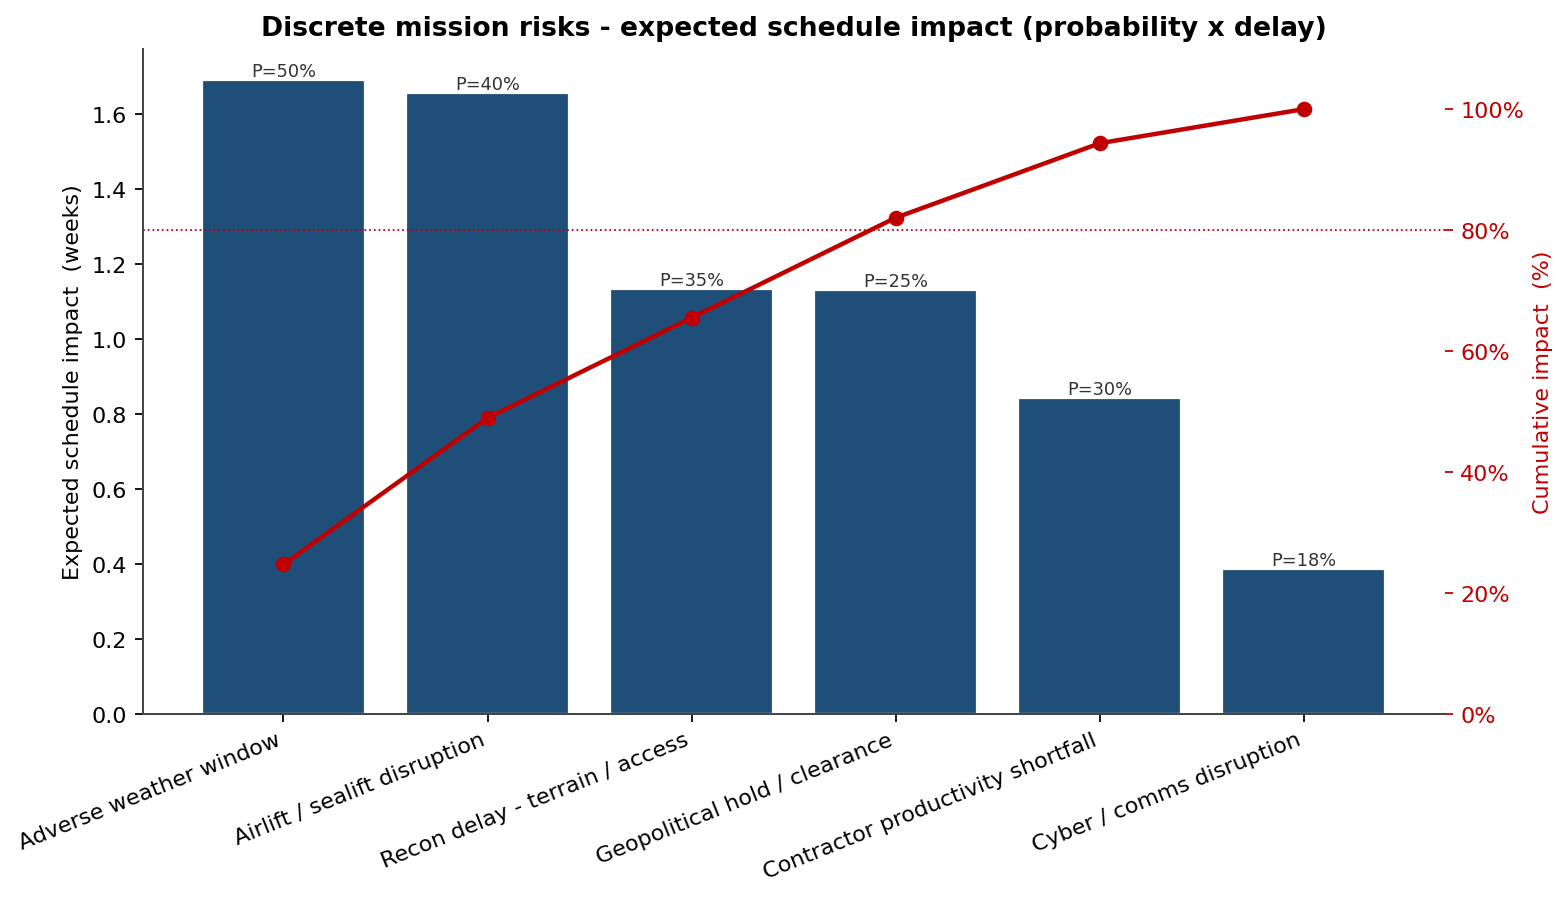
The Pareto chart isolates the six mission risk events and ranks them by expected schedule impact - probability times average delay, in weeks. Airlift/sealift disruption (3.1 weeks) and the adverse weather window (2.7 weeks) lead; the top four events carry roughly 80% of the total discrete-risk delay exposure. That ranking is the planner's mitigation priority list.
The combined picture - a one-in-five chance of arriving late and over budget together, a 6% chance of being ready on time, and a clear ranking of which phases set the ready-date - lets planners build a defensible contingency into both the timeline and the budget, and target mitigation at the phases that actually move the outcome, before forces commit.
This article is part of our Tamara case study series. Contact us to discuss how Tamara can quantify schedule and cost risk on your operations.