

Project Cost Estimation: Why a Single-Point Estimate Under-Funds the Budget
A transport agency puts a highway-and-bridge programme out to tender. The engineer's estimate rolls up eleven work packages - earthworks, bridge foundations and superstructure, pavement, tolling systems - into a single number, and a budget gets funded by adding a flat percentage on top. Tamara, Vose Software's project schedule and cost risk tool, runs the whole programme as a Monte-Carlo simulation and shows why that single-point estimate, plus a round-number contingency, systematically under-funds the job.
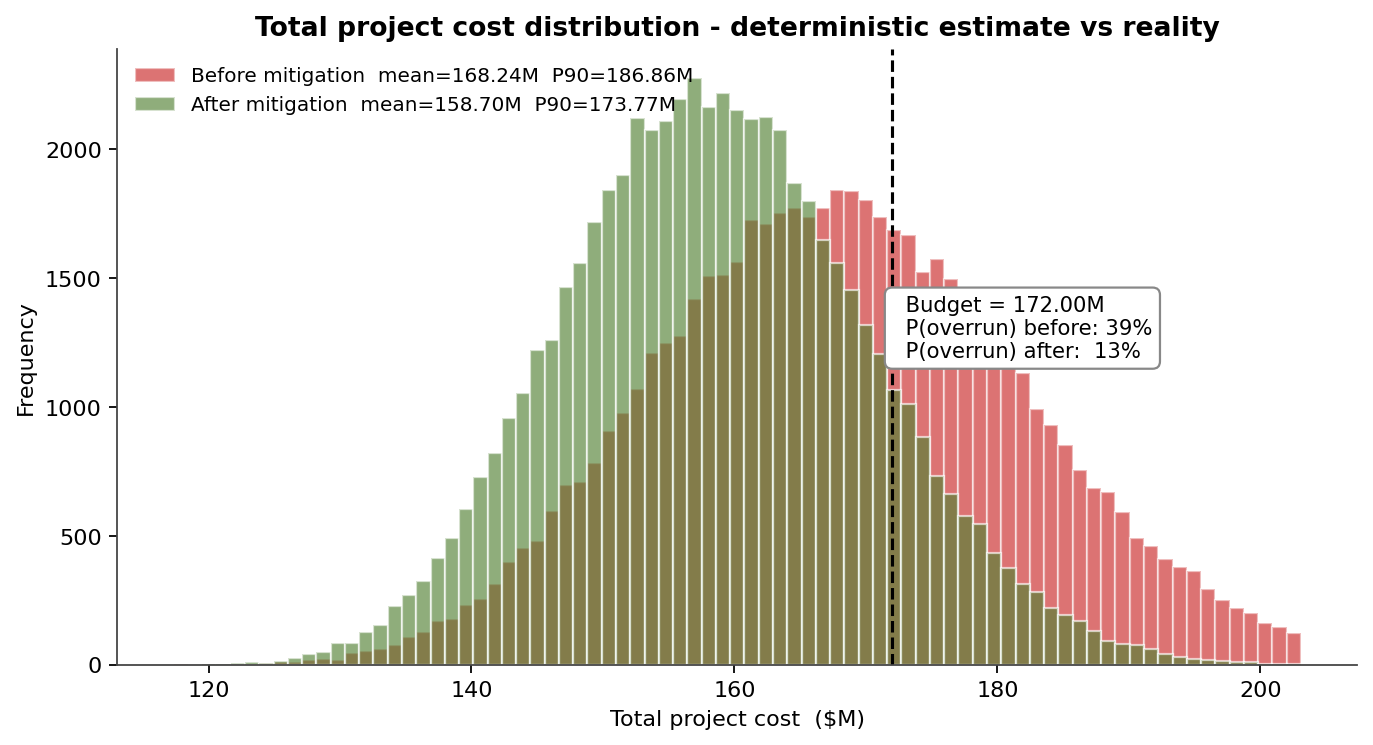
The cost distribution is the headline. The deterministic single-point estimate - every work package at its most-likely cost - totals $132M. The simulation, which layers in material-price, labour-rate and productivity variability plus six discrete cost-and-schedule risk events, puts the P50 at $157M, the P80 at $169M, and the P90 at $176M. The agency funded the budget at the estimate plus 30% - $172M - yet the simulation still shows a 17% chance of breaching even that funded figure. The mitigation distribution (green) overlays the unmitigated one (red): index-linked steel and binder supply contracts, an up-front geotechnical investigation, and productivity-based subcontracts together pull the mean from $158M down to $148M, the P90 from $176M to $166M, and the overrun probability from 17% to 6%.
A $132M estimate that needs $172M of funding - and still overruns 17% of the time
The single largest lesson is in the gap between the deterministic bar and the body of the distribution: roughly $25M of cost lives in the tail that a single-point estimate ignores entirely (the P50 already sits $25M above the deterministic number, and the P90 sits $44M above it).
Cost and schedule overrun together
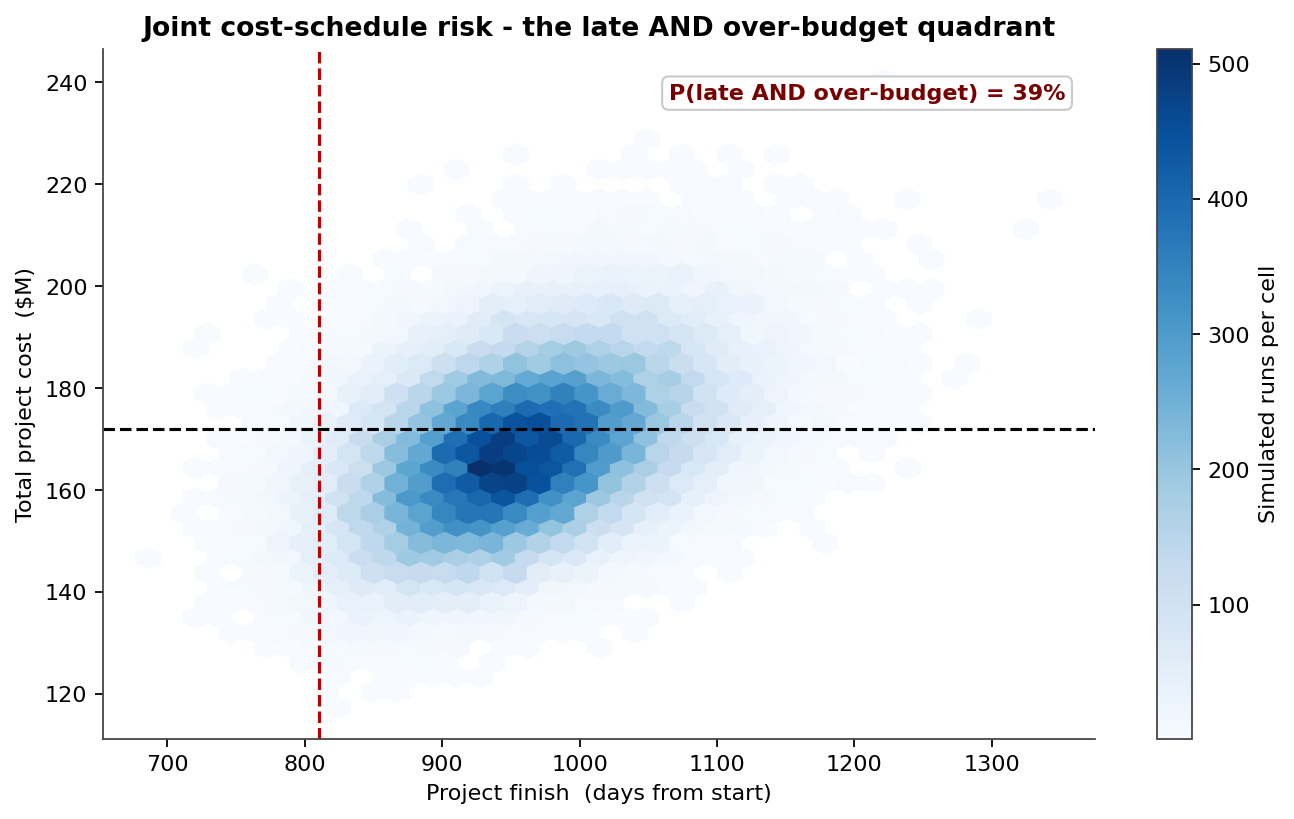
Cost overruns are partly schedule overruns: every day beyond the deterministic finish carries extended site overhead, so the two risks are correlated rather than independent. The joint density plots every simulated programme by its finish day and its total cost, with the deterministic plan and the funded budget drawn as crosshairs. The dangerous quadrant is top-right - late and over budget at the same time - and 16% of simulated programmes land there. A contingency sized to cost alone, or schedule alone, misses that joint exposure.
How much contingency each confidence level needs
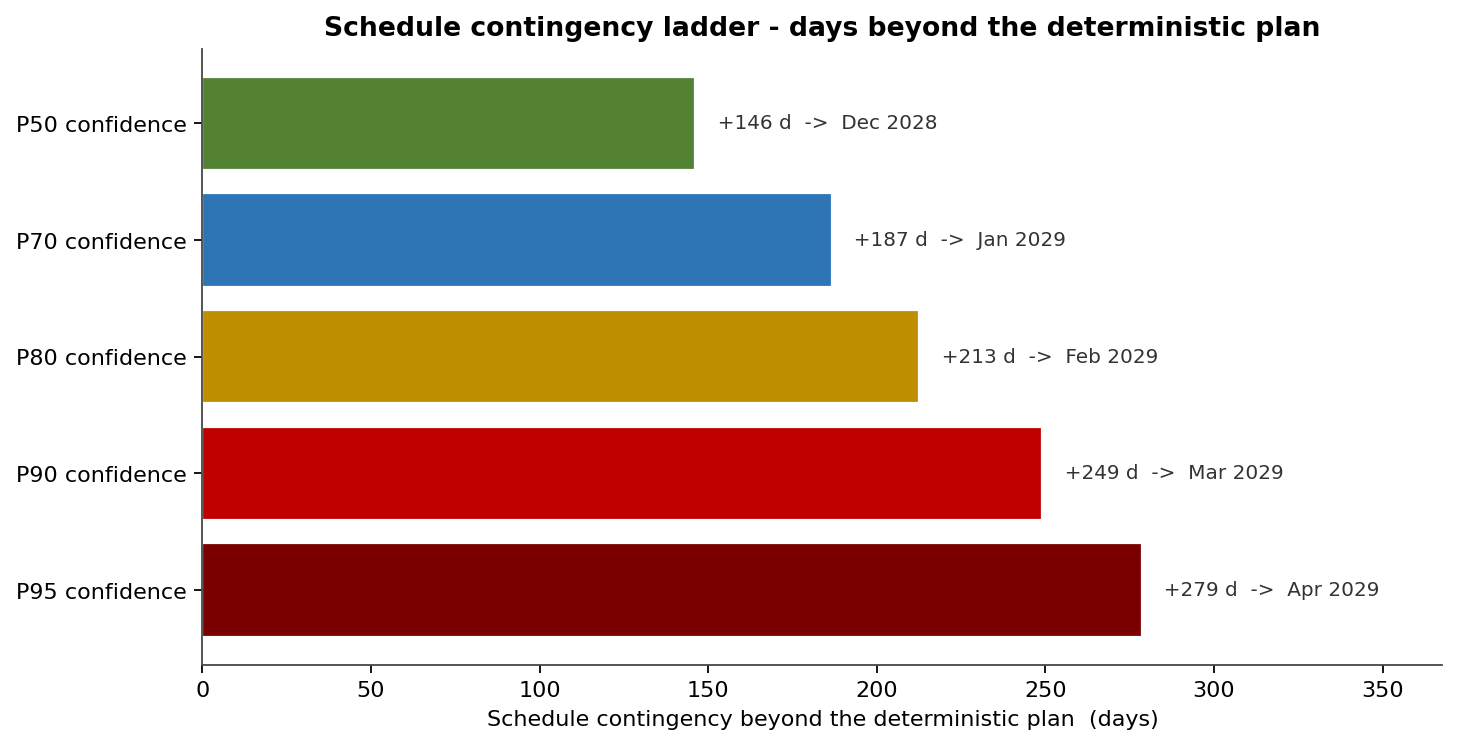
The contingency ladder reads as a decision table: how many days beyond the 730-day deterministic plan each confidence level requires. Buying P50 confidence costs +108 days; P70 costs +169 days; P80 costs +205 days; P90 costs +227 days; and P95 costs +257 days. Because schedule slip feeds the overhead bill, picking a confidence level on this ladder simultaneously sets the schedule buffer and a large slice of the cost contingency.
Which activities drive the cost and schedule
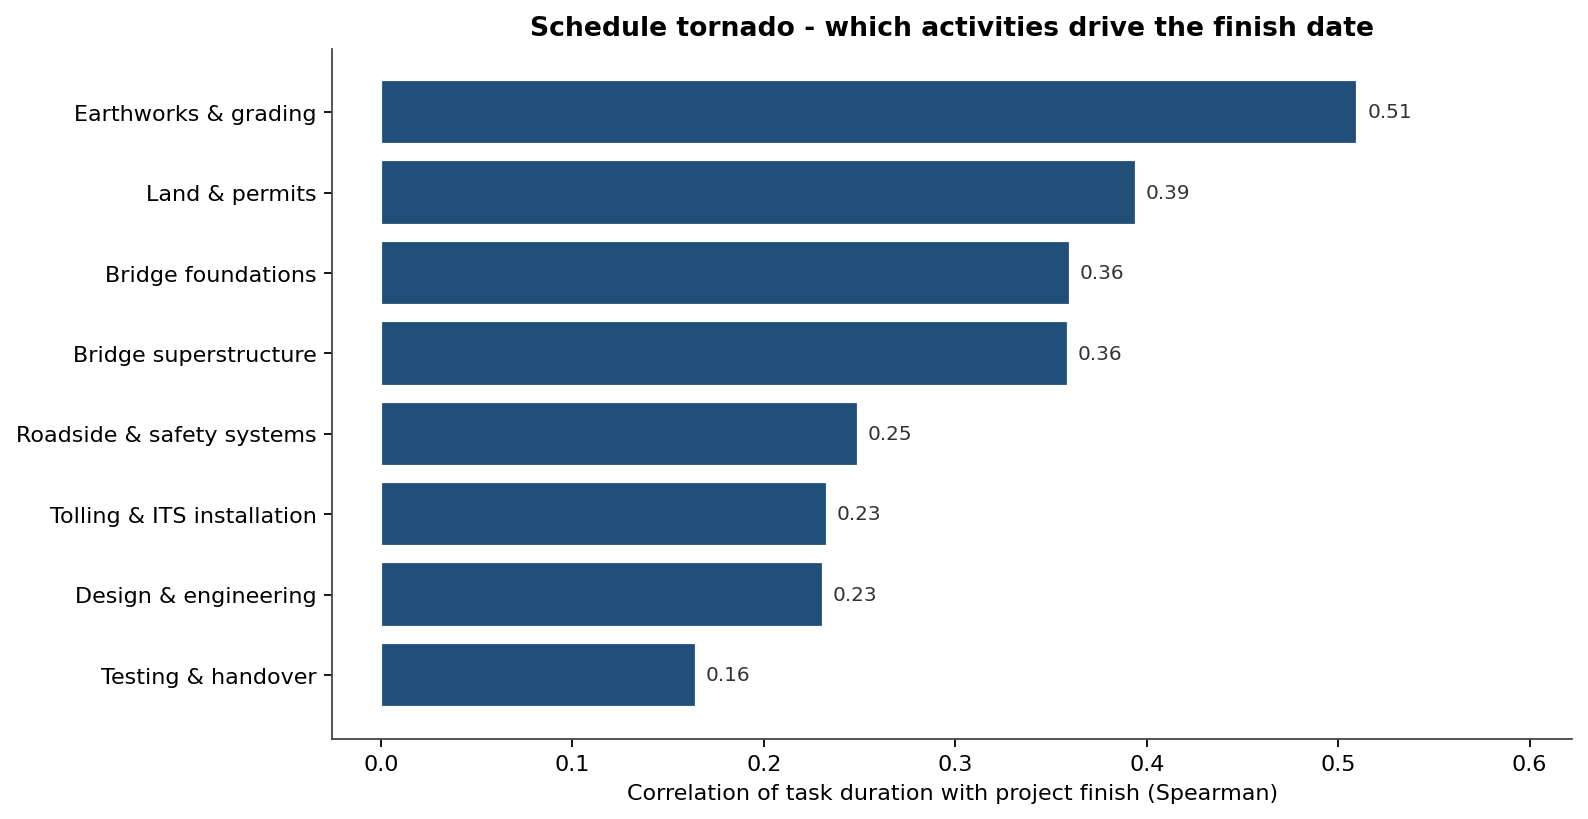
The schedule tornado ranks activities by the correlation between their duration and the project finish. Bridge superstructure (0.55), bridge foundations (0.40), and design & engineering (0.34) dominate - the same packages that carry the largest cost ranges, so they drive both the schedule and the budget. They are the first place to spend management attention.
The discrete risks ranked by expected delay
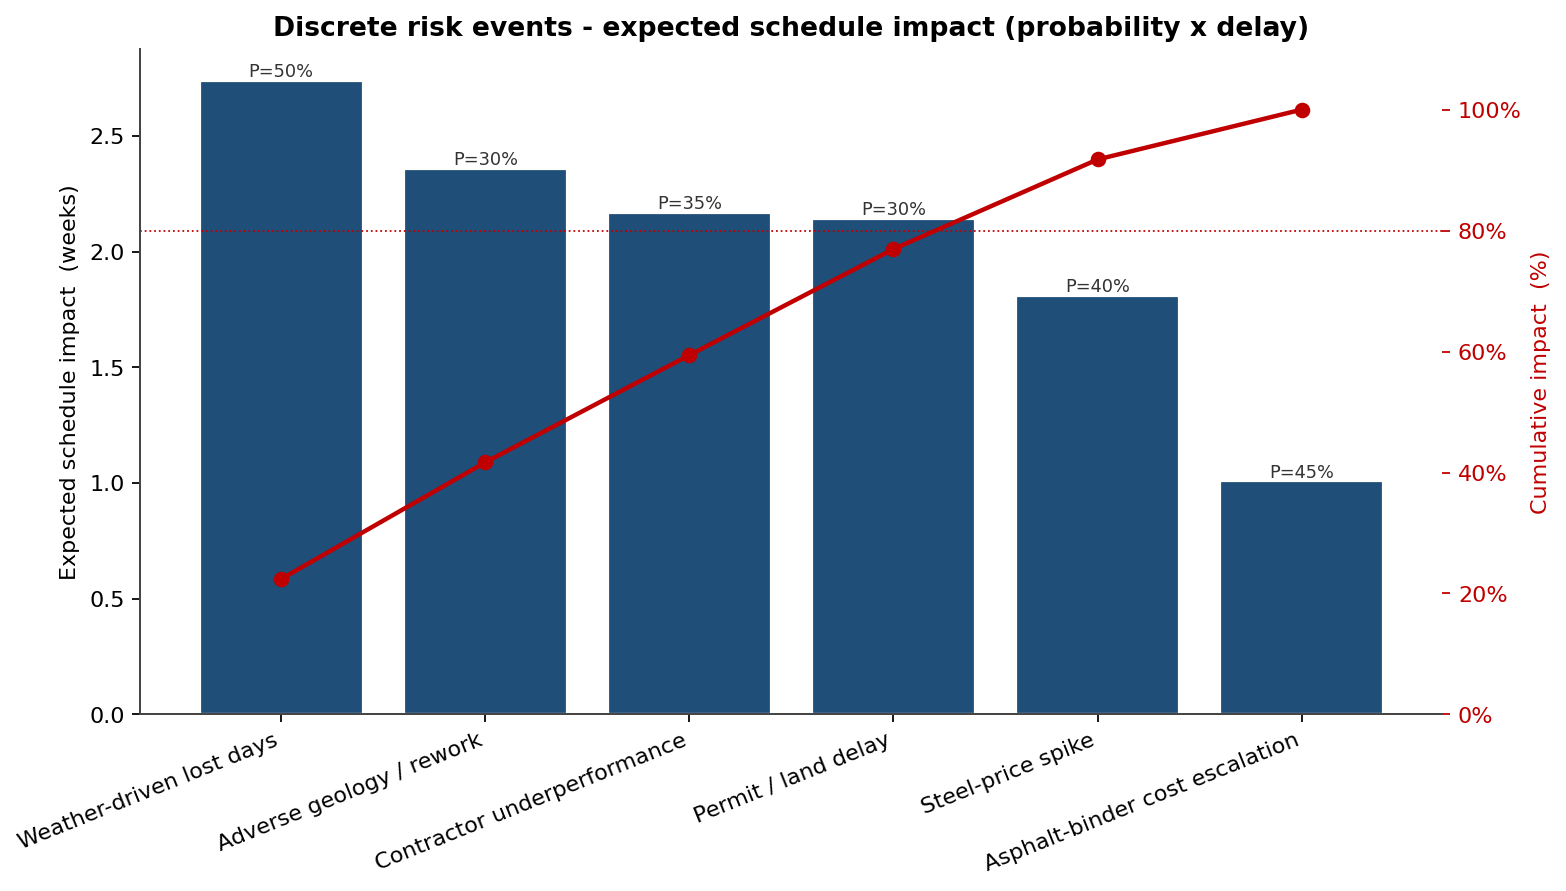
The Pareto chart ranks the six discrete risk events by expected schedule impact - probability times average delay, in weeks. Steel-price spike (8.4 weeks), adverse geology / rework (4.2 weeks), and contractor underperformance (4.0 weeks) lead the ranking; the top four events carry roughly 80% of the discrete-risk exposure that the contingency is meant to cover.
The combined picture lets the agency fund a defensible contingency - sized to a P80 or P90 cost on the ladder, not a round-number markup - and target mitigation at the handful of packages that actually move the budget, before the contract is awarded.
This article is part of the Tamara case study series. Contact us to discuss how Tamara can quantify schedule and cost risk on your projects.