

Industry: Biotech
Product: Tamara
Application: Biomanufacturing process risks
The Plan Pointed at One PPQ Date. The Simulation Shows the Whole Spread — and the Plan Sits at Its Left Edge
A monoclonal-antibody commercial-scale campaign — tech transfer through process-validation (PPQ) — was scheduled the orthodox way: ten stages, each with a most-likely duration, chained through the network and read off the end as a single number — 505 working days, a clean September 2027 PPQ completion the program took to its launch team and its regulatory function. A single date hides the one thing a biomanufacturing campaign most needs to see: the shape of what can actually happen once contamination, failed batches and deviation investigations are in the model.
Rebuild the same campaign in Tamara, Vose Software's Monte Carlo project risk tool, with each stage carrying a Beta-PERT duration and six discrete process-failure events layered on top, and run it 60,000 times. The finish-date distribution that comes back is the honest picture — a broad, right-skewed body of outcomes with the deterministic plan stranded at its extreme left edge:
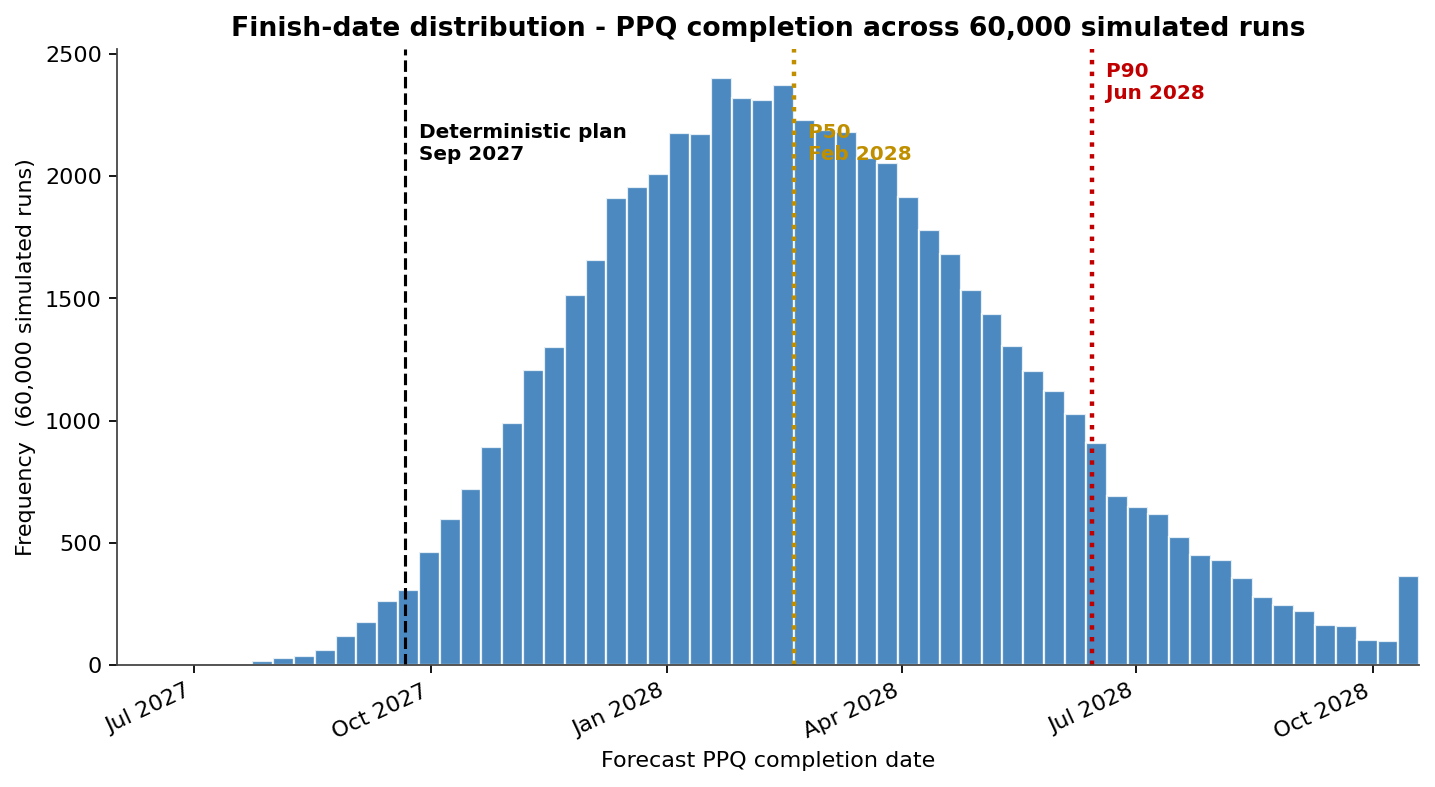
The bulk of outcomes fall between P50 February 2028 and P90 June 2028, with a long tail beyond. The September 2027 plan is not a central estimate — it is a near-best case with only a 1% chance of being met, sitting where the histogram has barely any mass. The distribution's right skew is the signature of a campaign exposed to rework: stage durations can finish a little early but overrun badly, a deviation-investigation loop can reopen, and a batch can fail and re-run, so the mean simulated finish is 662 days against the 505-day plan. The gap between the plan and the P80 finish is 226 days — roughly 7.4 months — the campaign's true, previously invisible schedule contingency.
Where the duration risk actually lives
Tamara reports each stage twice: its criticality index (how often it lands on the critical path) and its cruciality (the rank-correlation between its duration and the campaign finish — how much its variability actually moves the PPQ date).
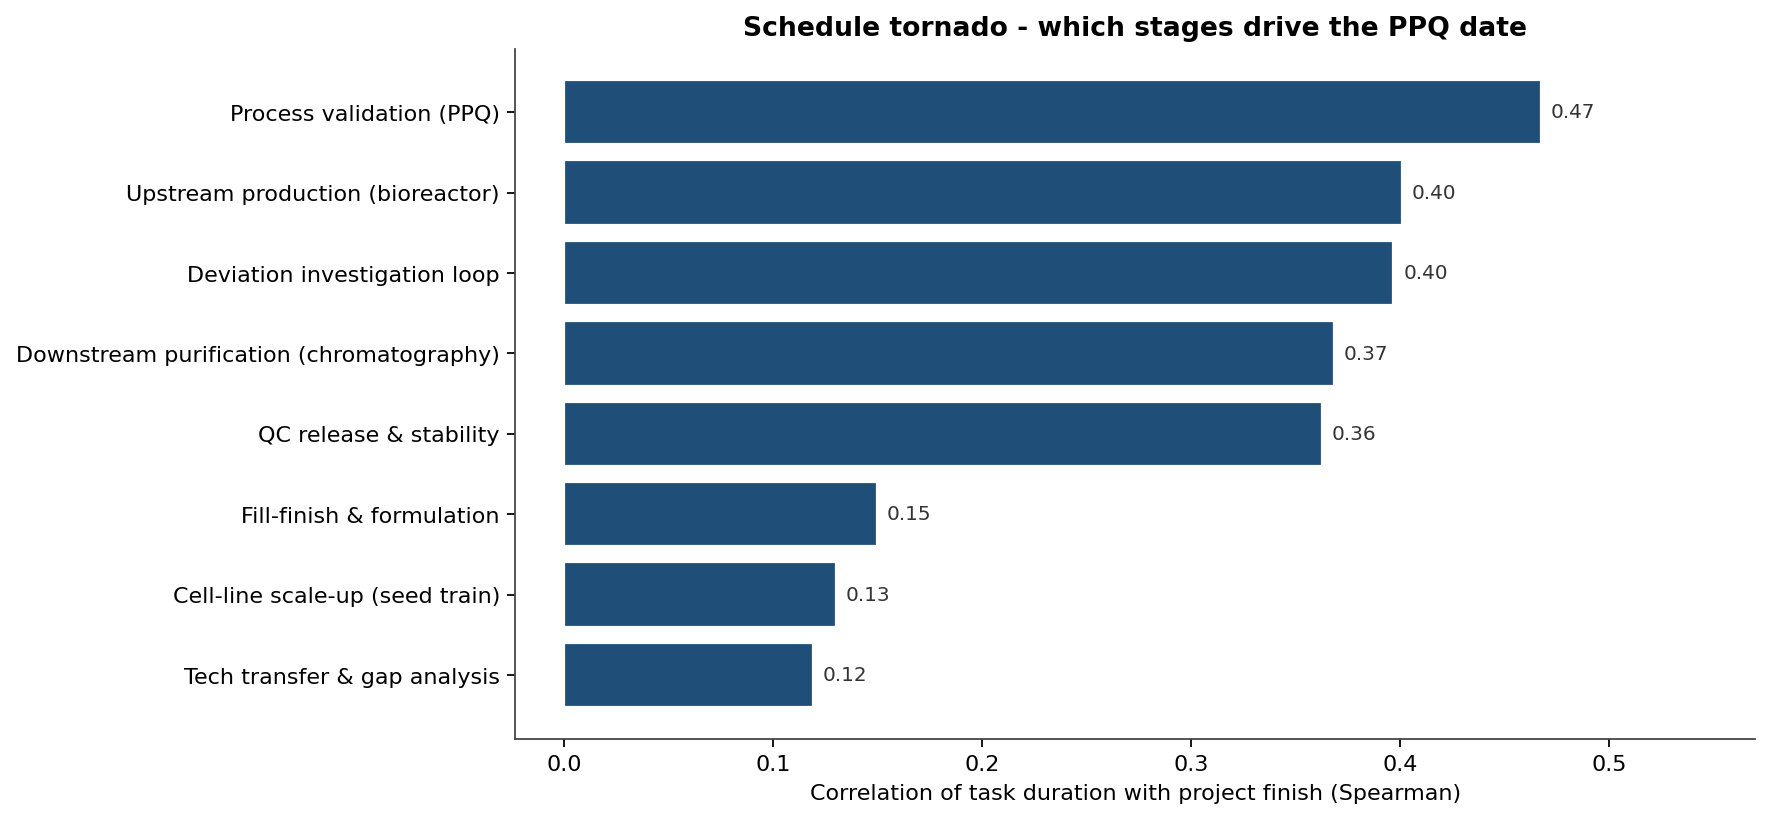
Process validation (PPQ) leads (cruciality 0.47), followed by upstream production in the bioreactor (0.40) and the deviation-investigation loop (0.40). This is the action list: duration certainty on the bioreactor step and on deviation handling buys more end-date than anything else, and the release-and-validate tail is on the critical path in essentially 100% of iterations — so the leverage is in keeping batches clean and deviations short, not in compressing QC.
The same simulation places every stage in time as a band, not a bar:
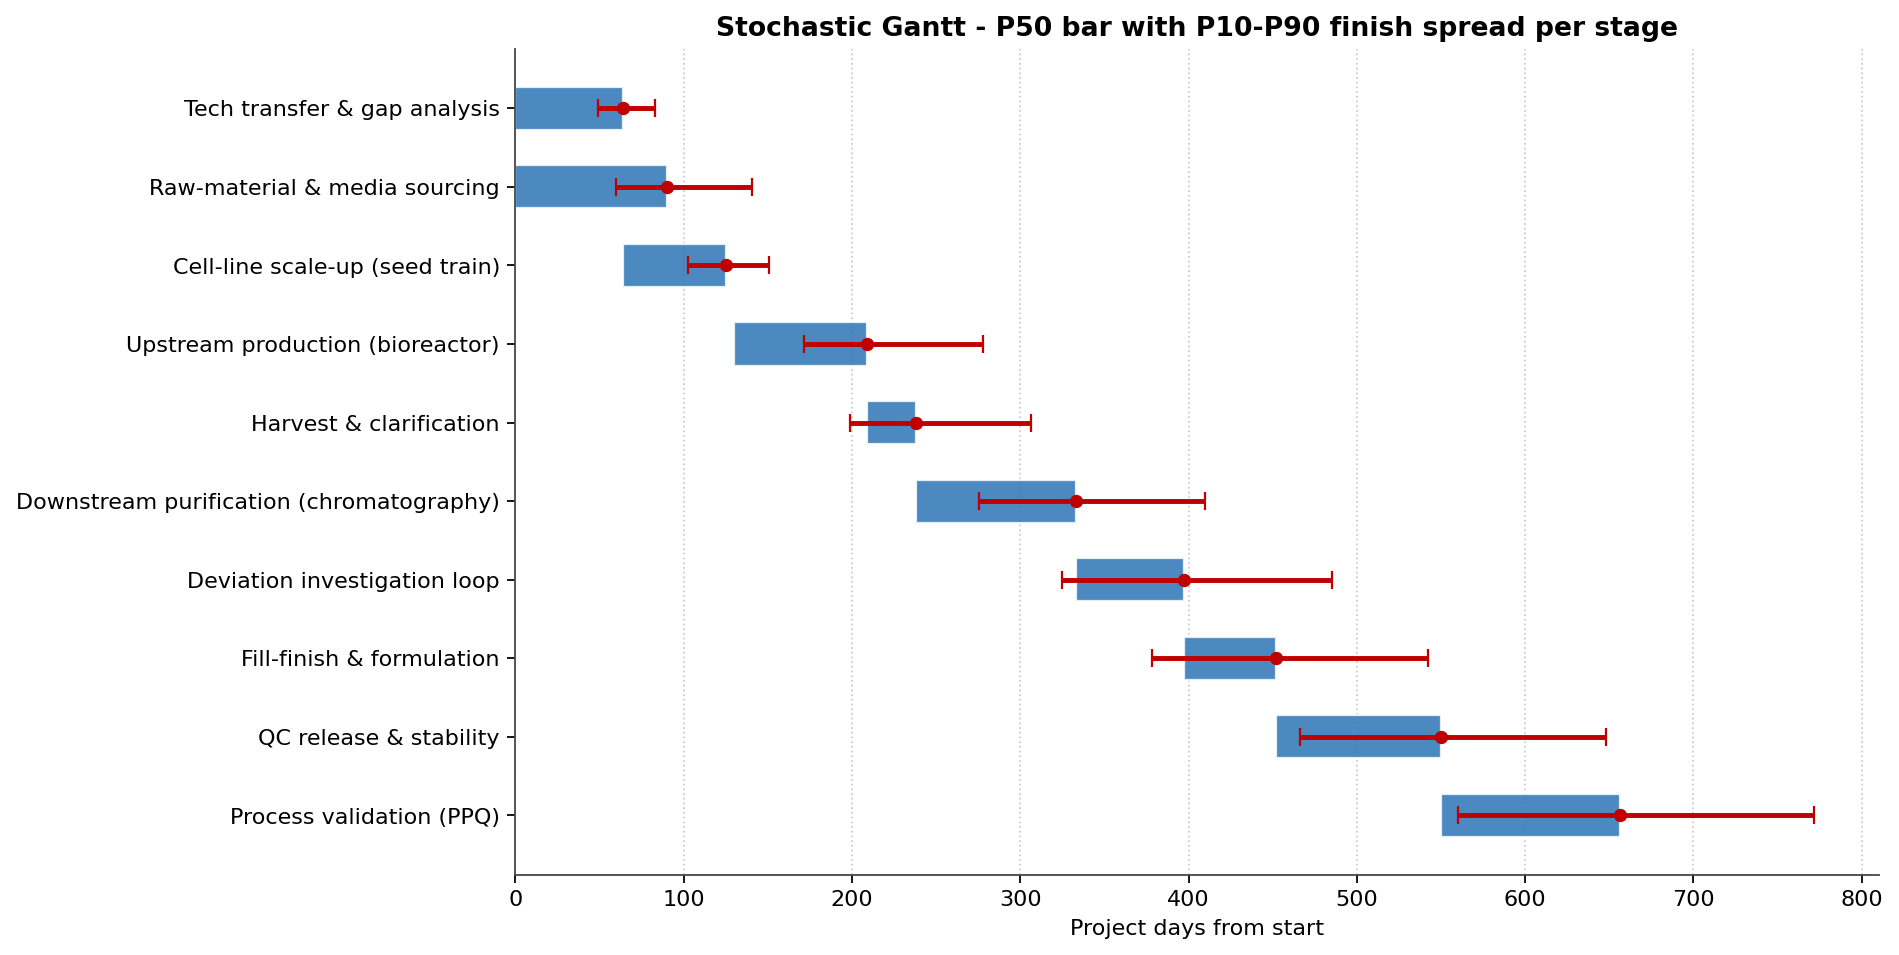
The whiskers widen downstream because uncertainty compounds along the chain: each stage inherits the spread of everything it waits on, so PPQ carries the accumulated variability of the whole campaign before it.
The discrete failures that drive the tail
Six events were modelled as Bernoulli risks — each may or may not occur, but if it does it adds delay and cost. Ranking them by expected schedule impact (probability x delay) gives a clean Pareto:
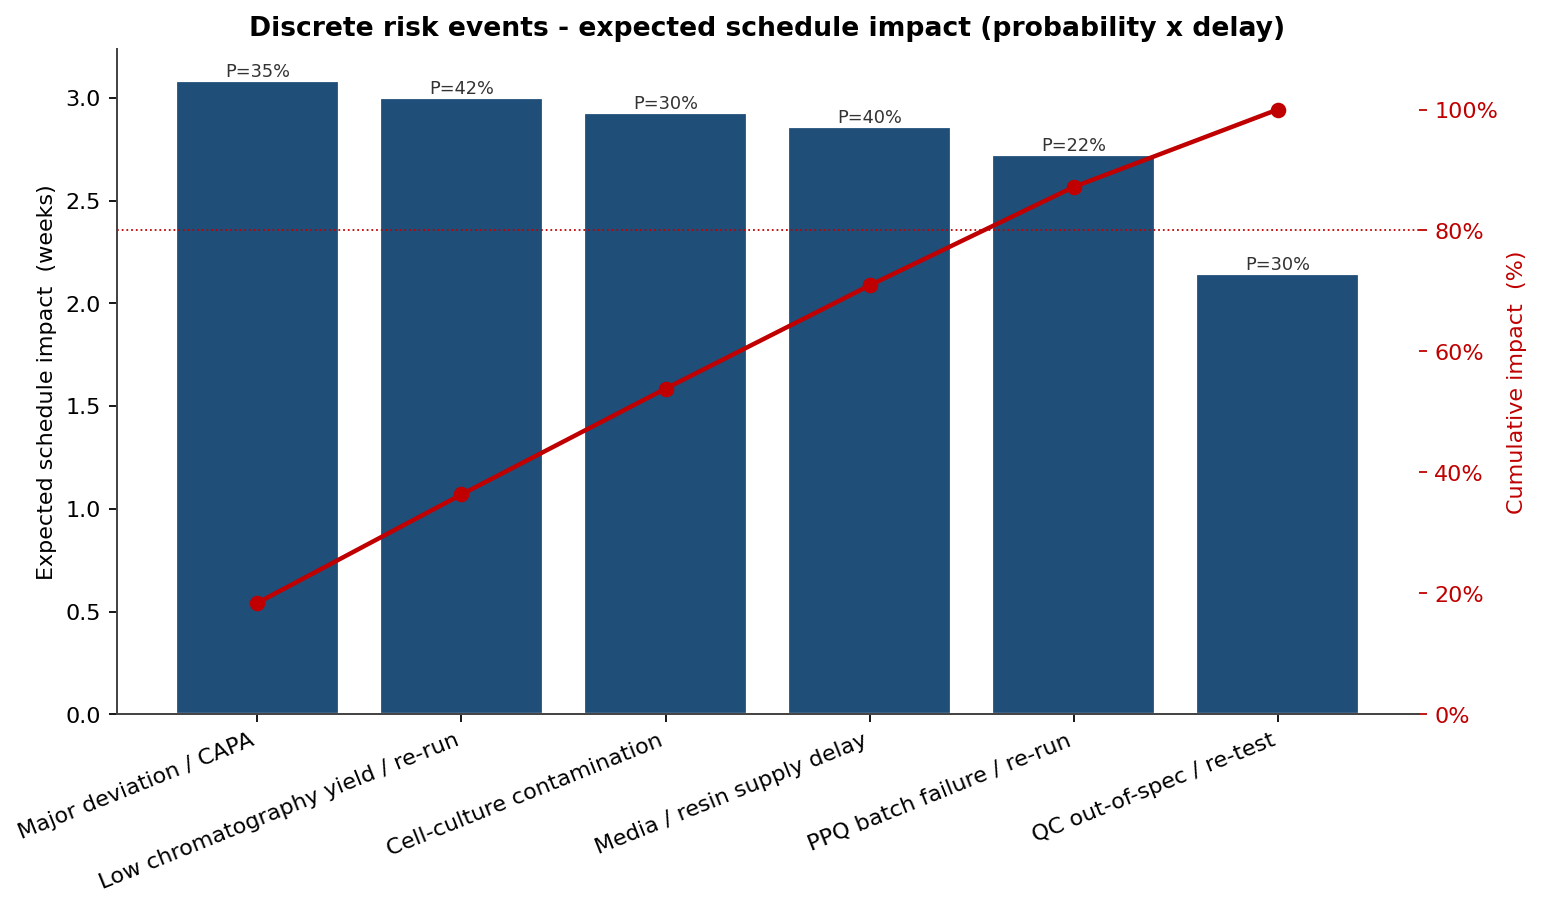
Five of the six events carry roughly 80% of the expected discrete-event delay — a major deviation / CAPA (3.1 weeks expected), low chromatography yield / re-run (3.0), cell-culture contamination (2.9), media / resin supply delay (2.9) and a PPQ batch failure / re-run (2.7). The cluster is tight, which says no single fix carries the campaign — the response has to attack several failure modes at once.
Schedule risk is cost risk
Every day the campaign runs long carries cleanroom occupancy, skilled-operator burn and held-batch carrying cost, so the schedule distribution drives the cost distribution. Tamara let the team price three mitigations together — dual-sourced media and resin with safety stock, rapid sterility and PAT monitoring that cuts the contamination and yield-failure rate, and a confirmation engineering run before PPQ — and compare before/after on the same axis:
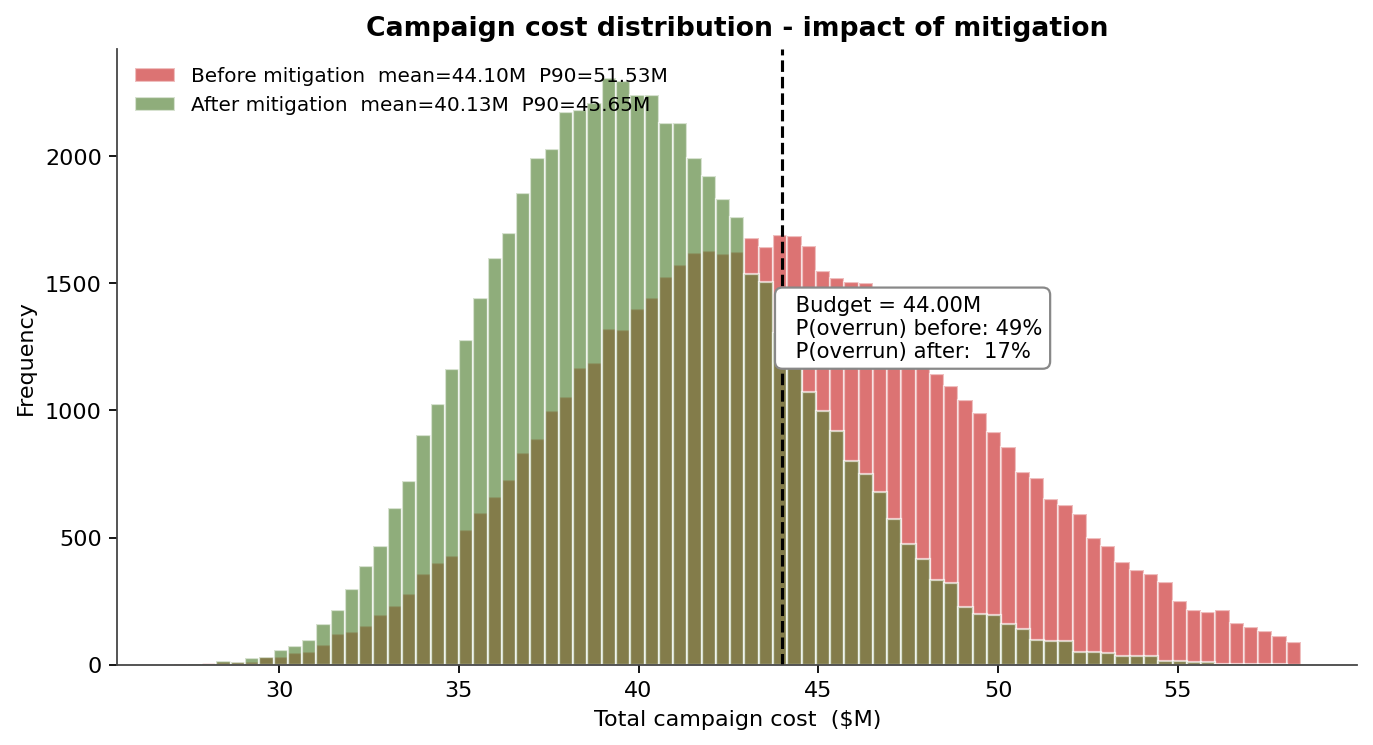
Without mitigation the cost distribution runs to a mean of $44M and a P90 of $52M, with a 49% probability of breaching the $44M budget. The $1.5M mitigation package cuts the P80 finish by 70 days (731 to 661 days), and because schedule drives cost, the overrun probability falls from 49% to 17% — the package pays for itself several times over in avoided occupancy cost, not in the line items it touches directly.
What Tamara changed
- The internal commitment moved from the deterministic September 2027 date to a risk-informed P80, ending the rolling-promise cycle with the launch and regulatory teams before it started.
- A 7.4-month schedule contingency was quantified and funded, rather than discovered one failed batch at a time.
- Risk-reduction effort was redirected to the bioreactor step and deviation handling — the highest-cruciality stages — instead of being spread evenly across the process.
- A $1.5M mitigation package was approved on its tail-clipping effect, cutting budget-overrun probability from 49% to 17%.
Tamara Functionality Used
- Monte Carlo schedule simulation over the full process network, with Beta-PERT stage durations and parallel-path logic.
- Discrete risk-event modelling (Bernoulli occurrence x Triangular impact) for contamination, yield failures and deviations, layered onto stage durations and costs.
- Criticality and cruciality analysis distinguishing how often a stage is critical from how much its variability moves the PPQ date.
- Finish-date distribution and stochastic Gantt for communicating schedule uncertainty to non-technical stakeholders.
- Integrated cost-schedule modelling linking finish-date overruns to cleanroom-occupancy cost, so mitigations are priced on their joint effect.
- Scenario comparison quantifying a mitigation package's before/after impact on both the P80 finish and the budget-overrun probability.
A biomanufacturing campaign is not a date; it is a distribution with a body the program can plan against and a tail it cannot afford to ignore. Tamara is what turns "when is PPQ done?" into a probability the program, the launch team and the regulatory function can all sign.