

Industry: Aerospace
Product: Tamara
Application: Component failure probabilities
Two Activities Carry the Whole Schedule — and Neither Is the One the Plan Flagged
A precision aero-engine program — a titanium turbine assembly built to certify against airworthiness standards — was scheduled the orthodox way: ten activities, each with a most-likely duration, chained through the network. That roll-up named a critical path and a clean November 2027 first-article delivery, and the program office took both to its airframe customer. But a deterministic critical path answers only one question — which chain is longest if every activity lands on its most-likely duration and nothing fails inspection? — and that is not the question a program needs answered before it commits de-risking budget.
The question that matters is which activities, through their own variability, actually move the delivery date — and that is a different list. Rebuild the same build-to-certify network in Tamara, Vose Software's Monte Carlo project risk tool, with Beta-PERT durations and six discrete failure-and-rework events, and plot every activity by how often it lands on the critical path (its criticality index) against how much its variability moves the finish (its cruciality). The two highest-leverage activities jump straight out of the top-right corner.
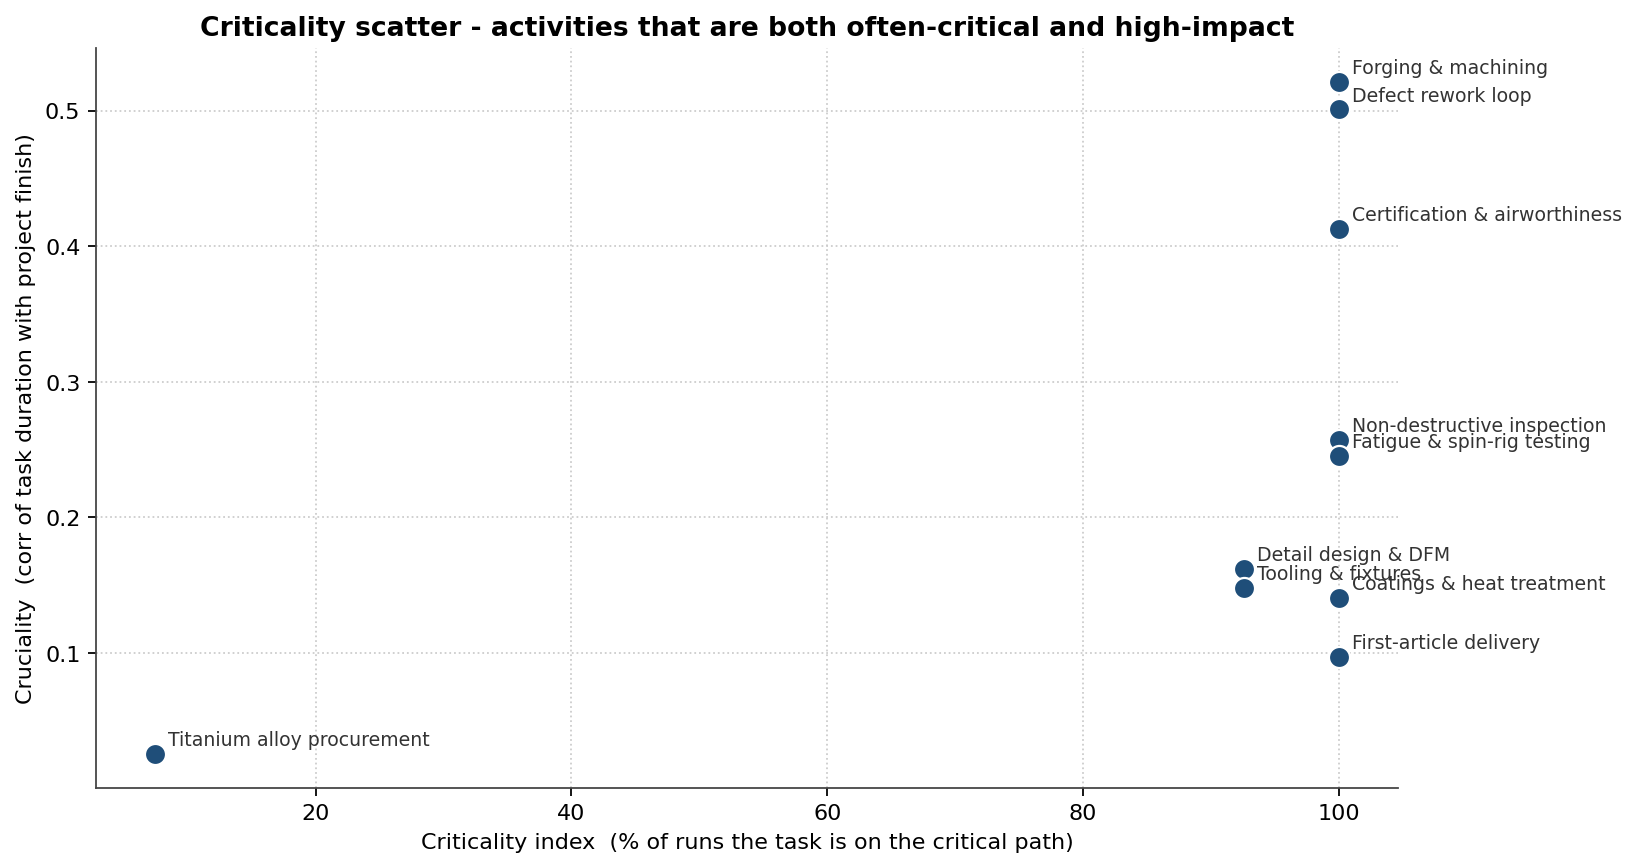
Forging and machining tops the cruciality axis at 0.52, with the defect rework loop just behind at 0.50 and certification and airworthiness at 0.41 — these are the activities whose duration uncertainty drives the delivery date. Read the horizontal axis and a second fact appears: the certify-and-deliver tail (testing → rework → certification → delivery) sits on the critical path in essentially 100% of iterations, yet most of that tail has low cruciality. Being always critical is not the same as being worth de-risking: certification and first-article delivery are on the path every time but barely move the finish, while machining — not always the longest chain — swings it the most. A bar-chart critical path conflates the two; the scatter separates them, and the action list is the upper-right cluster, not the always-critical tail.
The dates behind the ranking
Those drivers produce a finish distribution, not a date. The simulation gives P50 March 2028 and P90 July 2028, against a deterministic plan of 580 days that has only a 2% chance of being met. The mean simulated finish is 727 days, pushed past the most-likely chain by right-skewed durations and the defect-driven rework loop. The gap between the November 2027 plan and the P80 finish is 216 days — roughly 7.1 months — and that gap is the program's true, previously invisible schedule contingency.
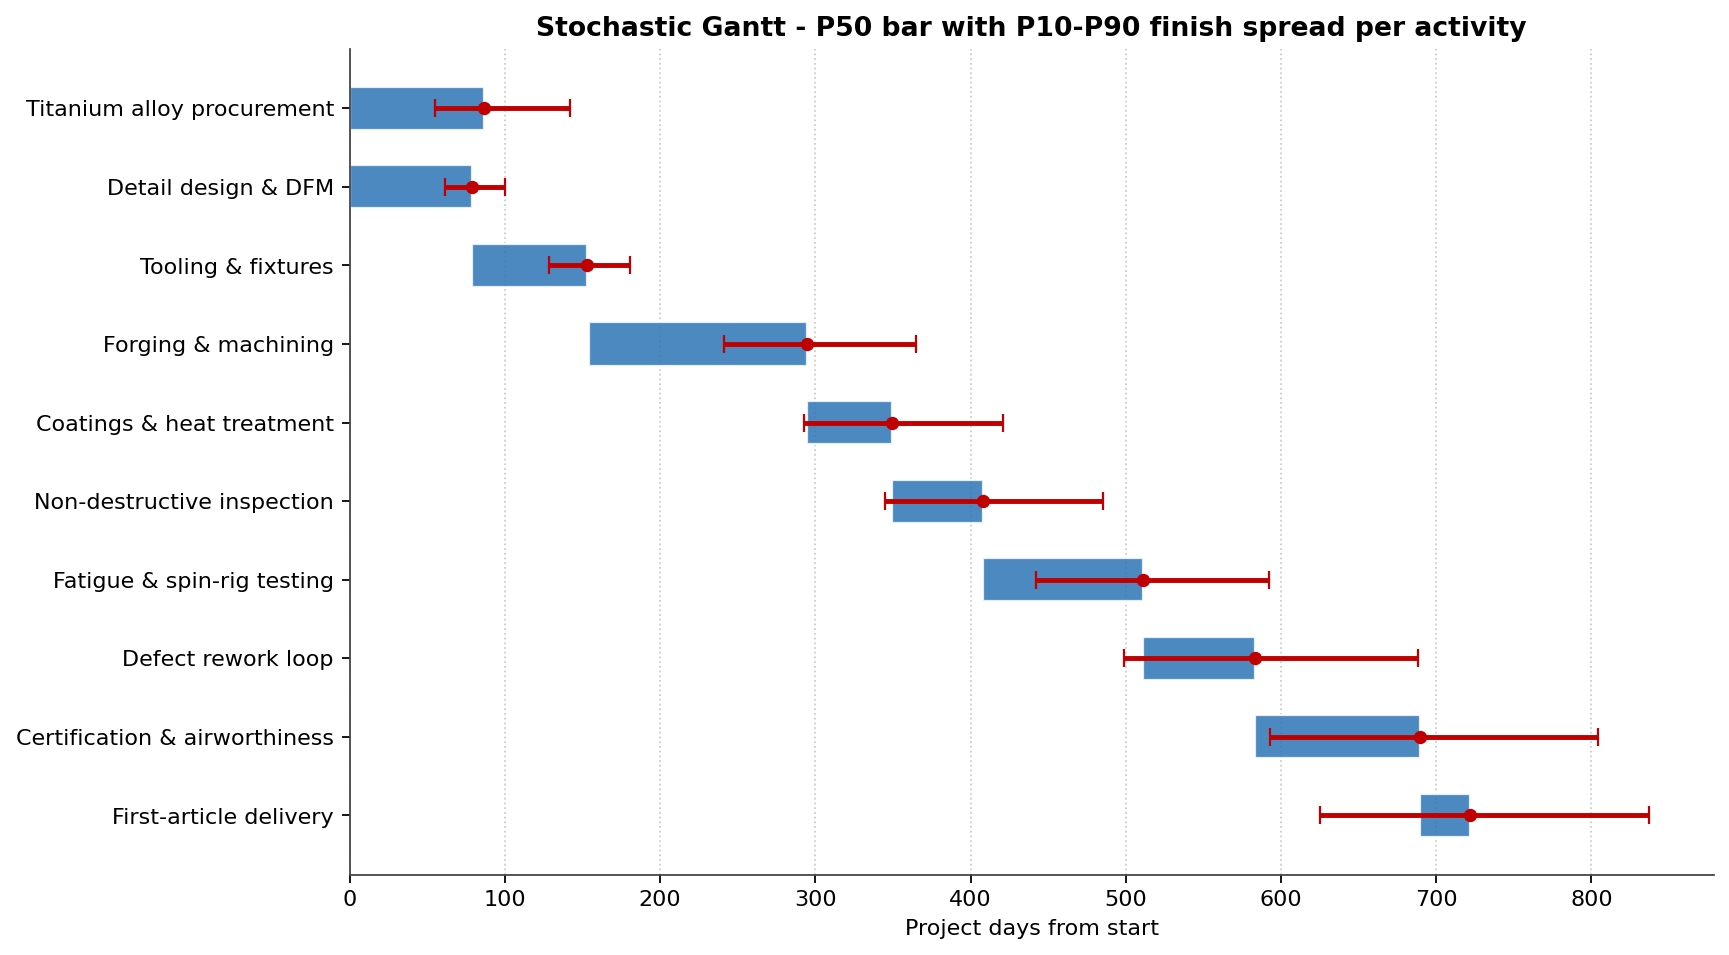
The stochastic Gantt places every activity in time as a band rather than a bar. The whiskers widen downstream because uncertainty compounds along the chain: each activity inherits the spread of everything it waits on, so first-article delivery carries the accumulated variability of all nine activities before it — which is exactly why the always-critical tail is wide but not, on its own, the driver to attack.
The discrete failures that drive the tail
Six failure events were modelled as Bernoulli risks — each may or may not occur, but if it does it adds delay and rework cost. Ranking them by expected schedule impact (probability x delay) gives a clean Pareto:
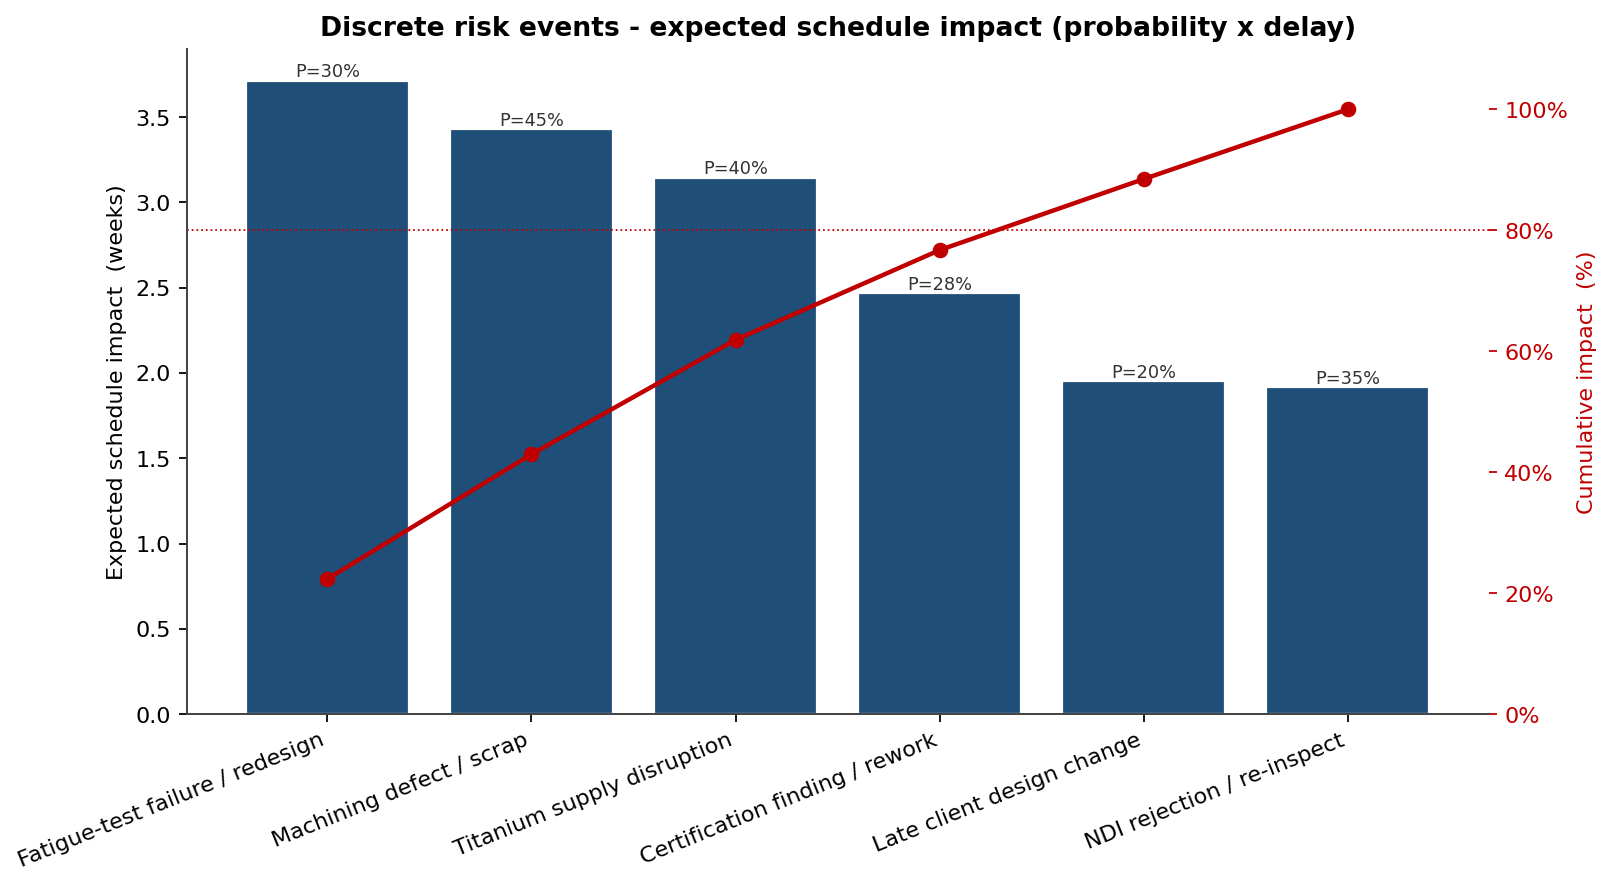
Five of the six events carry roughly 80% of the expected discrete-event delay — a fatigue-test failure / redesign (3.7 weeks expected), a machining defect / scrap (3.4), a titanium supply disruption (3.1), a certification finding (2.5) and a late client design change (2.0). The machining defect sits right alongside machining's top cruciality rank — the continuous and discrete analyses point at the same activity.
Schedule risk is cost risk
Every day beyond the deterministic plan carries extended program overhead — engineering-team burn, facility cost and material escalation — so the schedule distribution drives the cost distribution. Tamara let the team price three mitigations together — a dual-source titanium contract, in-line statistical process control on machining, and an early coupon fatigue-test program — and compare before/after on the same axis:
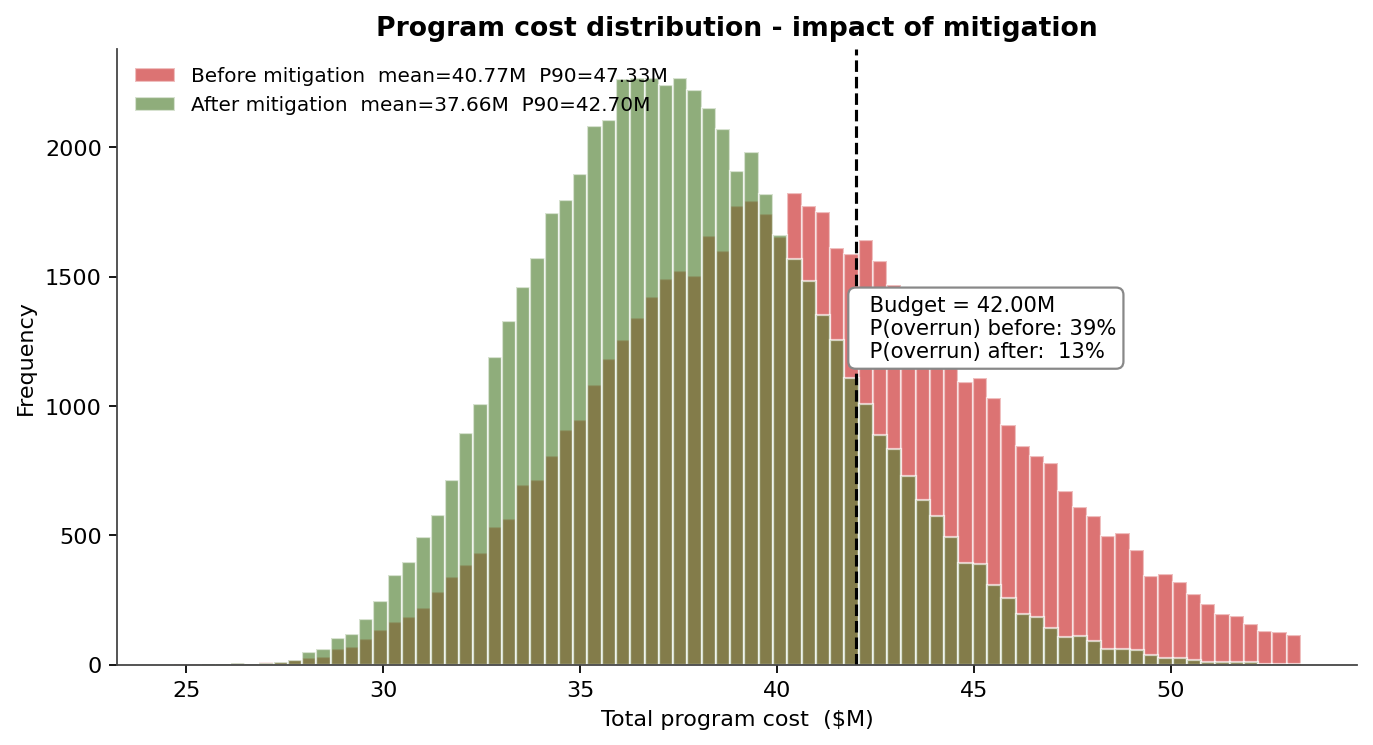
Without mitigation the cost distribution runs to a mean of $41M and a P90 of $47M, with a 39% probability of breaching the $42M budget. The $1.2M mitigation package cuts the P80 finish by 64 days (796 to 732 days), and because schedule drives cost, the overrun probability falls from 39% to 13% — the package pays for itself several times over in avoided overhead, not in the line items it touches directly.
The full finish-date distribution
Collapsing the schedule onto its delivery-date axis shows the shape the program is actually committing against:
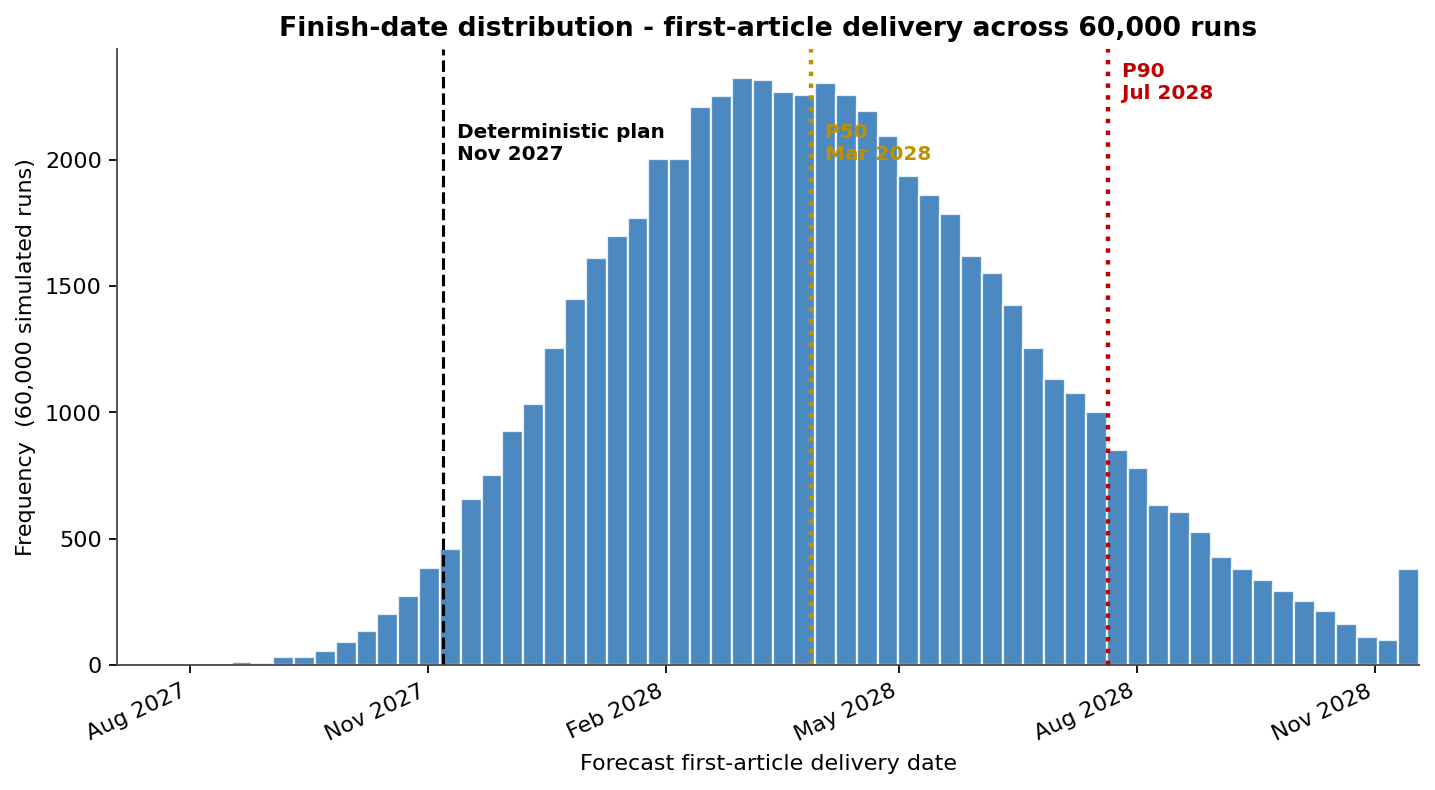
The deterministic November 2027 plan sits at the extreme left edge of the body — not a central estimate but a near-best case — with the bulk of outcomes falling between P50 March 2028 and P90 July 2028 and a long right tail beyond. The histogram is the same argument as the percentiles, made visible: a single date hides everything a program needs to plan against.
What Tamara changed
- Risk-reduction effort was redirected to machining and the defect rework loop — the two highest-cruciality activities — instead of to the always-critical certification tail the bar chart highlighted.
- The external commitment moved from the deterministic November 2027 date to a risk-informed P80, ending the rolling-promise cycle with the airframe customer before it started.
- A 7.1-month schedule contingency was quantified and funded, rather than discovered one slipped milestone at a time.
- A $1.2M mitigation package was approved on its tail-clipping effect, cutting budget-overrun probability from 39% to 13%.
Tamara Functionality Used
- Monte Carlo schedule simulation over the full activity network, with Beta-PERT durations and parallel-path logic.
- Criticality and cruciality analysis plotting how often a task is critical against how much its variability moves the delivery date, so the two are never confused.
- Discrete risk-event modelling (Bernoulli occurrence x Triangular impact) for component failures, defects and certification findings, layered onto task durations and costs.
- Stochastic Gantt and finish-date distribution for communicating schedule uncertainty to non-technical stakeholders.
- Integrated cost-schedule modelling linking finish-date overruns to extended-overhead cost, so mitigations are priced on their joint effect.
- Scenario comparison quantifying a mitigation package's before/after impact on both the P80 finish and the budget-overrun probability.
In an industry where a missed certification milestone cascades into penalties and grounded aircraft, the first question is not "when will it deliver?" but "where is the risk?" — and the answer is two activities, not the whole bar chart. Tamara is what turns a flat list of tasks into a ranked, fundable action list the program office and its customer can both sign.