

Industry: Utilities
Product: ModelRisk
Application: Renewable Integration
At 45% Renewable Share, the Worst Net-Load Ramp Beats the Procured Reserve One Year in Five
As wind and solar climbed toward 45% of energy on a 12,000 MW peak system, the operations-planning team carried two deterministic numbers into every committee: an expected curtailment of "a percent or two," and a balancing reserve of 2,800 MW sized to a single design-day ramp. Both numbers were averages, and both hid the thing the reliability standard actually cares about -- the bad year. A calm-then-blustery week curtails far more than the average, and the same weather that floods the system with surplus also produces the sharpest net-load swings. Reserve sized to the mean ramp is, by construction, inadequate half the time.
The team rebuilt the integration study in ModelRisk, simulating 40,000 stochastic operating years with a persistent per-year weather regime so that curtailment and ramp severity move together rather than averaging out. The first result was the curtailment distribution below -- and the realisation that the reserve they had procured is exceeded by the worst ramp 21% of the time.
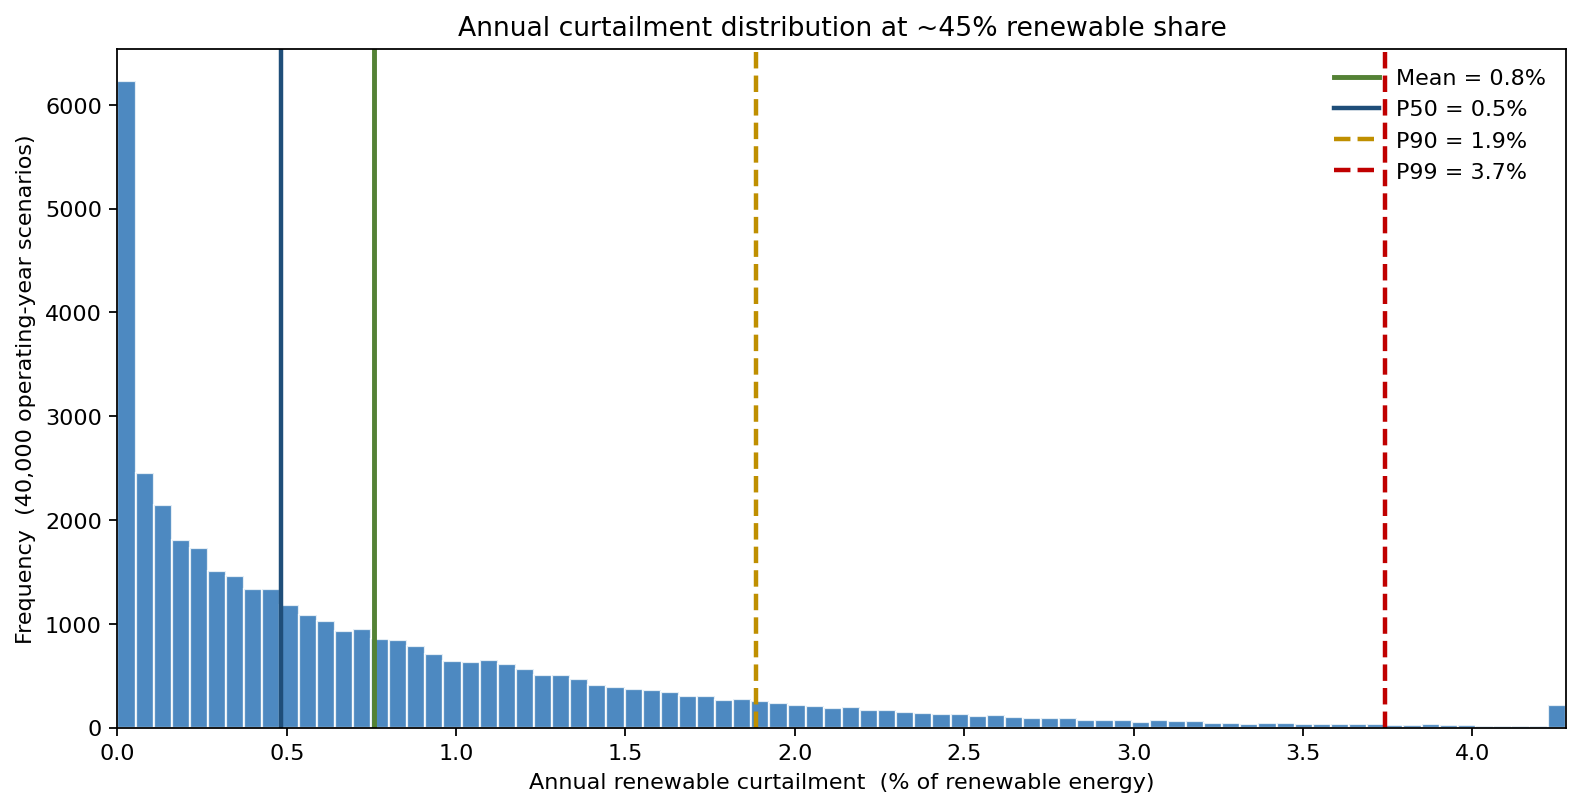
Annual curtailment runs a mean of 0.8%, but the distribution is right-skewed: P90 = 1.9% and P99 = 3.7%. The "one or two percent" planning figure describes the body, not the tail -- and the tail years, when surplus renewable energy is dumped, are exactly the years the integration budget has to survive.
Why the average ramp is the wrong basis for reserve
Balancing reserve exists to cover the unforecast part of the hour-to-hour change in net load -- the residual after the predictable diurnal sunset ramp has been scheduled. That residual is stochastic, and its worst value over a year is what determines whether the lights stay on. A deterministic study takes one design-day ramp and sizes reserve to it; it has no way to say how often the realised worst ramp beats that design value. The model instead simulates an hourly net-load path per scenario -- wind as a persistent autoregressive process so hour-to-hour changes are physical, solar with daily clearness -- removes the forecastable diurnal component, and takes the worst unforecast ramp in each operating year as the quantity reserve must cover. Crucially, a single persistent weather regime scales renewable output for the whole year, so a blustery year is blustery throughout: curtailment and ramp severity rise together instead of cancelling.
Sizing reserve against the exceedance probability
The reliability question is not "what is the design ramp?" but "what probability of exceeding our reserve are we willing to run?". Sweeping procured reserve against that exceedance probability sizes the reserve directly.
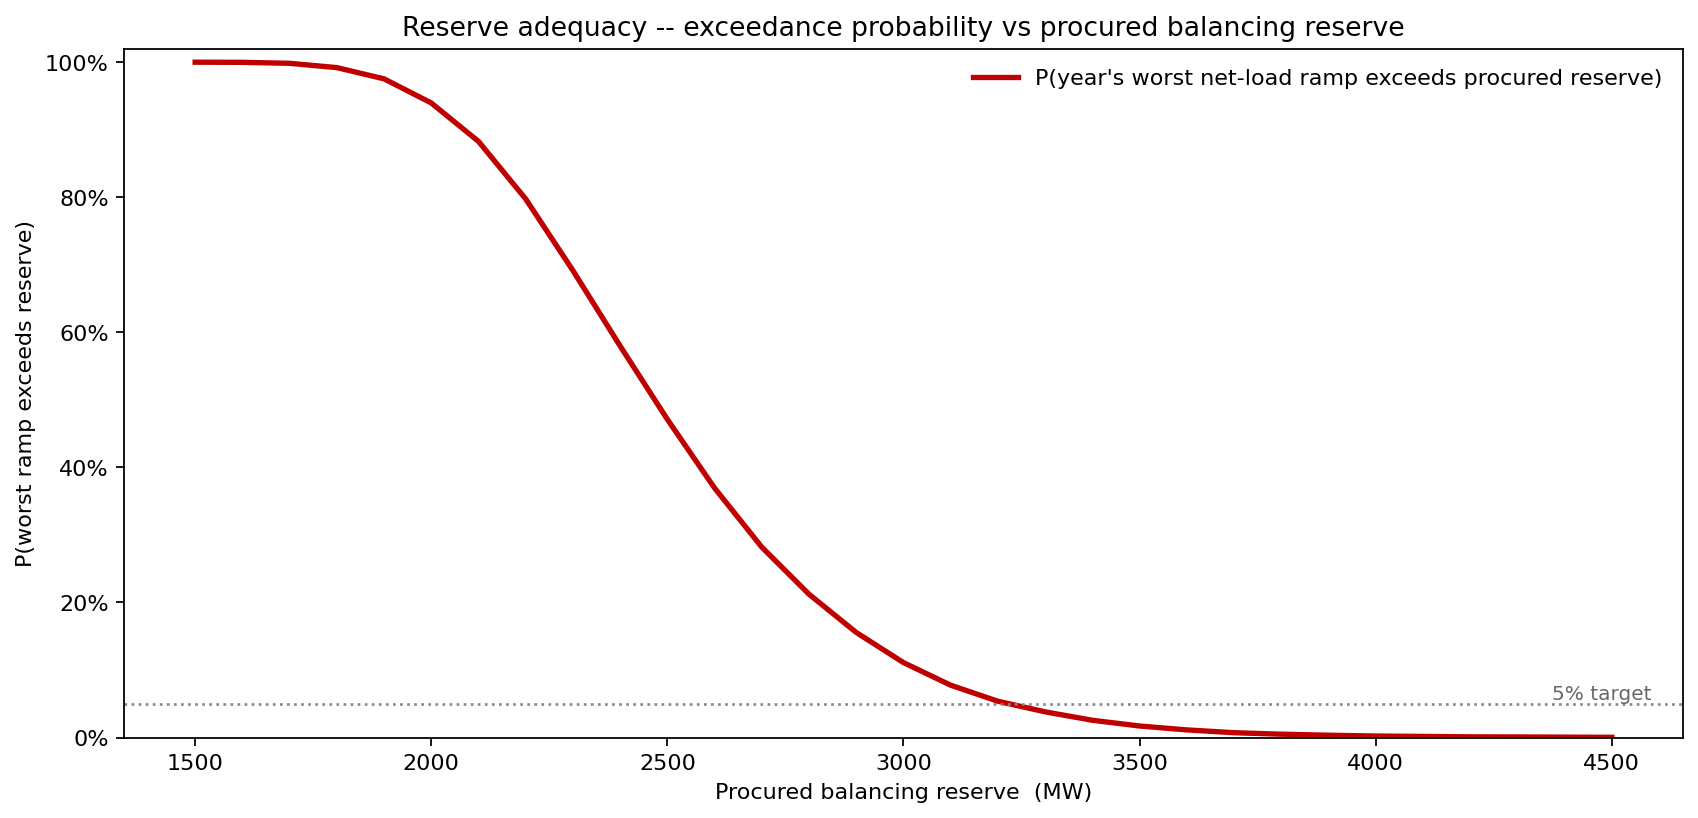
At the 2,800 MW currently procured, the worst ramp exceeds reserve in 21% of years -- a one-in-five reliability gap that the design-day method never surfaced. To hold that exceedance at or below 5%, the system needs roughly 3,300 MW of flexible balancing reserve. That 500 MW gap, priced as incremental flexibility procurement, is the concrete output the deterministic study could not produce: not "build more flexibility" but "procure about 3,300 MW to meet a 5% standard."
Curtailment and ramp severity are not independent
The most expensive assumption in deterministic integration studies is that curtailment risk and ramp risk are separate problems handled by separate budgets. They are driven by the same weather, and the joint tail is where the system actually breaks.
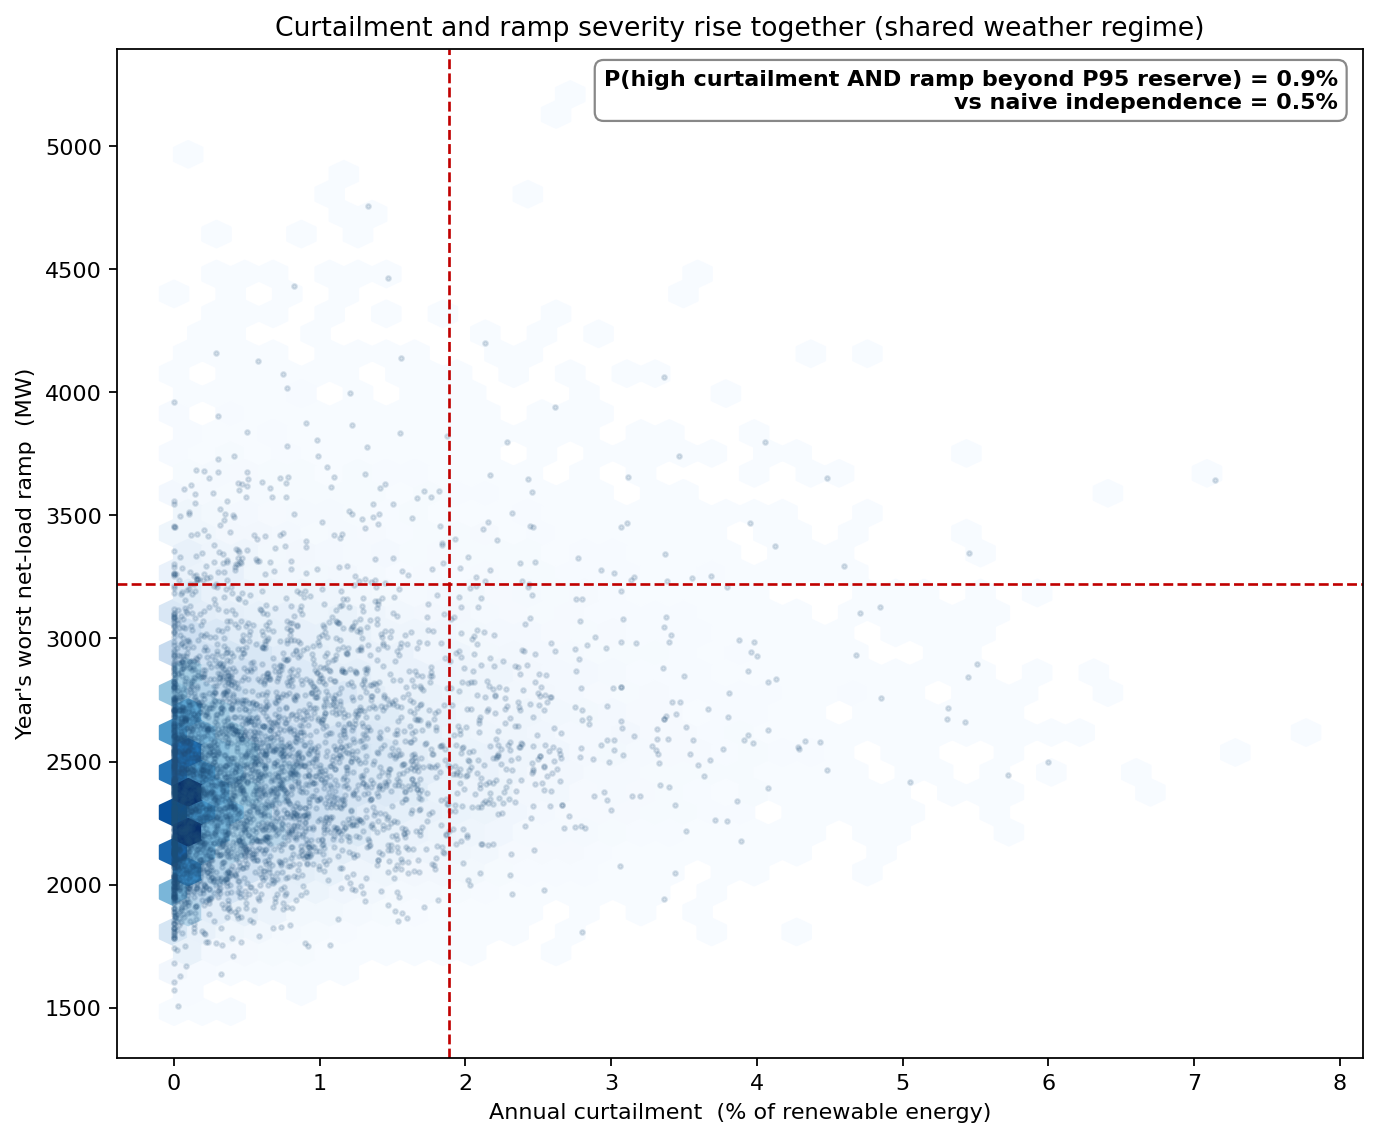
The scatter shows the dependence plainly: high-curtailment years are also high-ramp years. The probability of a year that is simultaneously above the P90 for curtailment and beyond the P95 reserve is 0.9% -- nearly double the 0.5% a naive independence assumption predicts. That near-doubling matters because it is precisely the compound bad year -- surplus energy dumped and reserve breached -- that drives both the integration cost and the reliability event. Treating the two risks as independent understates the combined tail that contingency planning has to cover.
What drives annual curtailment
With curtailment established as a material right-tail risk, the team ranked its drivers with a tornado on mean annual curtailment.
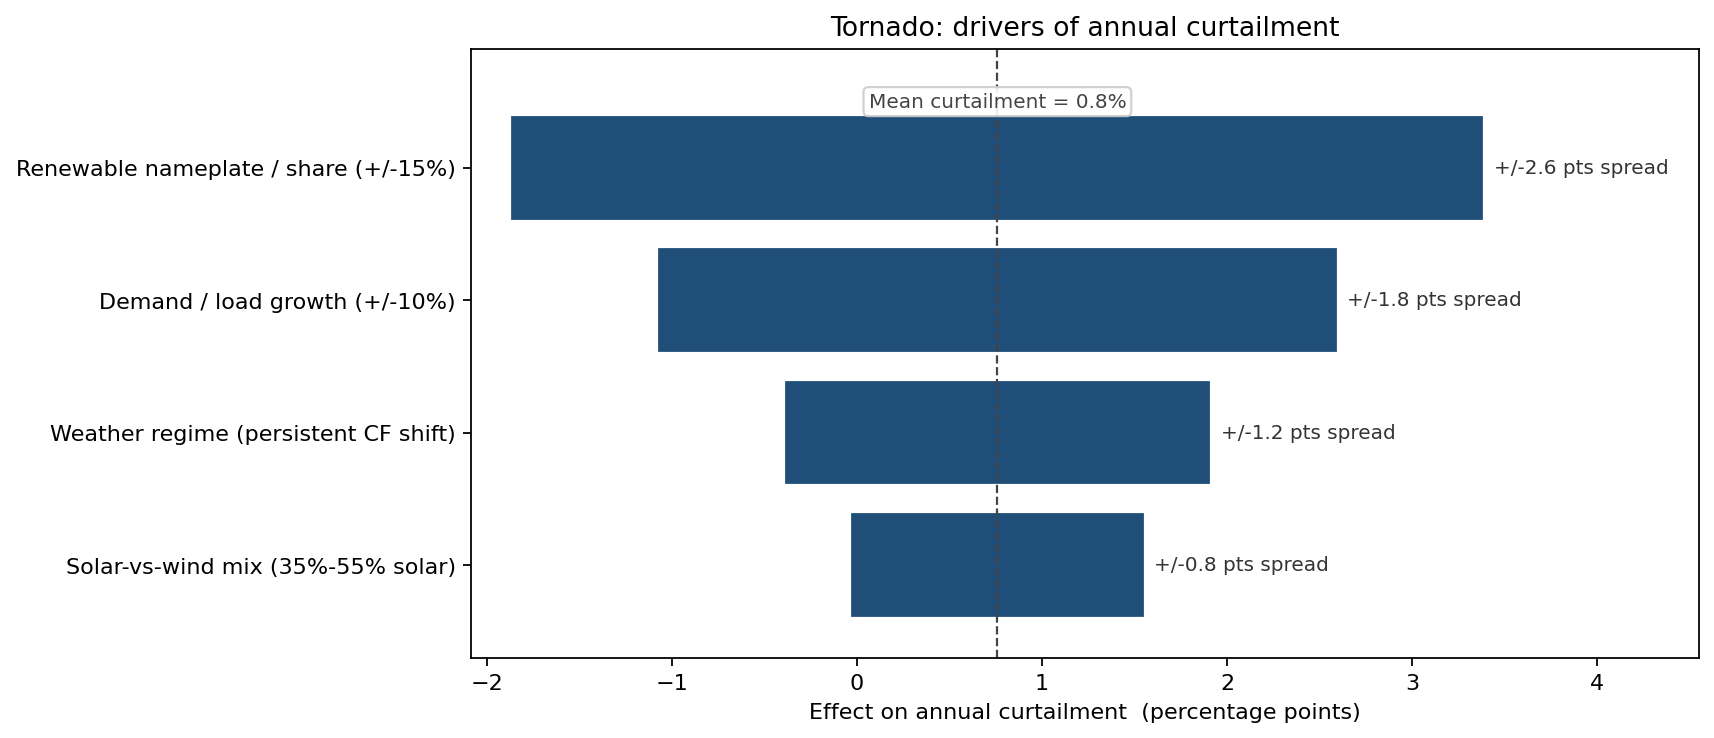
Renewable nameplate / share is the largest driver, moving mean curtailment by 2.6 percentage points across its range, followed by demand / load growth at 1.8 points and the persistent weather regime at 1.2 points; the solar-versus-wind mix matters least (0.8 points). The ranking confirms the integration intuition with numbers: every increment of renewable nameplate added without a matching increment of flexible demand or storage feeds the curtailment tail directly -- which is the economic case for pairing new build with the very reserve the sweep just sized.
What the model changed
- Flexible reserve procurement is now sized to a 5% exceedance standard (~3,300 MW) rather than a single design-day ramp, closing the one-in-five gap the deterministic method left open.
- Curtailment and ramp risk are budgeted jointly, after the model showed their compound tail is nearly twice the independence assumption.
- New renewable build is paired with flexibility commitments, following the tornado finding that nameplate share is the dominant curtailment driver.
- The reliability filing reports exceedance probabilities and the curtailment distribution, replacing the averages that understated the tail years regulators care about.
ModelRisk Functionality Used
- Monte Carlo simulation of 40,000 stochastic operating years with hourly net-load paths, wind as a persistent autoregressive process and solar with daily clearness.
- A persistent annual weather regime that scales renewable output for the whole year, so curtailment and ramp severity rise together rather than averaging away.
- A reserve-adequacy sweep reporting the exceedance probability against procured reserve, used to size flexibility to a 5% reliability standard.
- Joint-density analysis of curtailment against worst ramp, quantifying the compound tail versus a naive independence assumption.
- Tornado sensitivity on annual curtailment, ranking renewable share, demand, weather regime and generation mix.
At high renewable share, "the integration cost" and "the reserve requirement" are not single numbers -- they are distributions with correlated tails. Sizing reserve to the average ramp leaves a one-in-five gap; sizing it to the exceedance probability, and budgeting curtailment and ramp risk as the joint problem they physically are, is what keeps a 45%-renewable system reliable.