

Industry: Utilities
Product: ModelRisk
Application: Renewable energy storage optimization under uncertainty
A 100 MW / 400 MWh Utility Battery That Looks NPV-Positive Has a 43% Chance of Losing Money
A utility weighing a 100 MW / 400 MWh battery at a wind-rich network node ran the numbers the usual way: a single arbitrage spread, a single capacity-payment assumption, a single capex figure, discounted at the 7% regulated WACC. The spreadsheet returned a positive 20-year NPV, and the project cleared the investment committee's hurdle. What the spreadsheet could not show was that the same asset, valued across the range of outcomes its own inputs admit, has a 43% probability of finishing under water.
The team rebuilt the business case in ModelRisk, stacking the battery's three revenue streams -- energy arbitrage, capacity payments, and soaking up otherwise-curtailed renewable energy -- each as a distribution rather than a point, with a persistent market regime tying spreads and curtailment volumes together over the asset's life. The headline output is the NPV distribution below, and it reframes the decision from "is the NPV positive?" to "how much downside are we accepting, and which revenue stream is carrying the case?".
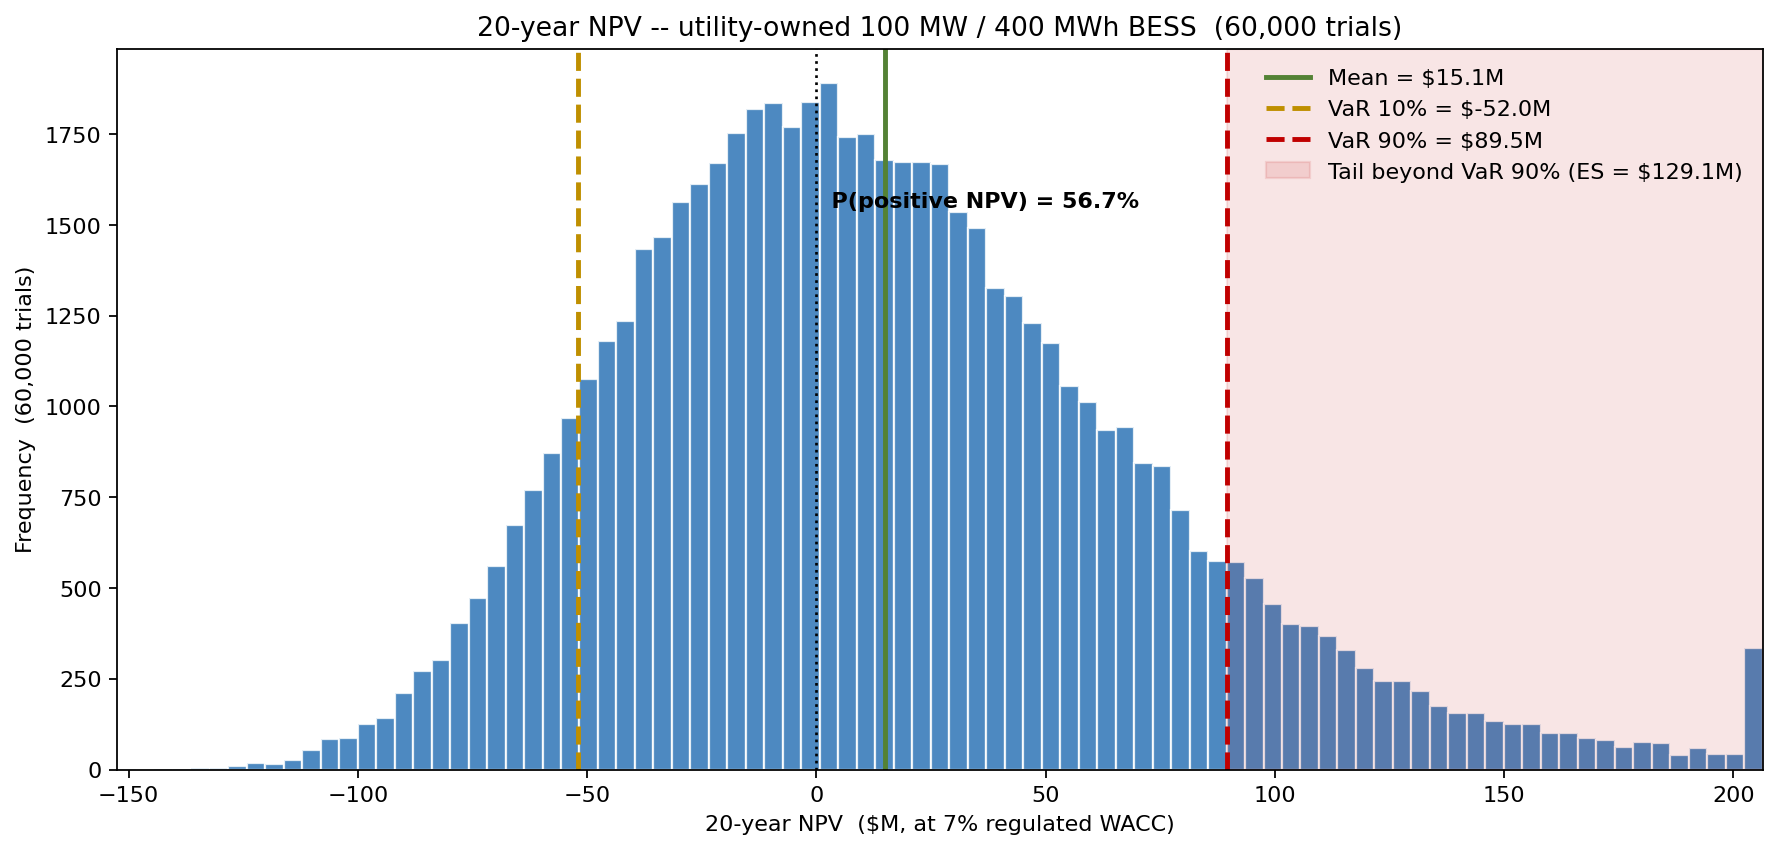
The simulation puts the mean 20-year NPV at +$15M and the median at +$9M -- nominally hurdle-clearing -- but with P10 = -$52M and P90 = +$89M, and only a 57% probability the NPV is positive. The deterministic case sat comfortably in the black; the distribution shows that comfort is a coin-flip with a heavy left tail.
Why a single NPV is the wrong number
A battery's value is the sum of revenue streams that are each volatile and, crucially, correlated through the same driver. Energy-arbitrage revenue depends on the day-ahead-to-real-time price spread, which widens as renewable penetration grows. Curtailment-soak value depends on how much surplus renewable energy there is to absorb -- which also grows with penetration. A deterministic model assigns one spread, one curtailment volume, one capex, and so reports one NPV with no sense of how often the asset disappoints. Worse, it implicitly treats the revenue streams as independent point values, when in reality a persistent market regime -- the pace of renewable build-out -- drives the arbitrage spread and the curtailment volume together across all 20 years. The model carries that regime as a single multiplier per trial, which is why the 20-year NPV keeps a wide spread instead of averaging its annual noise to a tidy point.
Value stacking is what makes the case bankable
The investment only clears because three revenue streams stack. Stripping them away one at a time shows how much each contributes -- and how marginal the battery is on arbitrage alone.
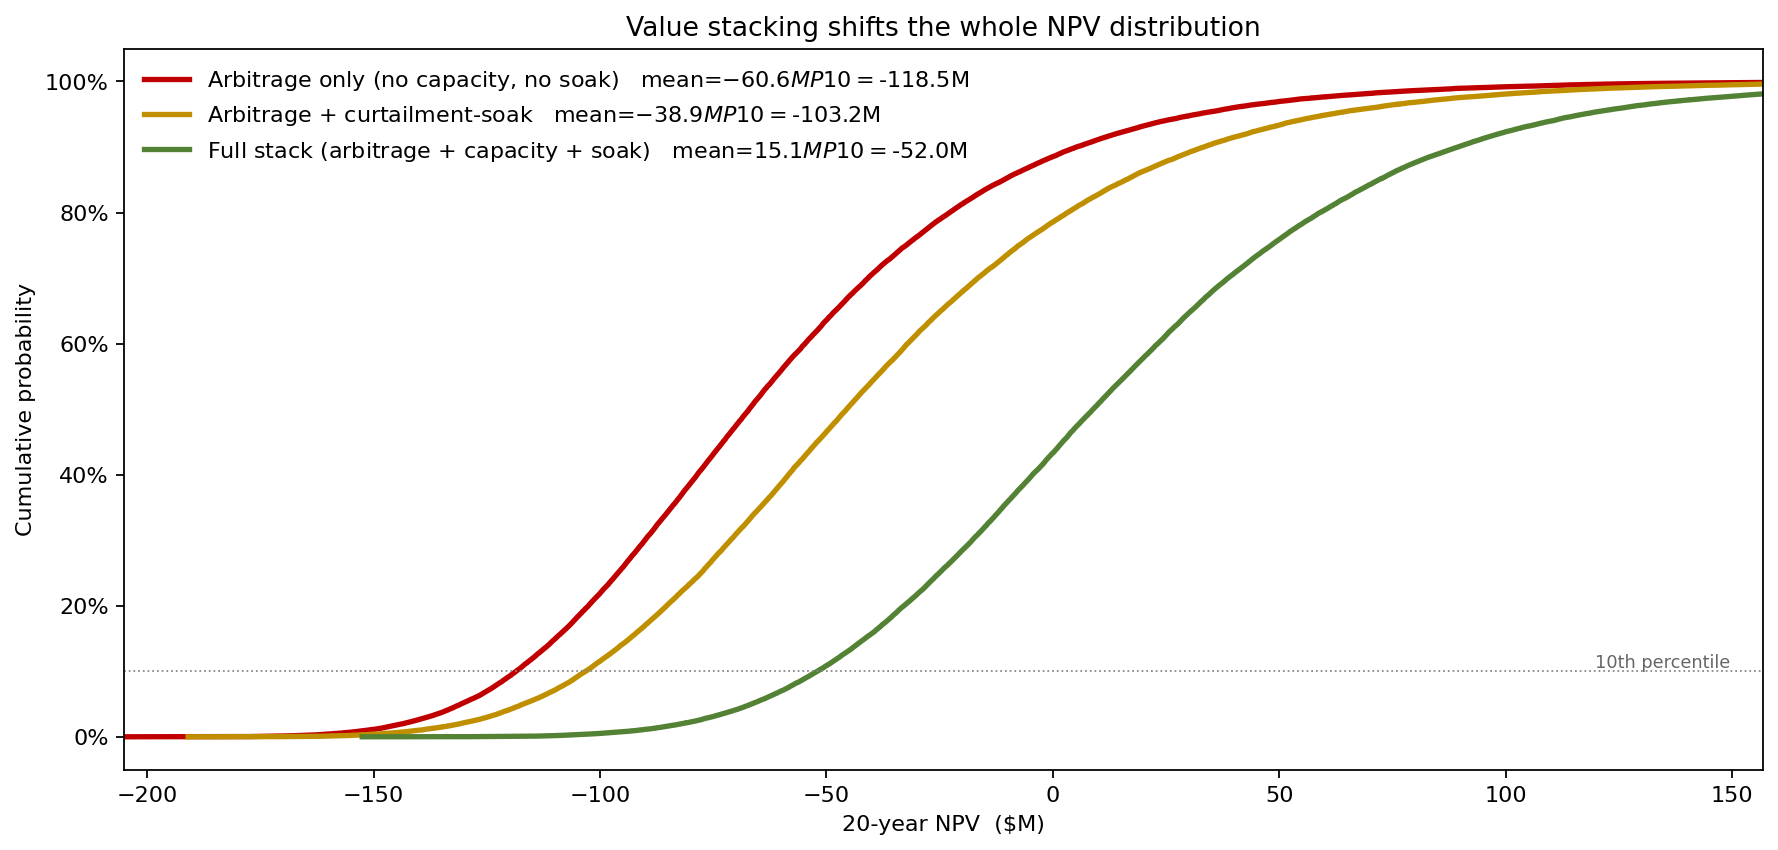
On energy arbitrage alone, the battery clears its hurdle only 11% of the time. Adding curtailment-soak revenue lifts that to 21%. It is the capacity payment that carries the case to a 57% probability of positive NPV -- the full stack. The lesson the CDF makes unmissable is that the battery is not an arbitrage play with some extras; it is a capacity asset whose arbitrage and soak revenues are the upside, and a business case that ignores any one stream is not marginal, it is negative.
How sensitive is the case to the discount rate?
Because the asset is regulated, the hurdle rate is itself a policy variable, and the committee wanted to know how fragile the case is to it. Sweeping the discount rate gives the probability of a positive NPV at each hurdle.
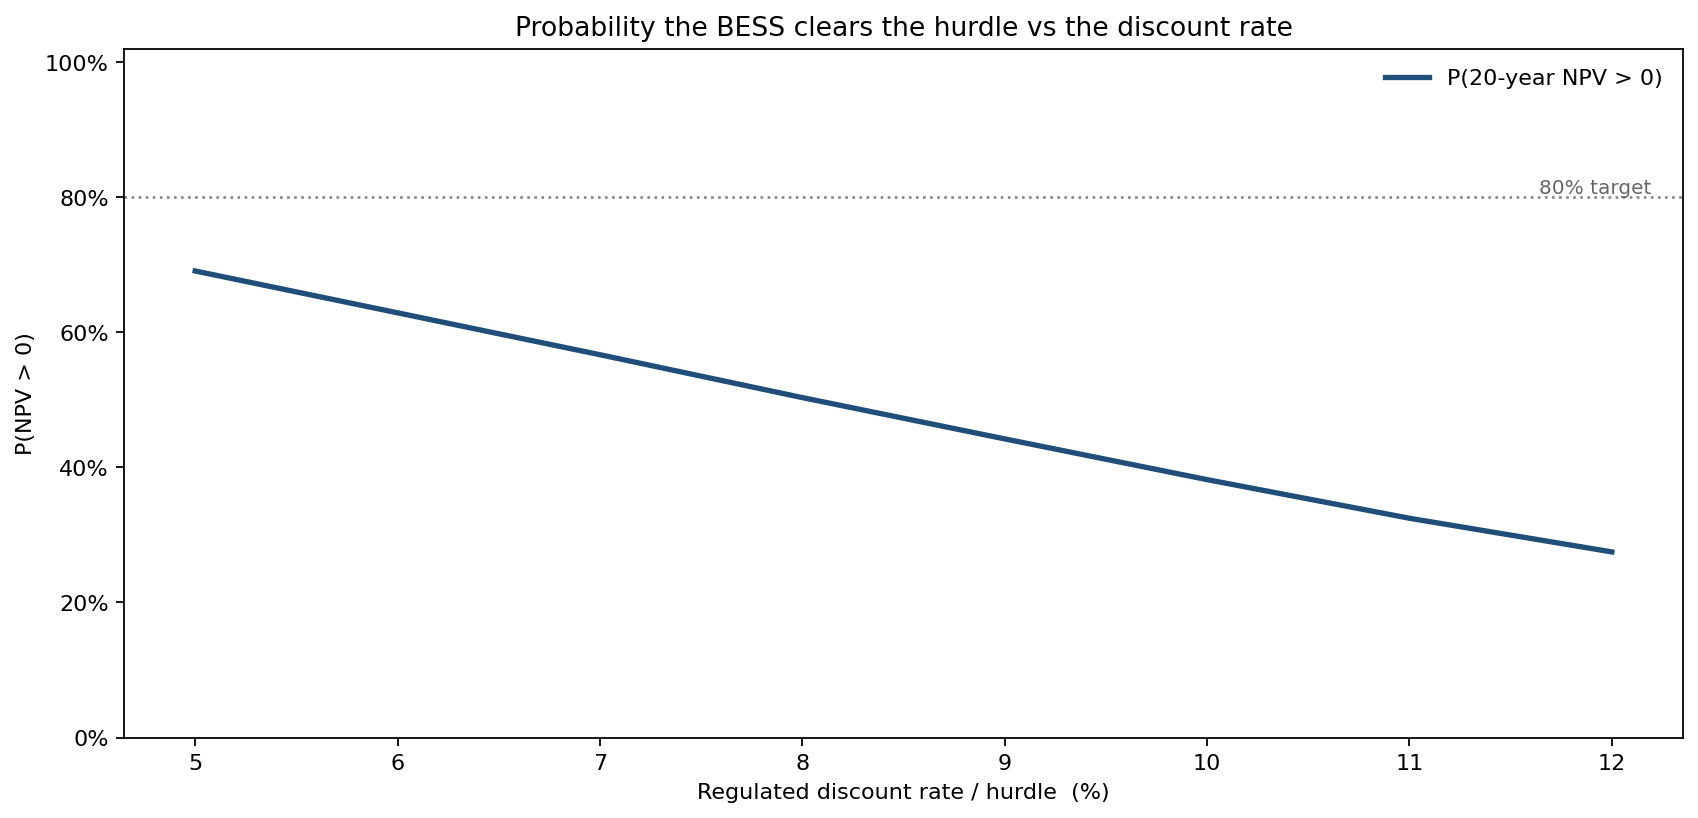
At the 7% WACC the probability of clearing is 57%; raise the hurdle to 12% and it falls to 27%. The probability never reaches 80% within any plausible regulated rate -- this is a genuinely marginal asset, not a safe one whose risk is an artefact of a conservative discount rate. The sweep also tells the regulator exactly how much the allowed return matters to the build decision.
What actually drives the NPV
Knowing the case is marginal, the team needed to know where the downside comes from. The tornado ranks the one-at-a-time P10-to-P90 swing of each input on the 20-year NPV.
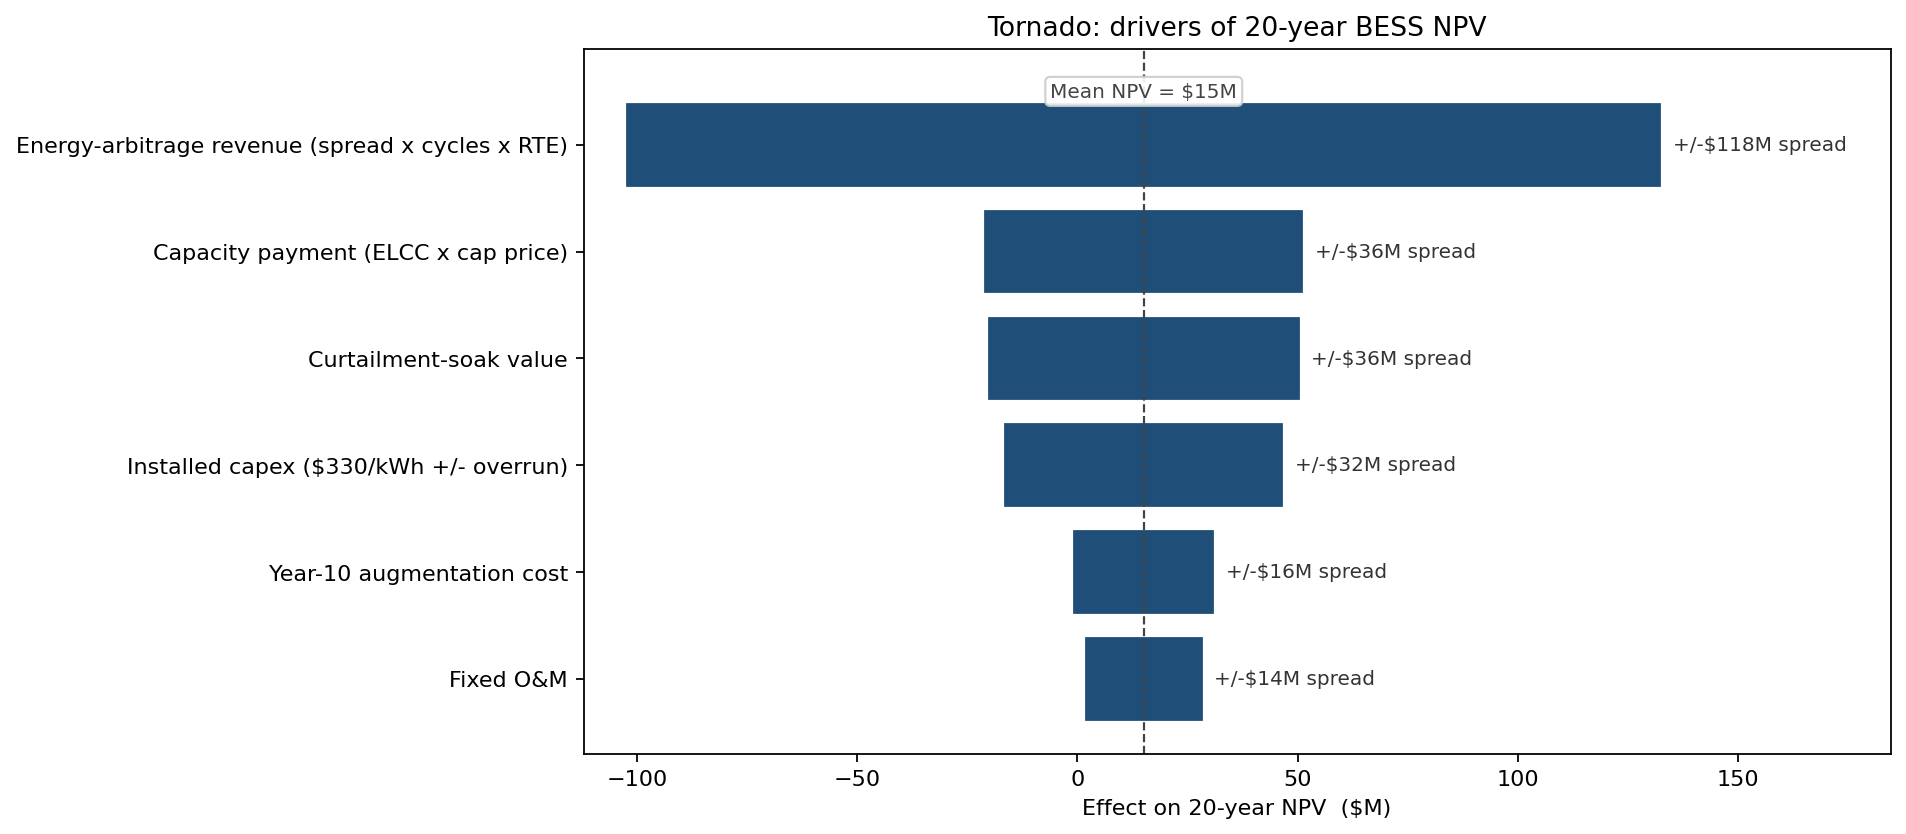
Energy-arbitrage revenue dominates, swinging NPV by about $118M across its range -- more than capacity payments ($36M) and curtailment-soak ($36M) combined, and far more than installed capex ($32M). The downside is overwhelmingly a price-spread story. That redirected risk management away from squeezing the EPC contract and toward hedging the arbitrage revenue: a multi-year tolling or revenue-floor arrangement on a slice of the throughput removes most of the left tail that the capex contingency never could.
What the model changed
- The build was reshaped from a single 100 MW / 400 MWh go decision into a phased commitment with a revenue floor on part of the throughput, cutting the 43% loss probability the deterministic case had hidden.
- The business case is now presented as a value stack, making explicit that capacity payments -- not arbitrage -- carry the asset across the hurdle.
- Risk-mitigation effort moved from capex control to arbitrage-revenue hedging, following the tornado: the price spread swings NPV nearly four times harder than capex.
- The regulatory filing reports the full NPV distribution and the 57% clearing probability, rather than the single positive NPV that overstated the asset's safety.
ModelRisk Functionality Used
- Monte Carlo simulation of a 20-year stacked-revenue NPV across 60,000 trials, combining arbitrage, capacity and curtailment-soak streams with degradation and a mid-life augmentation cost.
- A persistent market-regime factor linking arbitrage spread and curtailment volume across the asset's life, so the NPV retains its true spread.
- Scenario CDFs decomposing the value stack, showing the probability of a positive NPV under arbitrage-only, arbitrage-plus-soak, and the full stack on a common sample.
- A discount-rate sweep reporting the probability of clearing the hurdle across the plausible range of regulated WACC.
- Tornado sensitivity on the 20-year NPV, ranking arbitrage, capacity, soak, capex, augmentation and O&M by their effect on the result.
For a utility-owned battery, "the NPV" is not the answer -- it is a 57%/43% split with a heavy left tail, carried across the line by a capacity payment that a single-point model never has to defend. Sizing the hedge and the phasing on that distribution is the difference between a bankable asset and a stranded one.