

Industry: Utilities
Product: ModelRisk
Application: Power plant outages
An 11% Reserve Margin on Paper Becomes a 14% Chance of Losing Load Once the Heat Wave Trips Units Together
A utility operating a 24-unit thermal and combined-cycle fleet — 11,420 MW of nameplate capacity against a planning peak of about 9,550 MW — checks adequacy the way most fleets do: take installed capacity, knock off the fleet's average forced-outage rate (about 7%), and compare what's left to peak demand. That arithmetic leaves roughly 1,070 MW of reserve, an 11% margin. The static "no-outage" reserve is 19.6%. Both numbers say the same thing: there is headroom, the lights stay on.
The arithmetic quietly assumes two things that are false on the days that matter. It assumes each unit fails independently at its long-run average rate, and it assumes demand is fixed at the planning peak. In reality a peak-season heat wave does both at once: it drives air-conditioning demand up while simultaneously raising forced-outage and ambient-derate risk across every thermal unit through cooling-water limits and high inlet temperatures. Generation shortfalls and demand spikes are positively correlated through the same weather. Simulate 100,000 peak hours in ModelRisk with that common-cause heat factor in place and the mean reserve margin is 10%, but the P10 is −2.6% and the P1 is −15.5% — and the probability of loss of load (available generation below demand) is 14.4%. The 11% paper margin is not wrong as an average; it is irrelevant to the tail that actually causes a shortfall.
Why a point estimate fails here
- Forced outages are not independent on peak days. The deterministic derate applies each unit's average EFOR as if units fail on unrelated schedules. A heat wave is a common cause: it pushes many units toward outage at the same time, so the effective loss of capacity in a stress hour is far larger than the sum-of-averages implies.
- Demand and supply move together, the wrong way. The same heat that raises trip risk raises load. Modelling demand as a fixed peak and capacity as an independent draw lets the two cancel out statistically; modelling the shared heat factor makes them spike in lockstep, which is precisely the loss-of-load mechanism.
- Adequacy lives in the tail, not the mean. A 10% mean reserve is comfortable; the question a planner must answer is how often the margin goes negative, and by how much. That is a percentile question a point estimate cannot answer.
In ModelRisk each unit is an explicit Bernoulli forced-outage draw per peak hour at its NERC-class EFOR (nuclear ~2%, coal ~9%, combined-cycle ~5.5%, simple-cycle ~11%), with the outage probability and an ambient derate both inflated by a shared Gamma heat factor that also scales demand.
The reserve-margin distribution
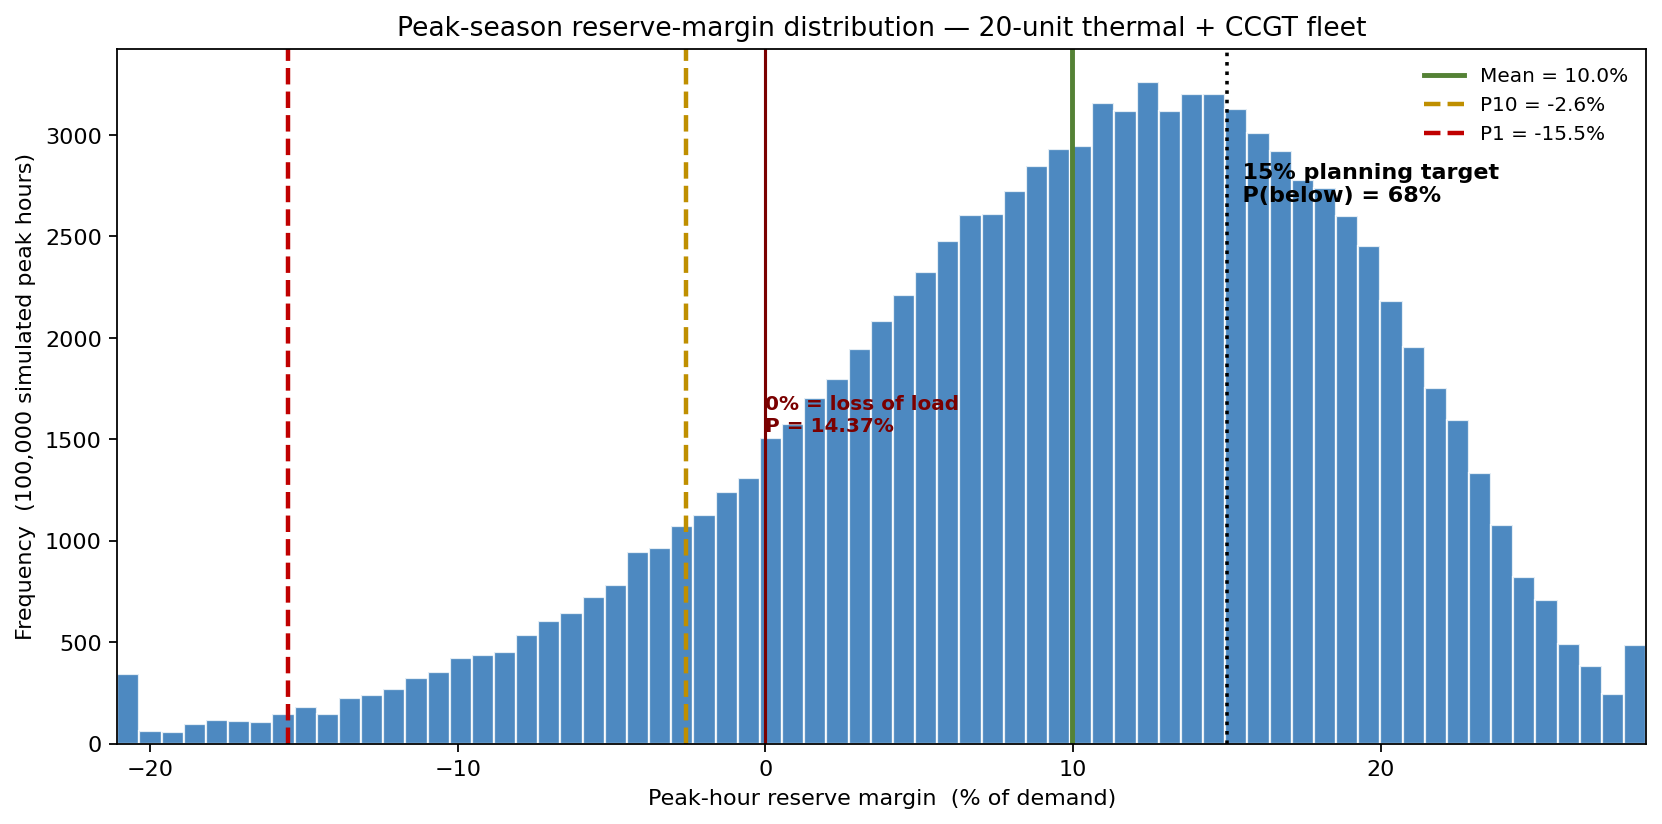
The headline chart is the distribution of peak-hour reserve margin across 100,000 simulated stress hours. The mean is 10% and the median 11% — consistent with the deterministic reading — but the left tail crosses zero. The P10 is −2.6% and the P1 is −15.5%: in the worst 1% of peak hours the fleet is short by more than 15% of demand. Against the 15% planning target, the margin falls short 67.6% of the time, and the probability of outright loss of load is 14.4%. The deterministic 11% figure sits comfortably in the body of this distribution while saying nothing about the negative tail that is the entire reason adequacy is studied.
What drives the shortfall risk
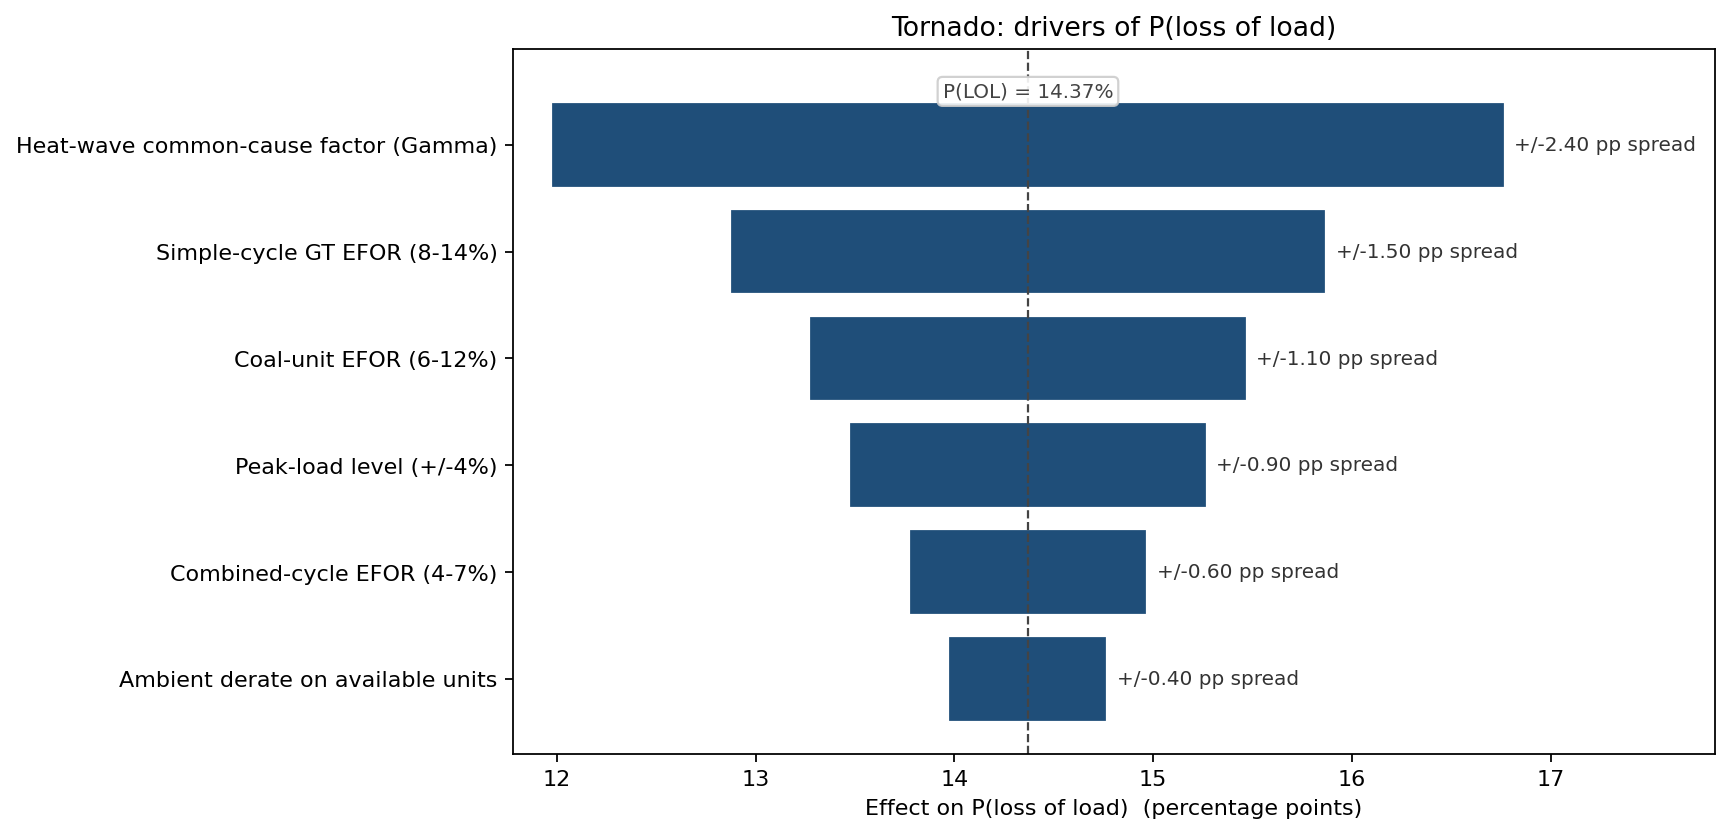
The tornado ranks inputs by their effect on P(loss of load), in percentage points. The heat-wave common-cause factor is the largest driver (≈ ±2.4 pp), confirming that the weather correlation — not any single unit's reliability — owns the tail. Simple-cycle and coal EFOR follow (≈ ±1.5 and ±1.1 pp), then the peak-load level. The input the deterministic study handled worst — the assumption that units fail independently of weather and of each other — is the single biggest contributor to the risk it failed to show.
Where the unavailable capacity concentrates
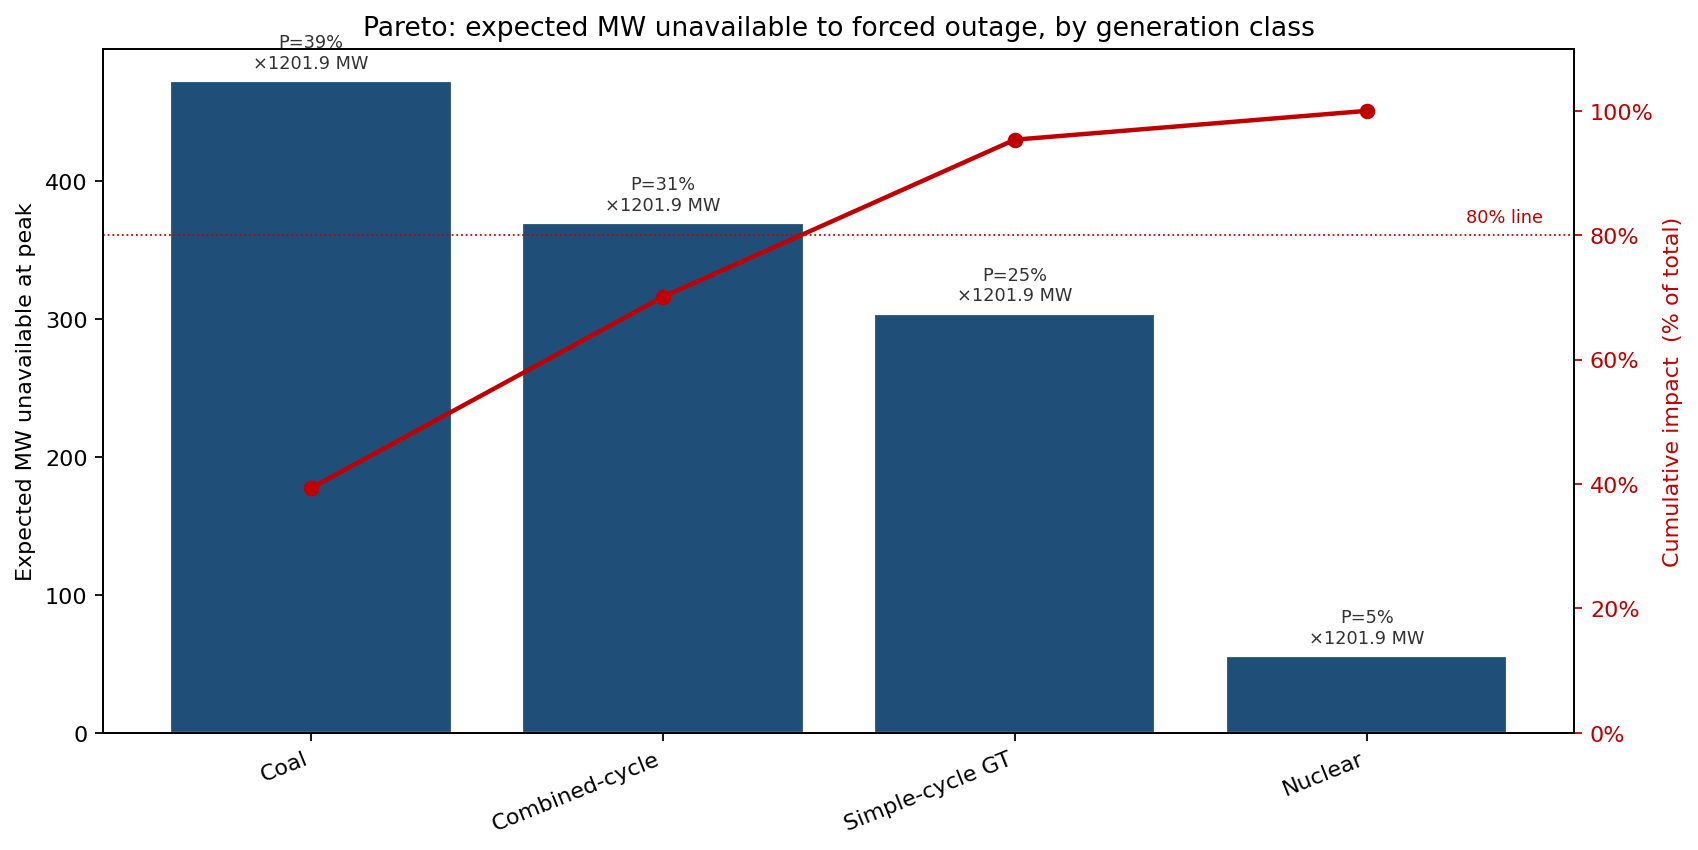
Decomposing the expected forced-outage MW by class shows where availability risk pools. Coal carries the most (≈ 473 MW expected unavailable, 39% of the total), followed by combined-cycle (≈ 370 MW, 31%) and simple-cycle GT (≈ 304 MW, 25%); nuclear contributes only about 5%. Coal's combination of a high EFOR and large unit size makes it the dominant single source of stress-hour capacity loss, which is where firming or replacement capacity earns the most reliability per dollar.
What the model changed
The team swept the amount of additional firm capacity — a new peaker block or a firm import contract — and read the reliability curves directly off the same simulated heat draws:
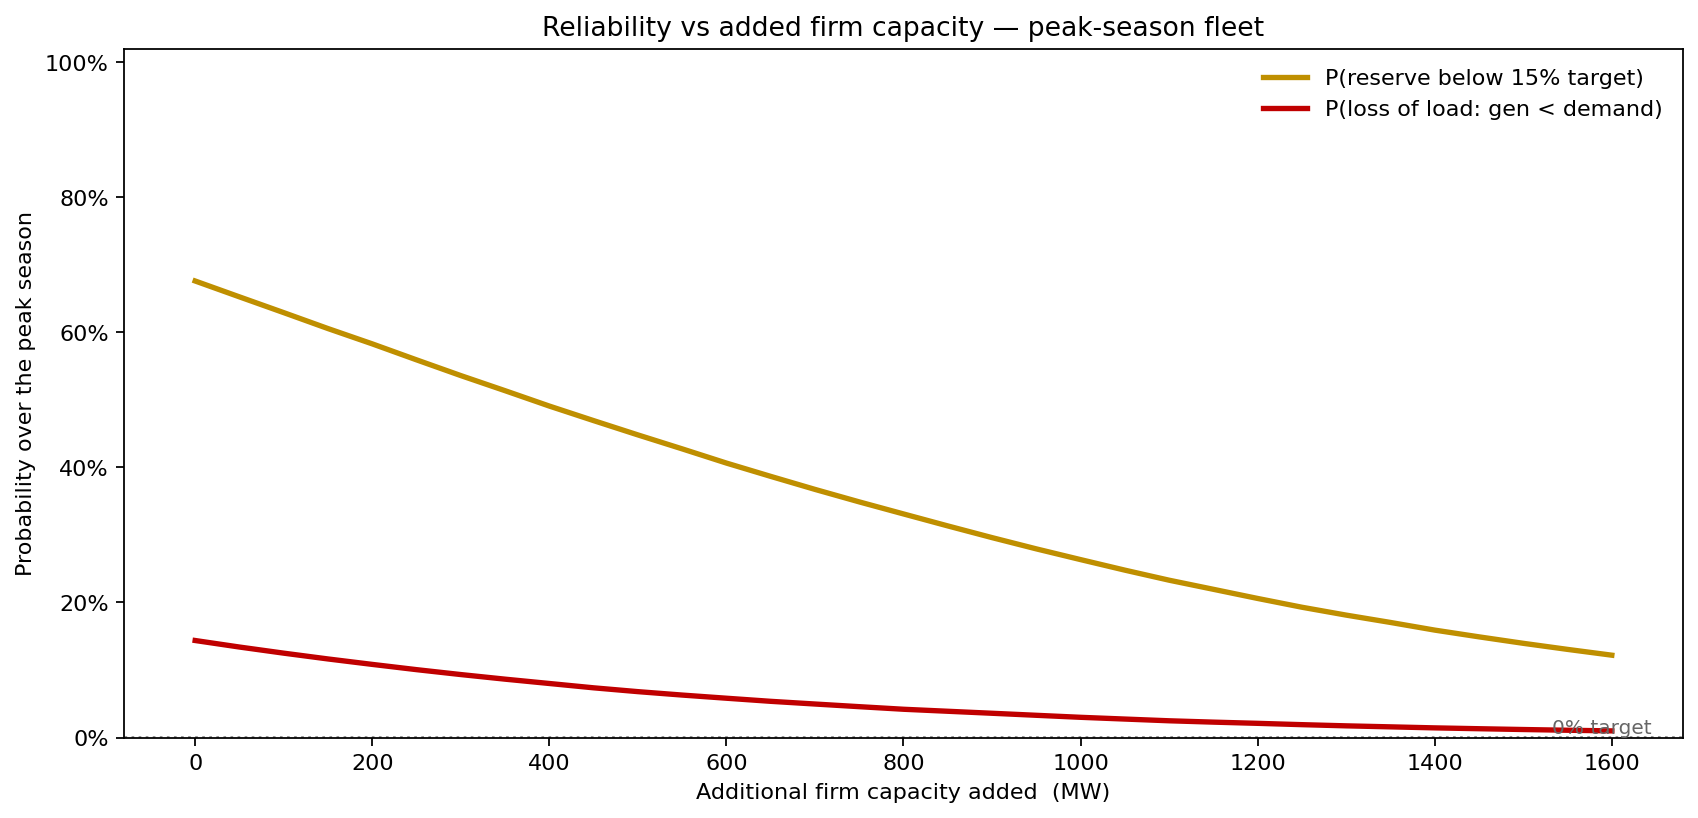
- At +0 MW: P(loss of load) 14.4%, P(below 15% target) 68%.
- +400 MW: P(LOL) falls to 8.0%.
- +800 MW: P(LOL) 4.2% — roughly halving the shortfall risk again.
- +1,600 MW: P(LOL) 1.0%, P(below target) 12%.
The curve is the deliverable the deterministic study could never produce: it lets the planner buy a probability, not a slogan. Reaching a conventional one-day-in-ten loss-of-load standard requires substantially more than 1,600 MW given the heat correlation — a result that directly contradicts the "11% margin, we're fine" reading and reframes the capacity-procurement conversation around the tail. The filing now states reserve adequacy as P(loss of load) with a capacity-versus-reliability curve, rather than a single static margin the regulator could not reconcile against a heat-wave event.
ModelRisk functionality used
- Per-unit Bernoulli forced-outage draws at NERC-class EFOR rates, aggregated across 24 units, replacing a single fleet-average derate.
- Shared Gamma heat-wave common-cause factor that inflates every unit's outage probability and ambient derate while simultaneously raising demand — the positive correlation that creates the loss-of-load tail.
- Reserve-margin distribution with percentile and exceedance reporting — mean, median, P10, P1, P(below 15% target) and P(loss of load) — in place of a static margin.
- Tornado sensitivity on P(loss of load), isolating the heat common-cause factor and high-EFOR classes as the dominant drivers.
- Pareto decomposition of expected unavailable MW by generation class, locating the availability risk for targeted firming.
- Capacity threshold sweep scoring P(loss of load) and P(below target) against added firm capacity on the same simulated heat draws, turning an adequacy question into a priced reliability curve.
Reserve adequacy reported as a single margin assumes the fleet's worst day looks like its average day. It doesn't — a heat wave correlates the failures and the demand. Modelling that correlation in ModelRisk turns "11% margin, adequate" into "14% chance of losing load, and here is the capacity curve that buys it down" — the number a resource-adequacy filing actually needs to defend.