

Industry: Utilities
Product: ModelRisk
Application: Long-Term Demand Forecasting and Capacity-Expansion Timing
The 2045 Peak Is a 10,800-to-14,700 MW Cone, and It Decides When to Break Ground
A utility's Integrated Resource Plan draws a single line: today's 9,500 MW peak grows at a steady 0.8%/yr to a tidy 12,399 MW in 2045. Below 11,800 MW of firm capacity for most of the horizon, the plan looks relaxed. But that line is the one trajectory that compounding uncertainty almost never produces. Run as 60,000 twenty-year futures, the 2045 peak is a cone running from a P10 of 10,789 MW to a P90 of 14,666 MW, with a 71% probability of breaching firm capacity somewhere inside the horizon — half of those breaches arriving by 2040.
The driver is no longer weather; it is structural. EV charging, building electrification via heat pumps, economic growth and offsetting efficiency gains each compound over two decades, and a five-year build lead time means the commit decision has to be made years before the breach. The utility rebuilt its long-term demand forecast in ModelRisk to plan against the cone, not the line.
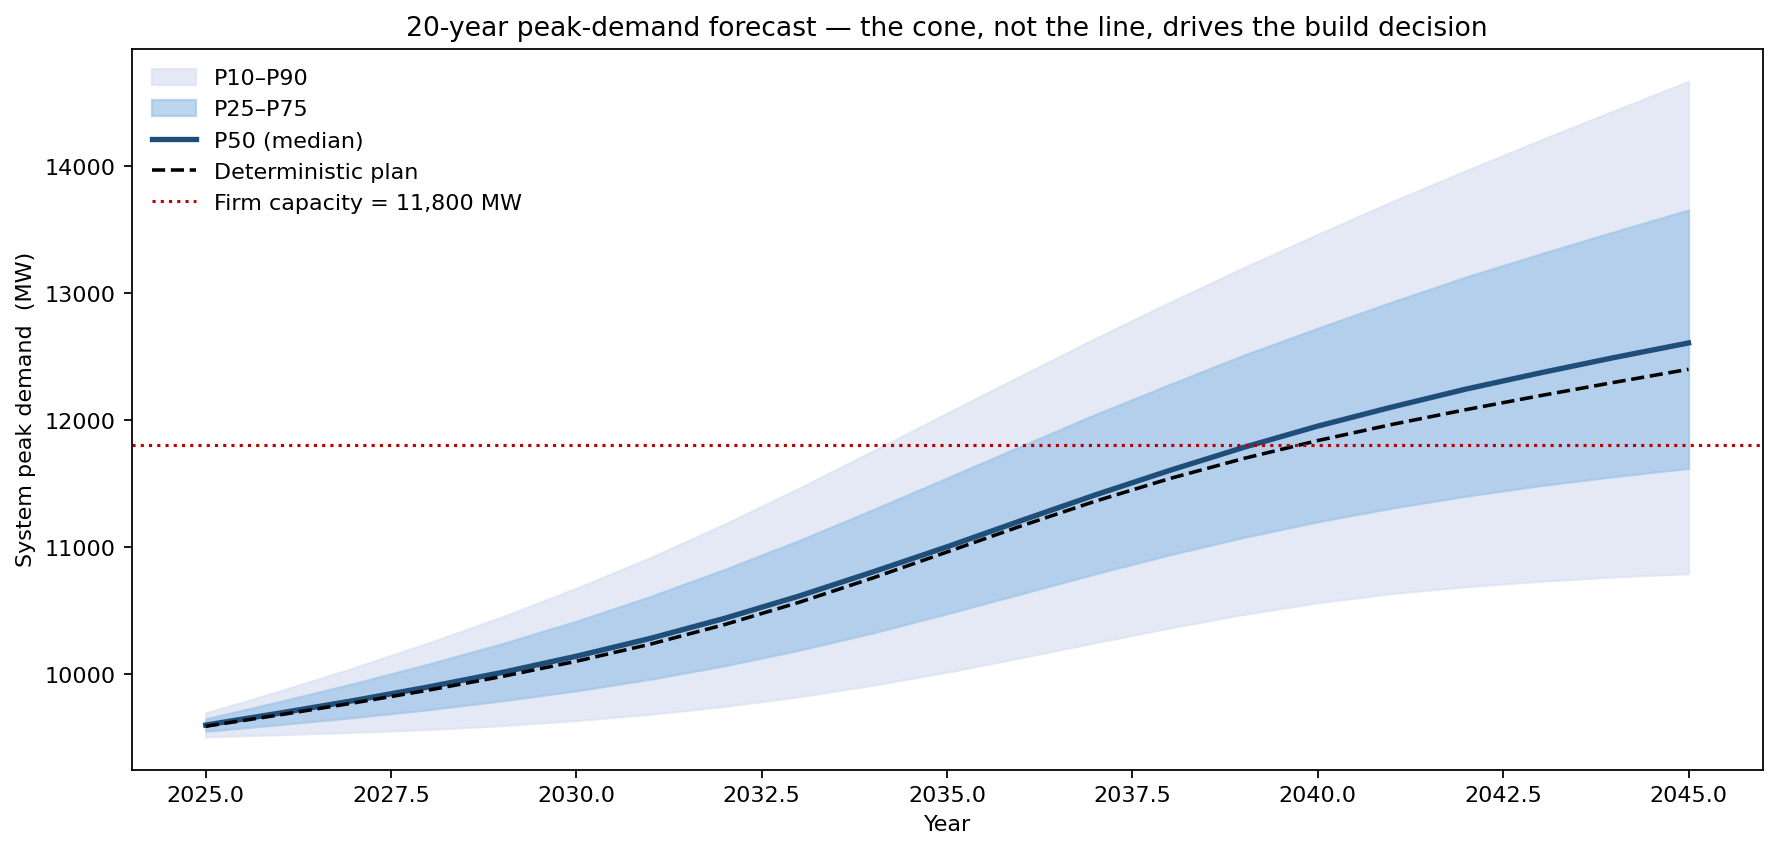
The fan widens far faster than any single growth rate suggests, because a persistent macro regime shifts the whole trajectory up or down rather than letting annual draws cancel out. By 2045 the median path (12,606 MW) sits close to the deterministic line (12,399 MW) — but the P90 path reaches 14,666 MW, more than 2,800 MW above firm capacity, and the cone crosses the firm-capacity line years earlier on its upper edge than the deterministic plan ever does.
Why a single growth rate fails here
The peak trajectory compounds four uncertain structural forces, not one trend:
- Baseline economic / population growth at ~0.8%/yr, but correlated across years through a shared macro regime so the cone keeps realistic width instead of collapsing toward its mean.
- EV adoption as a stochastic logistic S-curve — final fleet share Beta-scaled to 20%-75%, adoption midpoint Triangular(2030, 2035, 2042) — adding up to 2,600 MW to the coincident peak at saturation.
- Building electrification (heat pumps) ramping at an uncertain 45 MW/yr at the peak.
- Efficiency drag (codes, LED, smart thermostats) subtracting an uncertain 38 MW/yr.
The implied mean growth comes out at 1.45%/yr — nearly double the deterministic 0.8% — because the electrification adders are one-sided additions the linear trend was not carrying. A point forecast cannot represent "fast EVs and a hot economy" and "slow EVs with strong efficiency" at once; it picks the middle and plans for a future that has roughly a coin-flip chance of being too small.
When does the next resource have to be committed
Capacity is lumpy and slow. With a five-year permit-and-build lead time, the question is not whether demand breaches firm capacity but when the commitment has to be signed.
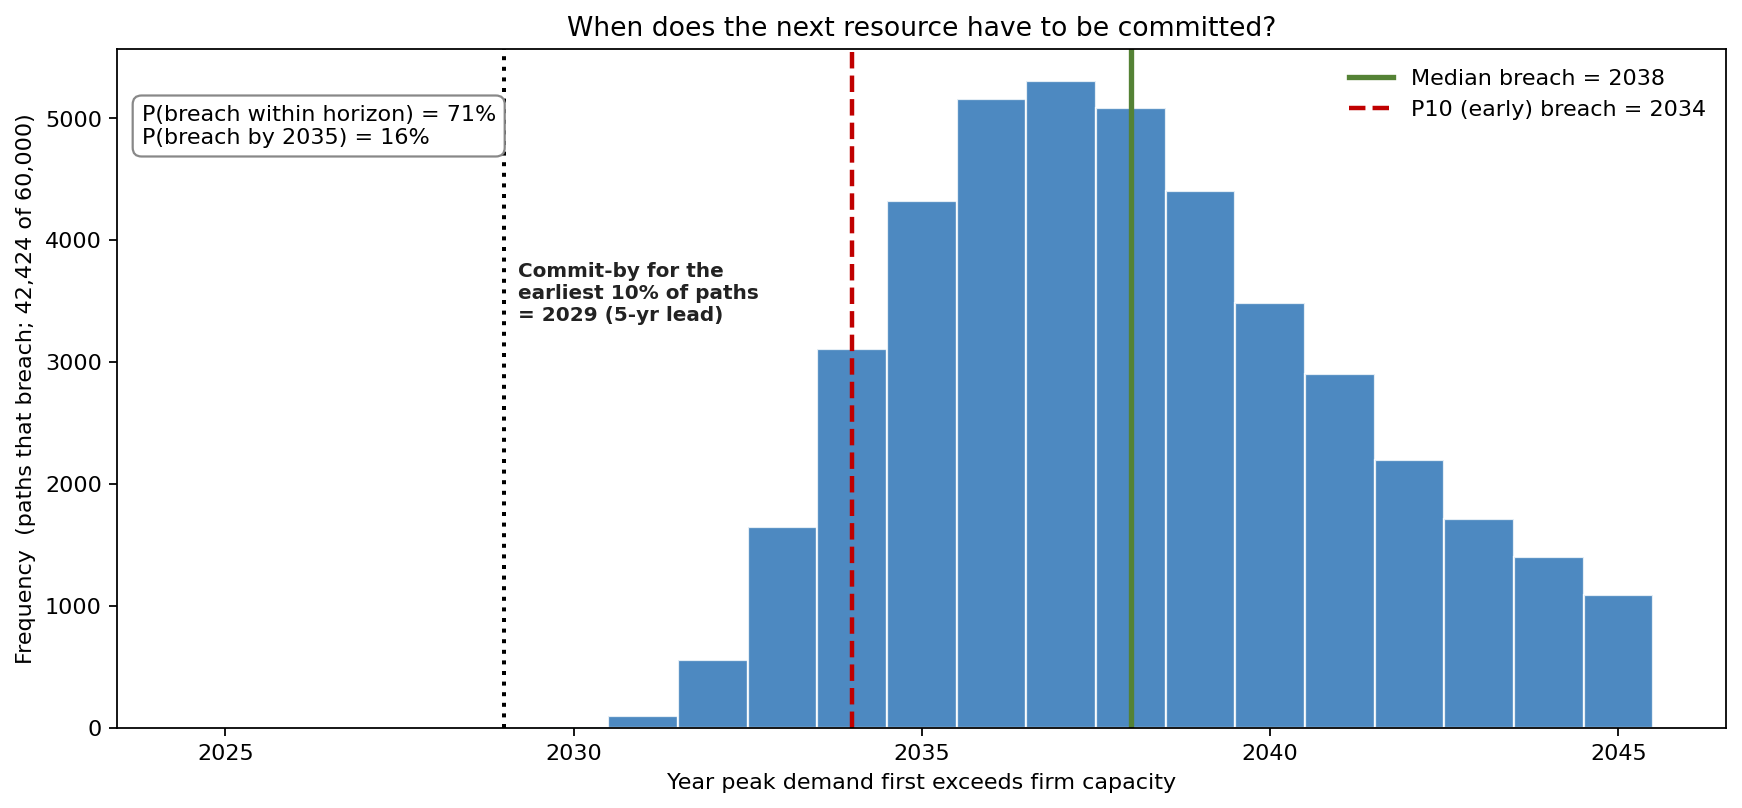
Across the paths that breach within the horizon, the first breach has a median of 2038 and a P10 (early) of 2034. Back the five-year lead time out and the commit-by date for the earliest 10% of futures is 2029 — already inside the current planning cycle. The probability of breaching by 2035 is 16%, rising to 55% by 2040. The chart converts an abstract growth cone into a board-level calendar: a meaningful slice of futures requires breaking ground essentially now.
What's driving the 2045 peak
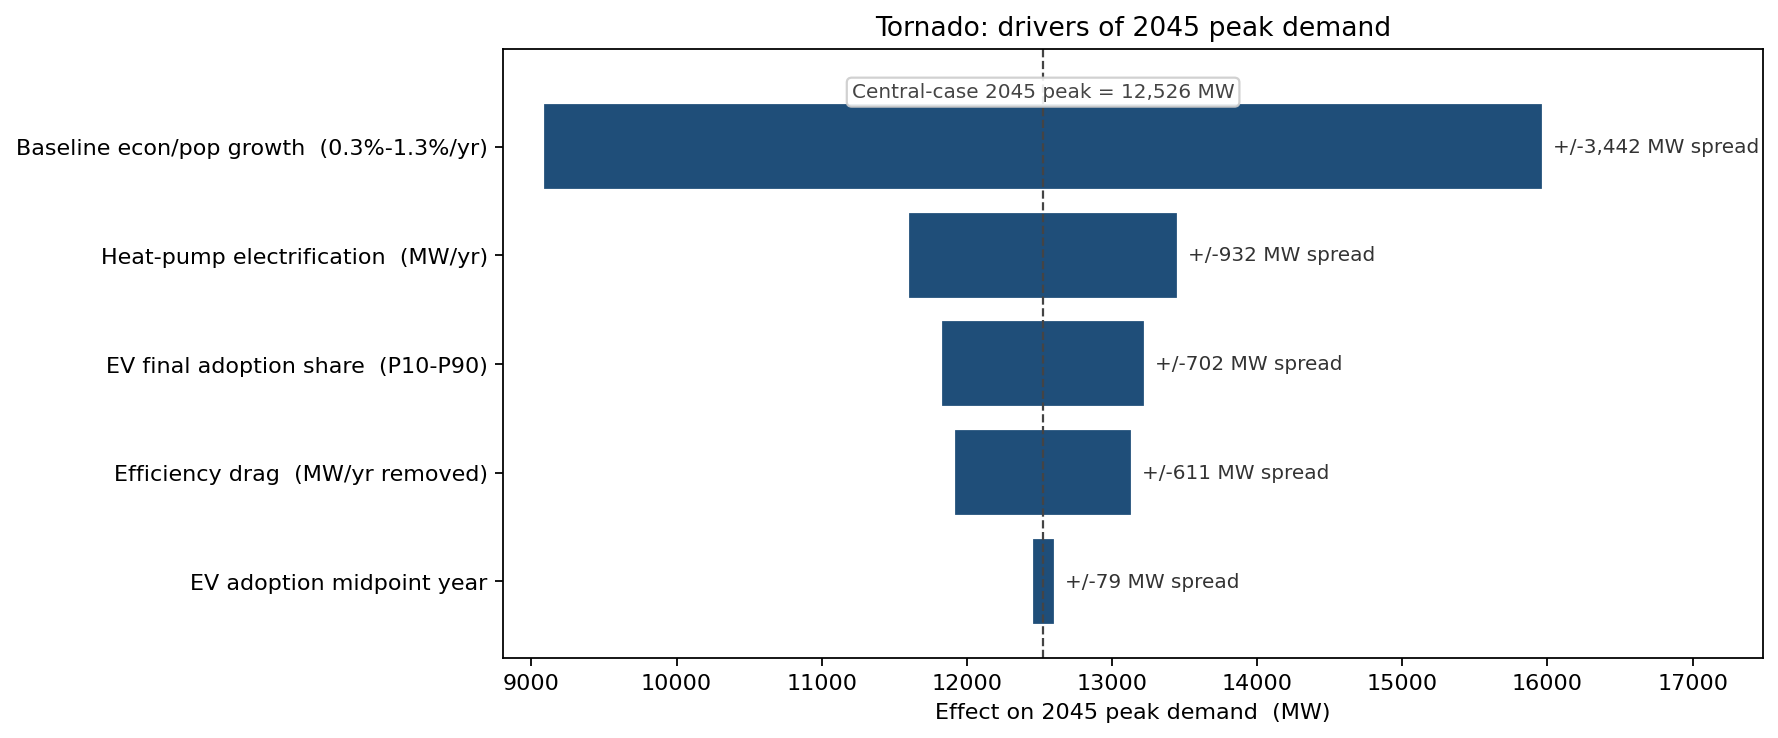
Baseline economic and population growth dominates the eventual peak size — its P10-to-P90 swing moves the 2045 peak by +/-1,721 MW — because it compounds multiplicatively over twenty years. Heat-pump electrification (+/-466 MW) and EV adoption share (+/-351 MW) follow, with the efficiency drag (+/-306 MW) partly offsetting and the EV adoption timing (+/-39 MW) almost irrelevant to the 2045 endpoint. The ranking tells the planning team that the macroeconomic assumption deserves the same scrutiny as the headline-grabbing EV forecast.
What the model changed
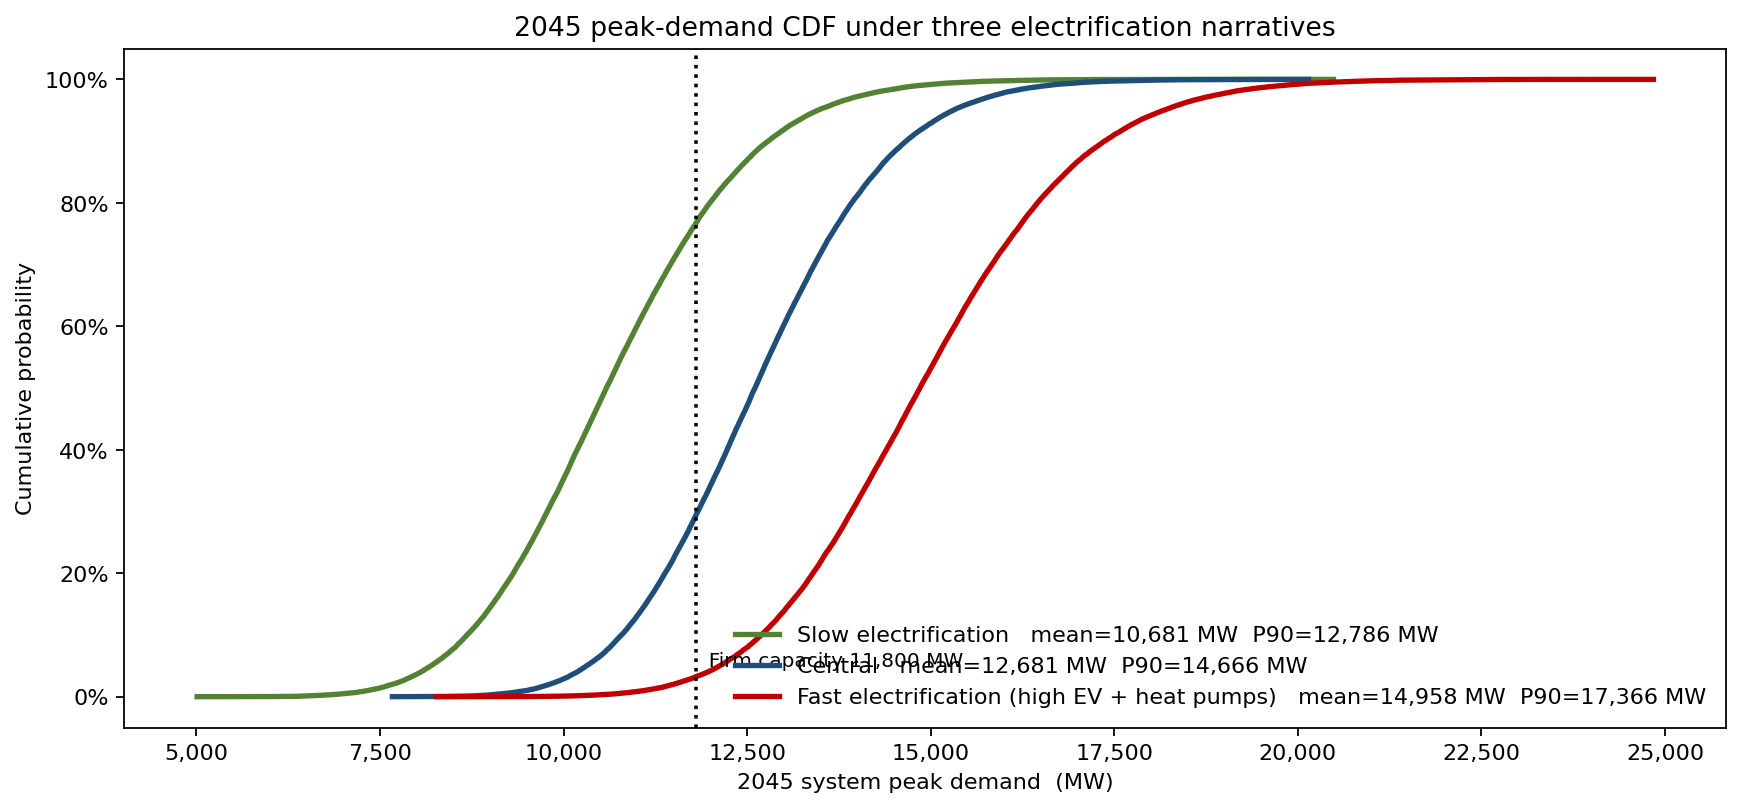
Re-running the structural adders under three coherent narratives separates the futures the IRP had blended together:
- Slow electrification (weak economy, modest EVs, strong efficiency): mean 10,681 MW, only a 23% chance of breaching firm capacity.
- Central: mean 12,681 MW, 71% breach probability.
- Fast electrification (hot economy, heavy EV and heat-pump uptake): mean 14,958 MW, a 97% breach probability.
These reframed the capacity plan around the decision the cone actually forces:
- Capacity-commitment trigger set to 2029 for a first tranche, sized to the early-breach paths rather than to the deterministic 2038 breach.
- A staged / optionable build adopted over a single large plant, so the back end of the cone can be matched to whichever electrification narrative materialises.
- Macroeconomic assumption elevated to a first-class planning input alongside the EV forecast, on the strength of the tornado.
- Efficiency programmes credited as a genuine peak-reducing lever (-38 MW/yr at the peak), valued explicitly against deferred capacity.
ModelRisk functionality used
- Compounded multi-year growth paths with a shared macro regime, so the forecast cone widens realistically instead of collapsing under the central-limit averaging of independent annual draws.
- Stochastic logistic EV-adoption S-curve with Beta-scaled saturation share and Triangular adoption-midpoint year, converted to a peak-MW adder.
- Additive structural adders for heat-pump electrification and a subtractive efficiency drag, layered on the multiplicative baseline.
- Capacity-breach-year distribution translated through the build lead time into a commit-by calendar — the actual decision variable.
- Scenario CDFs under three electrification narratives evaluated on the same simulated futures, and a tornado ranking the long-horizon drivers of peak size.
A twenty-year forecast that is a single line is a forecast that is wrong with probability one. The cone is the honest object: it tells the utility not just how big the next resource should be, but the year the cheque has to clear.