

Industry: Utilities
Product: ModelRisk
Application: Peak-Shaving with Demand Response and Storage
Peak-Shaving Worth a Mean of 456,000 GBP a Year — With a 4.3% Chance It Loses Money
A large industrial site faces a coincident-peak demand charge: its capacity bill is set by the single highest 15-minute interval it draws during the system peak, at a tariff that itself swings between 7 and 14 GBP per kW-month. To cut that bill the site runs a peak-shaving stack — a 6 MW demand-response contract plus an 8 MW / 16 MWh battery. The business case quoted a clean six-figure annual saving. The honest answer is a mean net value of 456,000 GBP a year, a P10 of 97,000 GBP, a P90 of 845,000 GBP, and a 4.3% probability the program is net-negative once storage timing risk and program cost are counted.
The uncertainty is not in the equipment ratings; it is in whether the stack actually delivers its nameplate MW at the interval the coincident peak lands. A battery that has partly discharged into an earlier ramp, a long peak window that drains a short-duration cell, and a demand-response contract that under-delivers all conspire on the worst days. The site modelled the stack in ModelRisk to value the shave it will really get, not the shave on the datasheet.
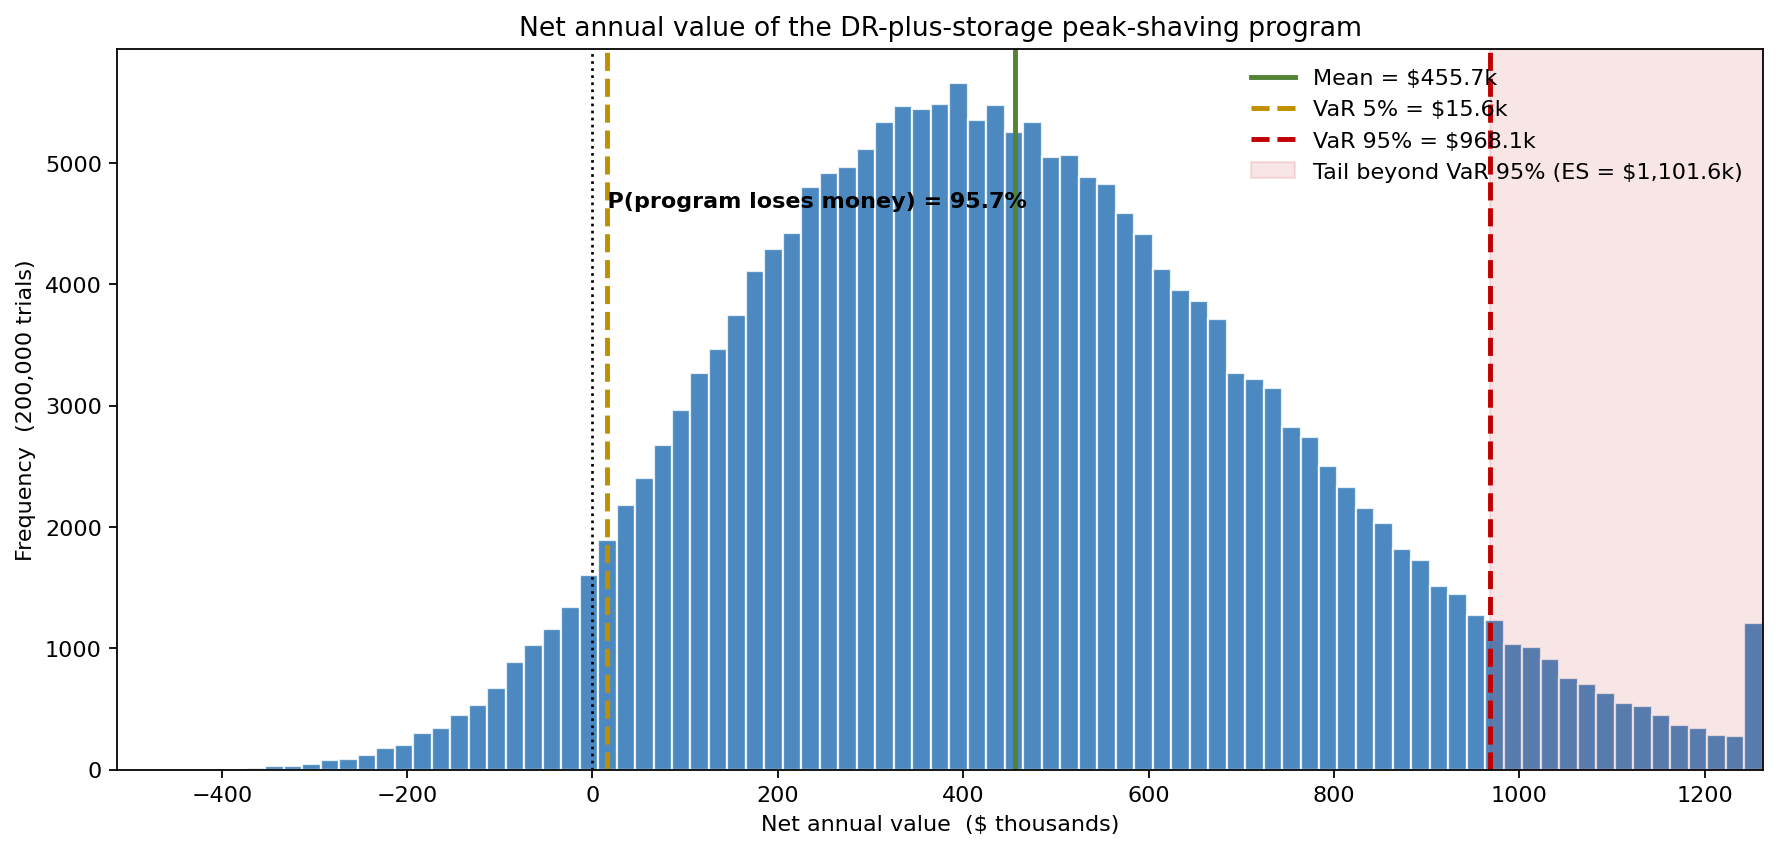
Across 200,000 simulated billing years the net value is right-shifted but with a real left tail crossing zero: the 5th-percentile outcome is 97,000 GBP and 4.3% of years lose money. The spread is driven by two things moving together on bad days — a low coincident-peak tariff (less value per MW shaved) and a long, late peak that the battery cannot fully cover. A single point estimate of "456k a year" would never surface the 1-in-23 year the program disappoints.
Why a point estimate fails here
The shave the stack delivers on the peak interval is itself a distribution:
- Demand response delivers a Beta-distributed fraction of its 6 MW contract (mean ~67%), so a mean of 4.0 MW, not 6.
- Battery output is capped by either its 8 MW inverter or its usable energy divided by the peak-window duration. State of charge at the peak interval is Beta (mean ~0.70) — the timing risk — and the window is Triangular(1.0, 2.0, 3.5) hours. On a long, late peak the 16 MWh cell is energy-limited well below its 8 MW rating, delivering a mean of just 5.3 MW.
- The coincident-peak tariff is Triangular(7.0, 9.5, 14.0) GBP/kW-month — the value of every shaved MW rides on it.
The result is a total shave of mean 9.3 MW (P10 6.9 MW, P90 11.9 MW) against a nameplate of 14 MW. Multiplying nameplate MW by the modal tariff — the deterministic shortcut — overstates both the physical shave and its value, and shows none of the loss tail.
The physical shave: residual peak before and after
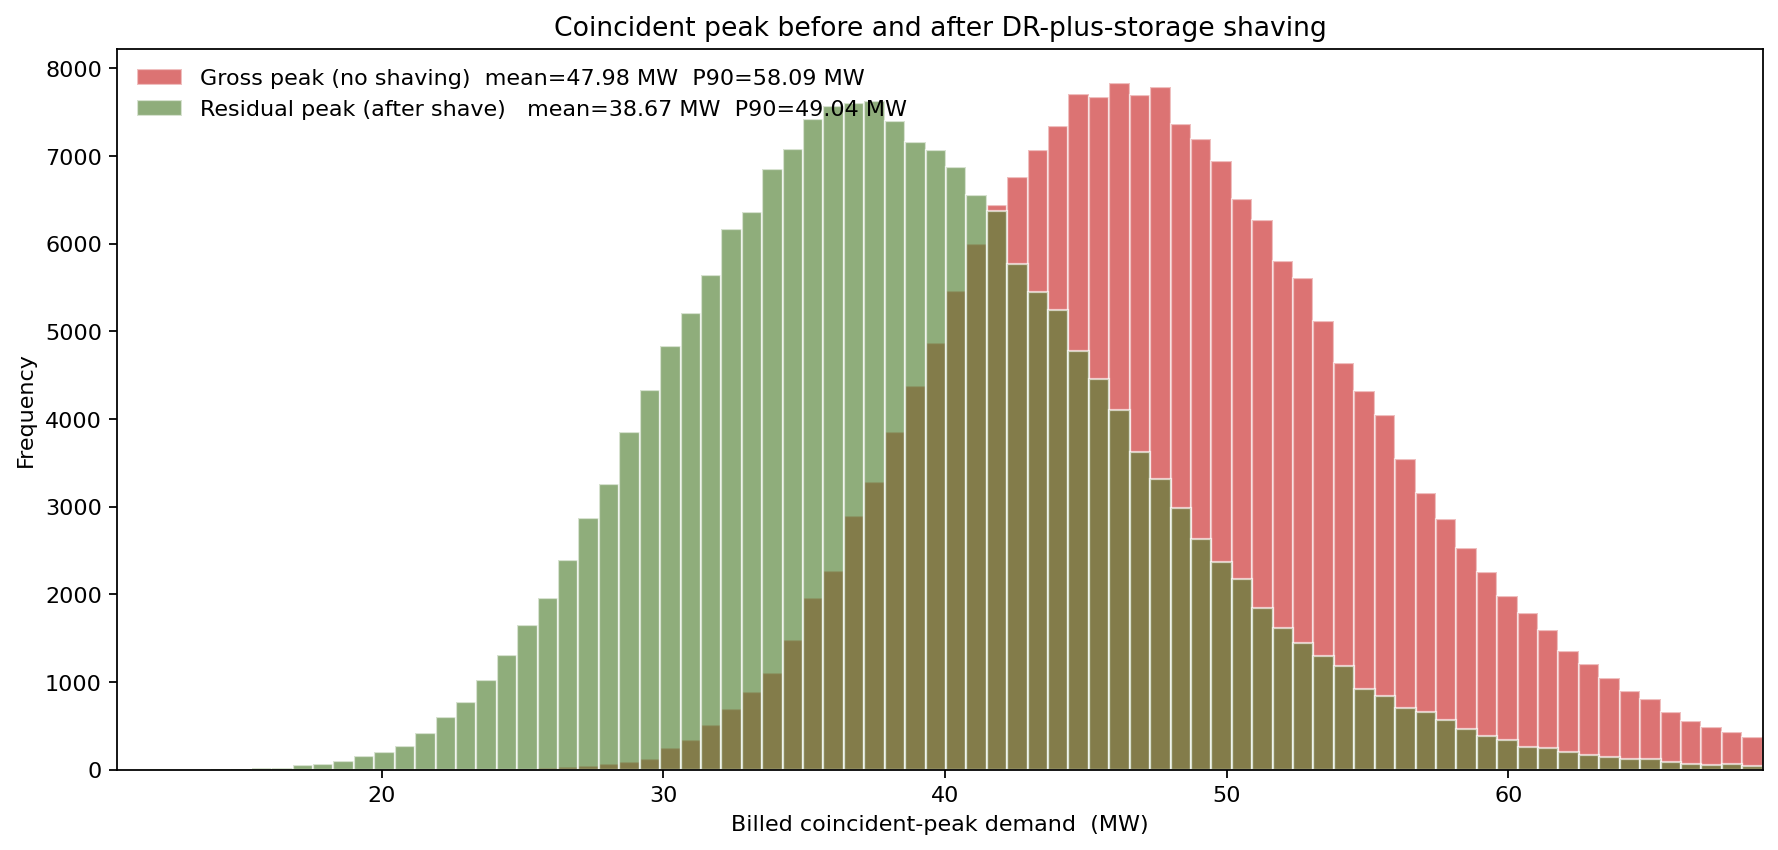
The gross coincident peak averages 48.0 MW with a right-skewed tail to a P90 of 58.1 MW. After the stack fires, the residual (billed) peak averages 38.7 MW — a mean shave of 9.3 MW — but the residual distribution keeps its width and tail: a P90 residual of 49.0 MW. The stack lowers the whole distribution; it does not flatten it, because the worst gross-peak days are also the days the battery is most likely to be energy-limited.
What's driving the net value
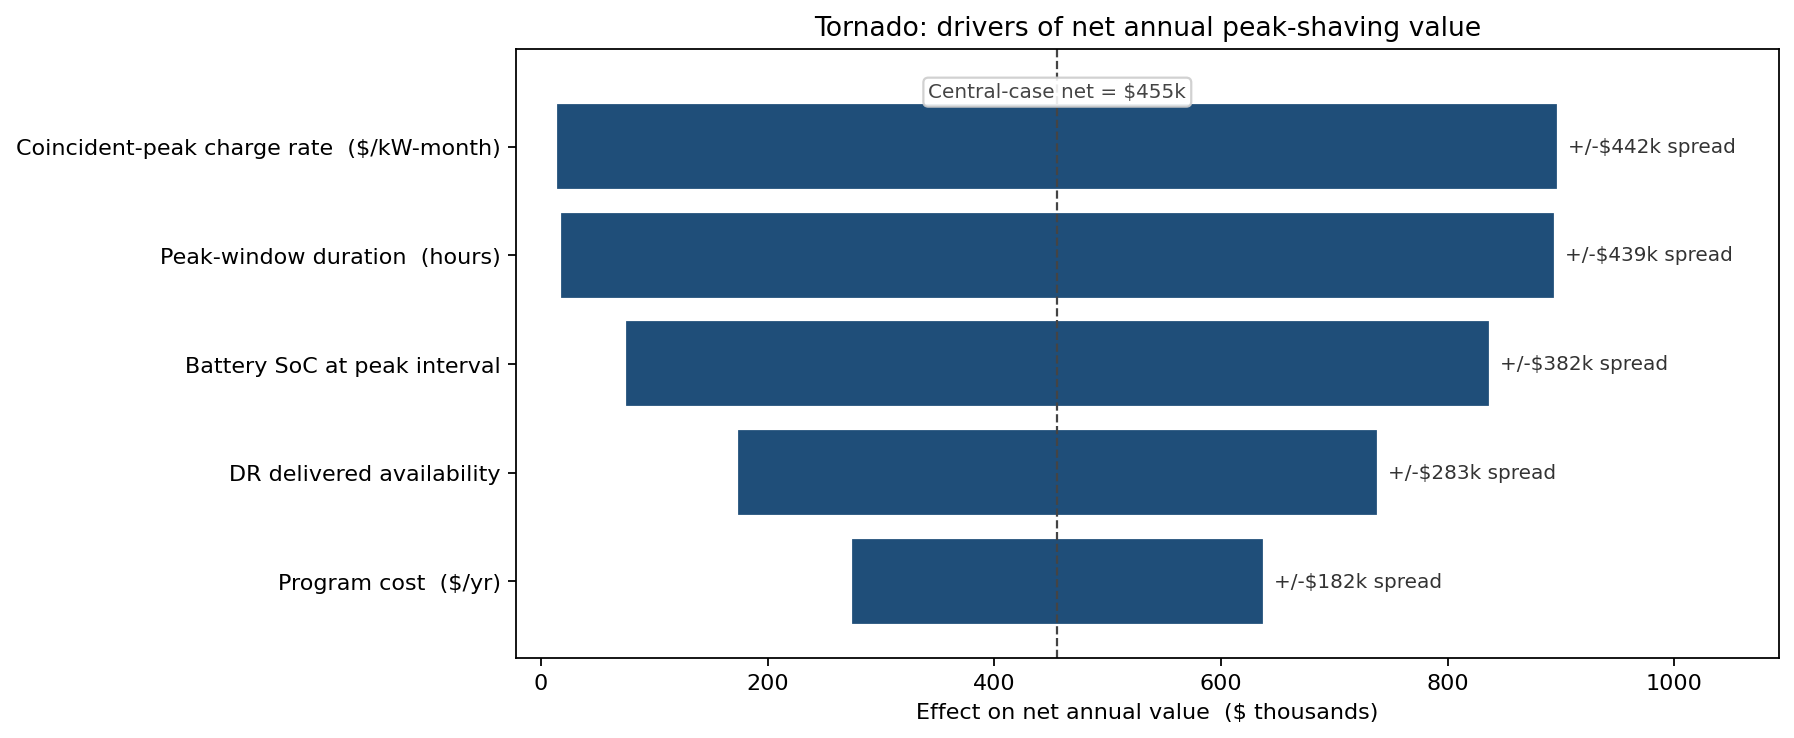
The tornado reorders the intuition. The coincident-peak tariff (+/-221,000 GBP) and the peak-window duration (+/-219,000 GBP) lead — duration matters as much as price, because a long window is what turns the battery from power-limited into energy-limited. Battery state of charge at the interval (+/-191,000 GBP) and DR delivered availability (+/-141,000 GBP) follow; program cost (+/-91,000 GBP) is the smallest swing. The ranking points operations at the right lever: protecting battery state of charge into the peak window is worth more than squeezing the DR contract.
What the model changed
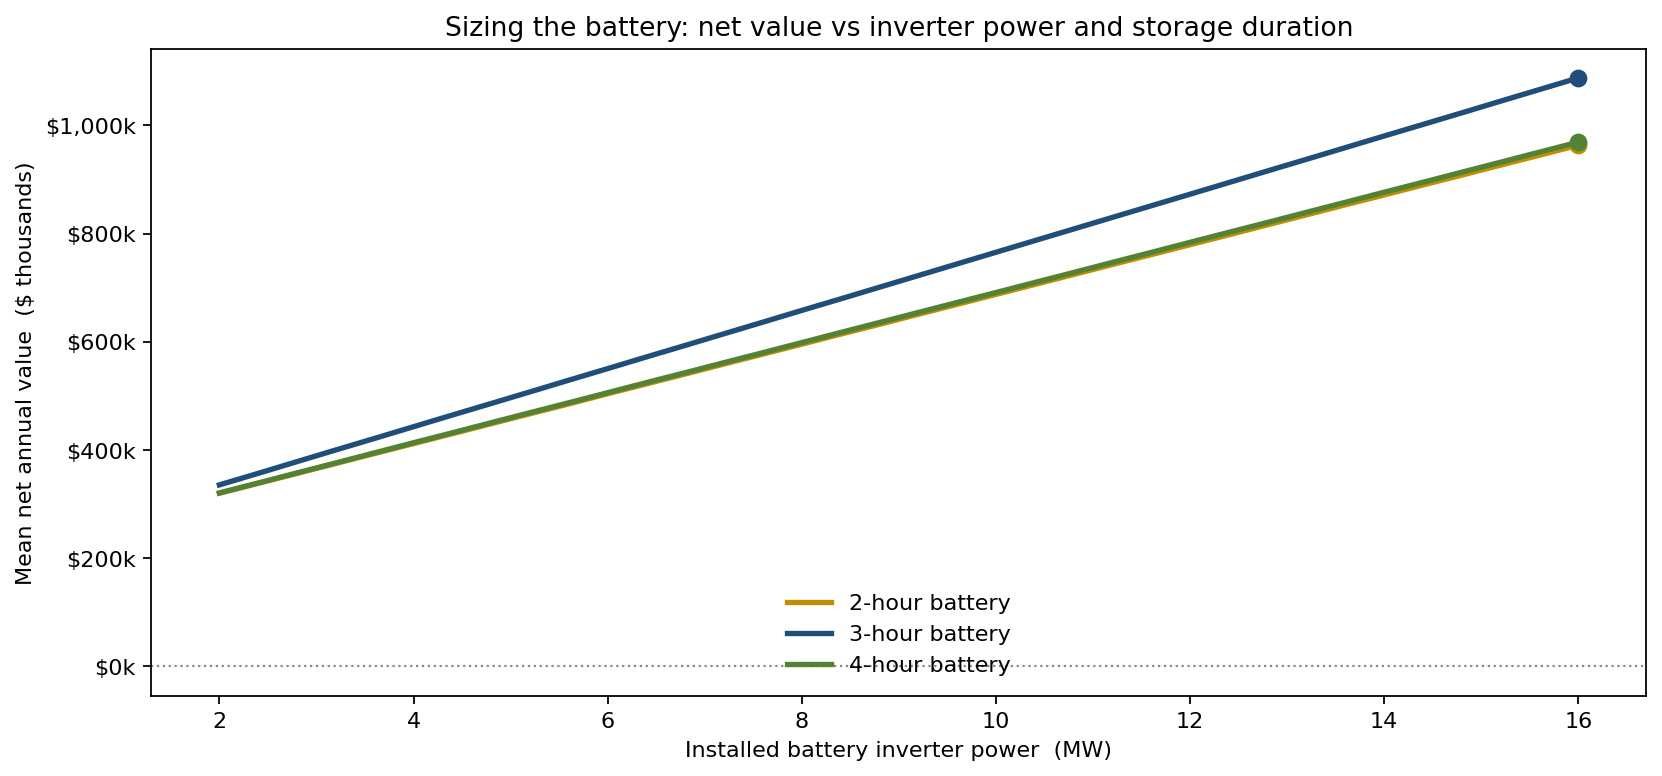
Sweeping installed inverter power across three storage durations shows the energy-versus-power trade directly. The 3-hour battery is the best design, peaking near 1,088,000 GBP/yr of mean net value — it beats the 4-hour option (969,000 GBP) because amortised cost scales with installed energy, and it beats the 2-hour option (963,000 GBP) because the 2-hour cell runs out of energy on long peak windows. That crossover, invisible to a nameplate calculation, drove the design:
- Storage duration set to 3 hours rather than the originally specified 2-hour cell, on the net-value crossover.
- State-of-charge discipline added to the dispatch rule — holding a reserve charge into the forecast peak window — after SoC ranked third in the tornado.
- DR contract value re-based on a 67% mean delivered fraction instead of the contracted 6 MW, ending the systematic overstatement.
- Tariff exposure hedged where possible, since the coincident-peak rate is the single largest value driver and is itself uncertain.
ModelRisk functionality used
- Right-skewed gross-peak demand (LogNormal) so the residual-peak distribution and its tail are modelled, not just a mean shave.
- Energy-versus-power battery logic combining a Beta state-of-charge draw and a Triangular peak-window duration, so the battery is correctly energy-limited on long, late peaks — the timing risk the datasheet ignores.
- Beta-distributed DR delivery capturing the gap between contracted and delivered curtailment.
- Per-trial Triangular coincident-peak tariff flowing through to the avoided-demand-charge value, making the tariff a genuine driver in the tornado.
- Battery-sizing sweep of mean net value across inverter power and storage duration, surfacing the 3-hour crossover that a deterministic sizing calculation misses.
Peak-shaving is sold on nameplate MW and billed on the interval the peak actually lands. ModelRisk values the difference — the shave the site really gets, the tariff it really faces, and the 1-in-23 year the program does not pay.