

Industry: Utilities
Product: ModelRisk
Application: Outage management
A 5.6-Hour Average Restoration Time Hides a One-in-Three Chance of Blowing the 6-Hour Target
When a major outage hits a distribution network, the clock the regulator and the public watch is restoration time — how long from the lights going out to the bulk of affected customers being back on. The control-room playbook builds that estimate by adding up the average duration of each stage: detect-and-dispatch, travel and site access, switching to re-route load, then field repair. The stage averages sum to 5.6 hours, which sits just inside the utility's 6-hour restoration commitment. On paper, the target is met.
It is the wrong reading of the number. Restoration time is not the sum of four fixed stages; it is the sum of four right-skewed stages whose lengths all rise together when a storm is severe — debris blocks access, simultaneous tickets stretch the crews, and more poles and spans are down to repair. Simulate 200,000 major outages in ModelRisk with that shared severity driver and the median restoration is 4.6 hours, the mean 5.6, but the P90 is 10.0 hours and the P99 20.5. The chance of exceeding the 6-hour commitment on any given major outage is 32% — roughly one in three. The 5.6-hour average is real, but it describes neither the typical event (which is faster) nor the events that actually generate complaints and penalties (which are far slower).
Why a point estimate fails here
- Each stage is right-skewed, and they sum. Field repair in particular is heavy-tailed: most jobs are a couple of hours, a few run all night. The mean of a sum of skewed variables sits above the median and tells you little about the upper tail you are actually managed against.
- The stages are correlated through outage severity. A severe storm does not lengthen one stage by its average; it lengthens dispatch, access, switching and repair simultaneously. Treating the stages as independent would let the central-limit effect cancel the variability and produce a misleadingly tight estimate. The operational tail — the 10-hour and 20-hour events — only appears when the common severity factor links the stages.
In ModelRisk, a single LogNormal outage-severity factor is drawn per event (median 1.0, right-skewed) and scales every stage: dispatch and access partly, field repair fully. Each stage is itself LogNormal, so the result is a genuinely heavy-tailed restoration distribution rather than a bell curve.
The restoration-time distribution
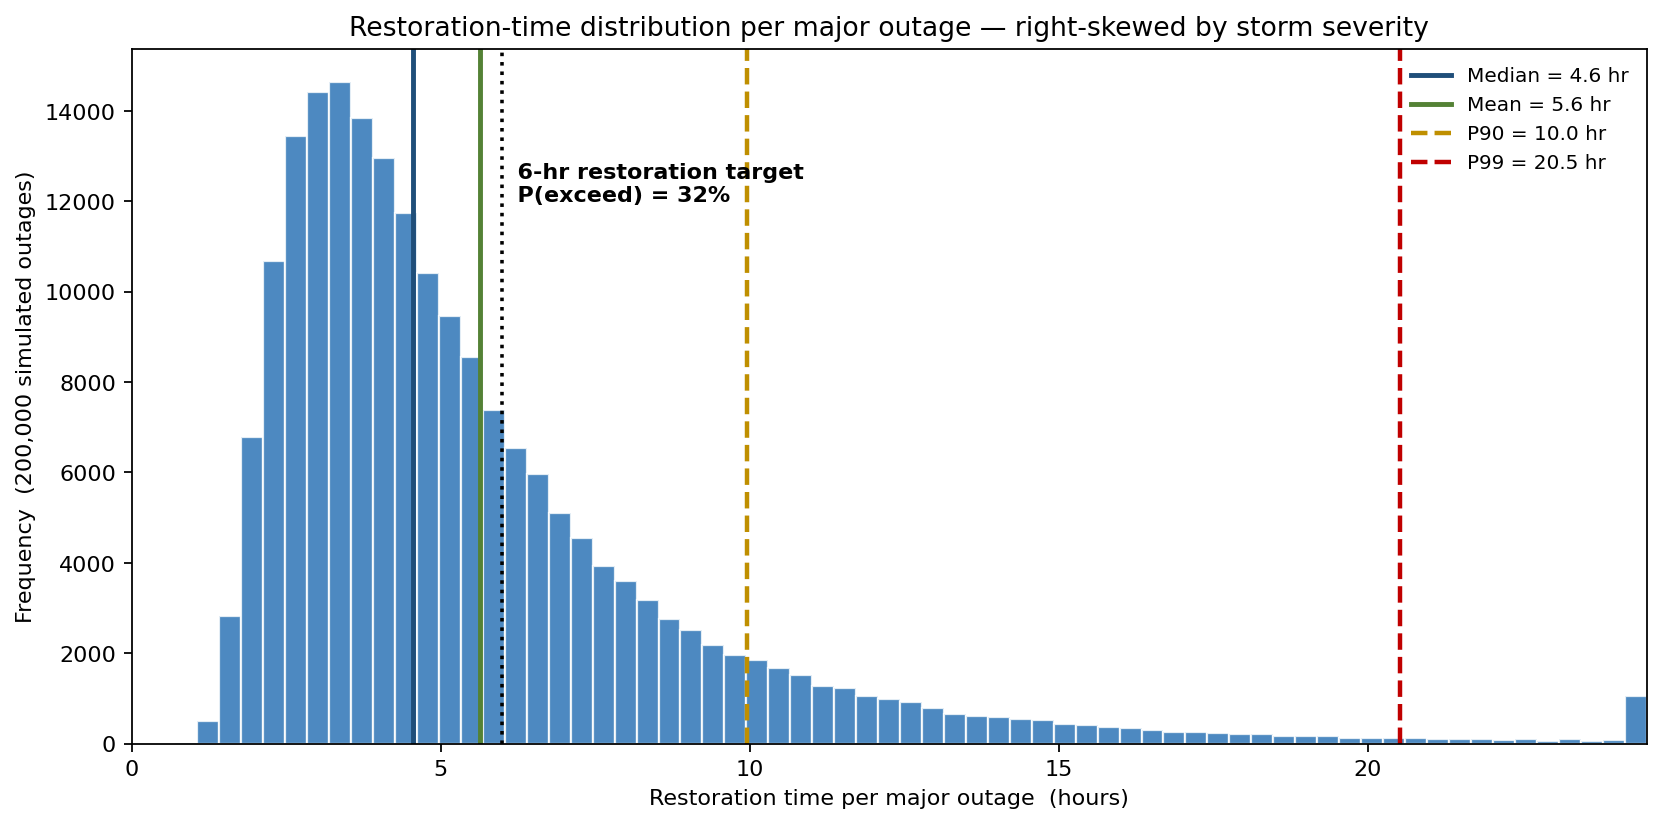
The headline chart is the distribution of restoration time across 200,000 simulated major outages. The median is 4.6 hours and the mean 5.6 — the gap between them is the signature of the right skew. The P90 is 10.0 hours and the P99 is 20.5, with the worst simulated event running far longer. Against the 6-hour restoration target, P(exceed) = 32%. The mean stage split confirms where the time goes: dispatch 0.5 h, travel/access 0.8 h, switching 0.7 h, and field repair 3.6 hours — repair is both the largest stage and the one carrying the tail.
What drives the slow events
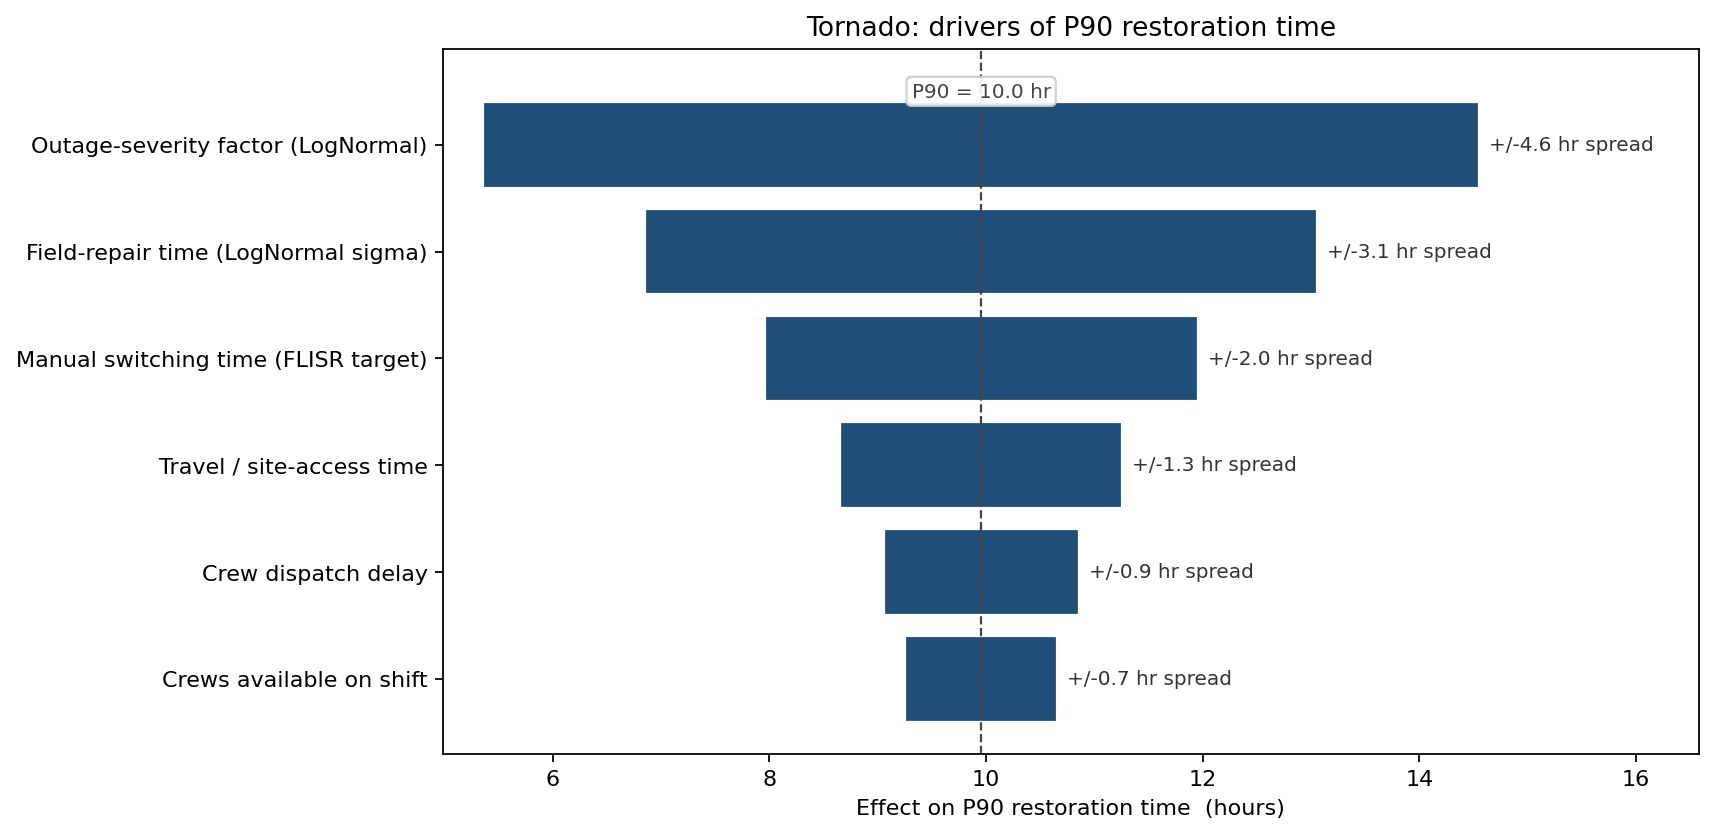
The tornado ranks inputs by their effect on P90 restoration time (the 10-hour figure). The outage-severity factor dominates (≈ ±4.6 hours), confirming that the correlated severity driver — not any single stage in isolation — owns the tail. Field-repair dispersion is second (≈ ±3.1 h), and manual switching time third (≈ ±2.0 h). That switching bar matters because it is the stage that automation can almost eliminate — which is exactly what the next comparison tests.
The stages of a representative outage
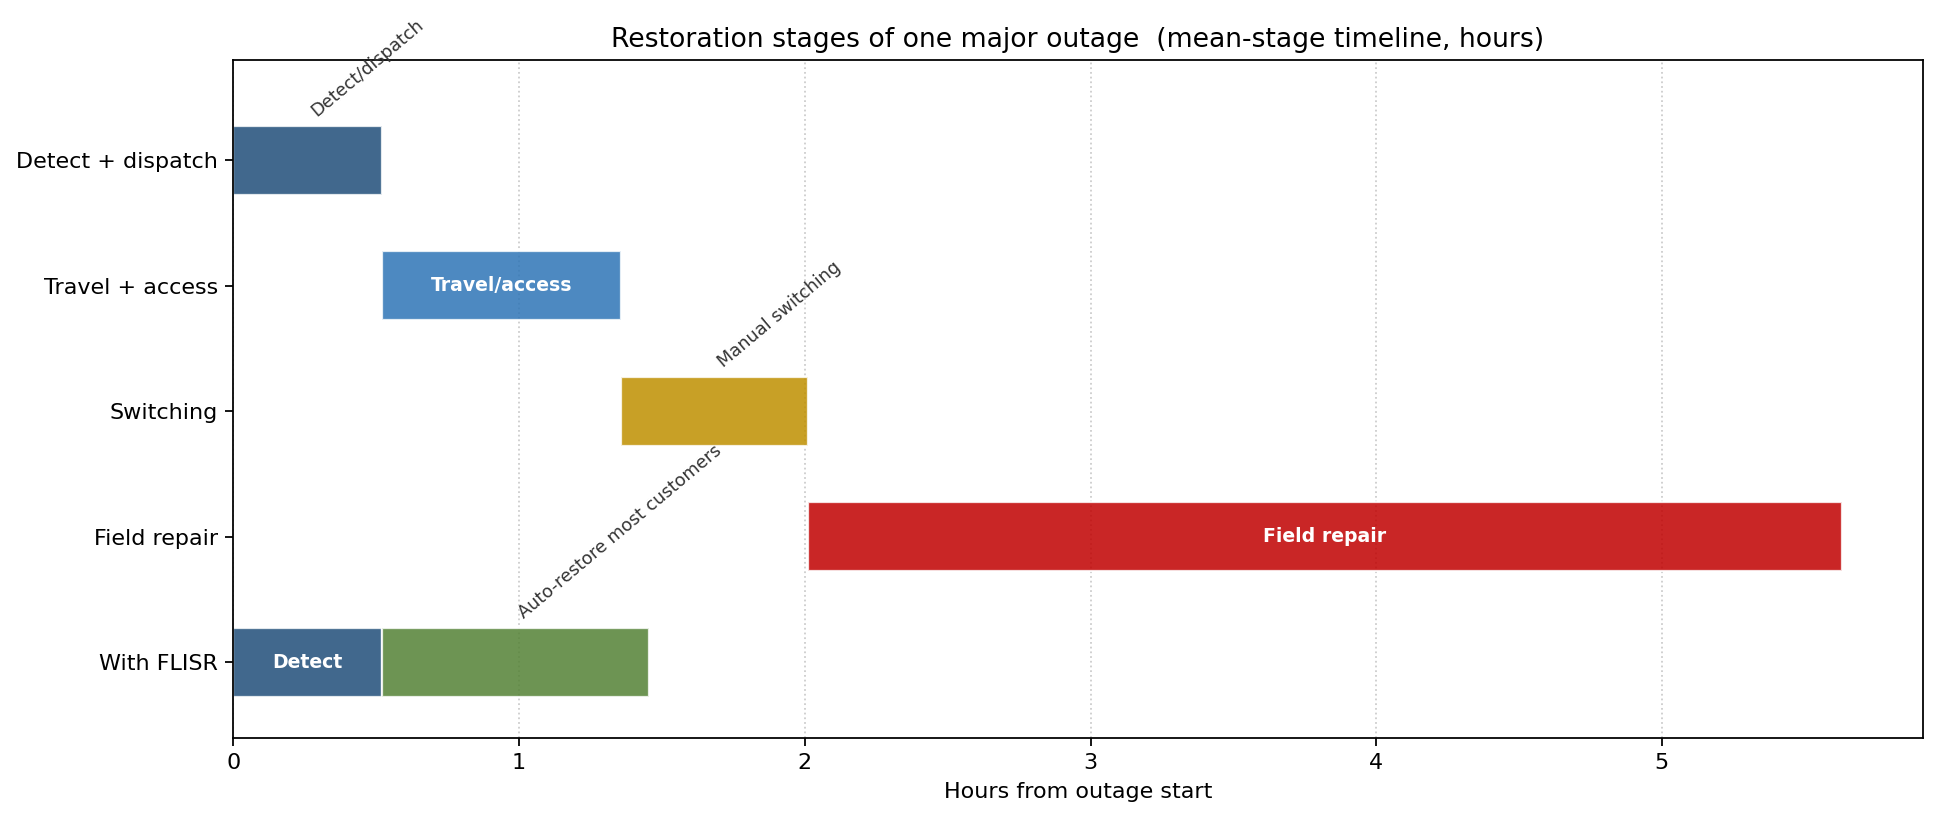
Laying the mean stage lengths end to end shows the operational sequence: detect-and-dispatch through the first half-hour, travel and access to ~1.4 hours, manual switching to ~2.0 hours, then field repair carrying the event out to ~5.6 hours. The bottom track shows the alternative: with FLISR (Fault Location, Isolation and Service Restoration) automation, the switching stage collapses and most customers are auto-restored within minutes of detection, leaving only the faulted section waiting on the repair crew.
What the model changed
The team valued two levers against the same simulated outages, so the comparison is not confounded by which storms happened to be drawn:
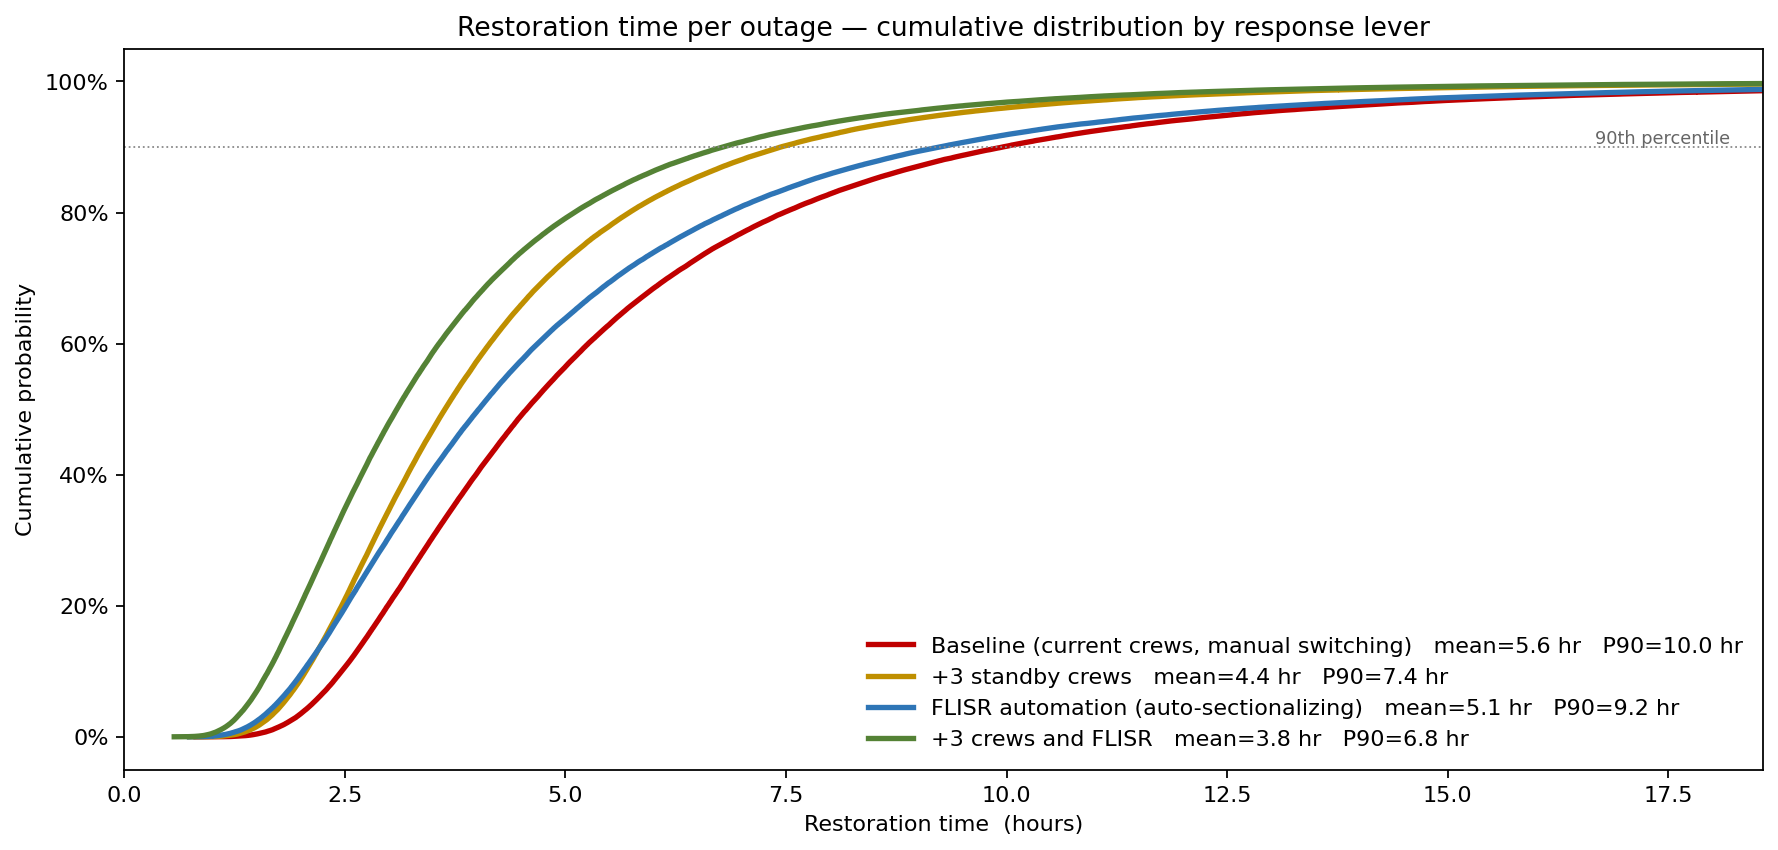
- Baseline (current crews, manual switching): median 4.6 h, P90 10.0 h, P(exceed 6 h) = 32%.
- +3 standby crews: median 3.6 h, P90 7.4 h, P(exceed 6 h) 18% — extra crews cut dispatch delay and let repair run in parallel, attacking the body and the tail.
- FLISR automation: median 4.0 h, P90 9.2 h, P(exceed 6 h) 26% — automation restores most customers fast but does little for the faulted segment still waiting on repair, so the long tail is only modestly shorter.
- +3 crews and FLISR together: median 3.1 h, P90 6.8 h, P(exceed 6 h) 14%.
The decisive insight is that the two levers act on different parts of the distribution: automation moves the median (most customers back fast), while extra crews move the tail (the long repairs that breach the target). Only the combination pulls P(exceed) from one-in-three down to roughly one-in-seven, and brings the P90 to within sight of the 6-hour commitment. A point-estimate comparison of "5.6 h vs 5.6 h minus a bit" could never have separated those two effects.
ModelRisk functionality used
- Shared LogNormal outage-severity factor drawn per event, scaling every restoration stage so dispatch, access, switching and repair lengthen together — the correlation that produces the heavy restoration tail.
- Stage-built LogNormal restoration model (detect/dispatch + travel/access + switching + field repair) that sums skewed stages instead of fixed averages.
- Percentile and exceedance reporting — median, mean, P90, P99 and P(restoration > 6 h) — in place of a single average.
- Tornado sensitivity on P90 restoration time, isolating outage severity and field-repair dispersion as the tail drivers.
- Scenario comparison on common random numbers, valuing extra crews and FLISR automation against identical simulated outages so each lever's effect on the body versus the tail is visible.
- Customer-hours-lost accumulation (restoration time weighted by affected customers) for the regulatory and reliability-index reporting that sits downstream of the restoration model.
A restoration commitment is a promise about a distribution, not about an average. Modelling the outage stage by stage in ModelRisk turns "5.6 hours, target met" into "32% chance of a breach, and here is the crew-plus-automation mix that halves it" — the difference between a number that looks safe and a plan that is.