

Industry: Utilities
Product: ModelRisk
Application: Distribution Transformer Loading and Overload Risk under EV + DER Growth
12% of the Transformer Fleet Tips Over Its Firm Rating by 2035 — and the Reinforcement Window Opens in 2033
A distribution planner owns 300 MV/LV transformers and a deterministic load forecast that says mean fleet loading reaches 85% of firm rating by 2035 — comfortably inside the nameplate, no reinforcement required. The forecast multiplies one organic growth rate by one EV-adoption curve and reports a single loading number per transformer. On paper, the fleet is fine.
The trouble is that "85% on average" hides the transformers that are already at 90% today, the EV clusters that land on a single street, and the fact that a hot evening peak pushes the whole fleet up together. Run the loading forecast 20,000 times with organic growth, EV adoption, per-transformer headroom and rooftop PV all uncertain, and the fleet doesn't sit at 85% — it spreads from a P50 of 85% out to a P90 of 101% and a P99 of 115%, with a 12% probability that any given transformer is over its firm rating by 2035. That's a mean of 36 of 300 transformers in overload, against a stock of just 6 mobile spares. The point estimate sees a healthy fleet; the simulation sees a reinforcement program.
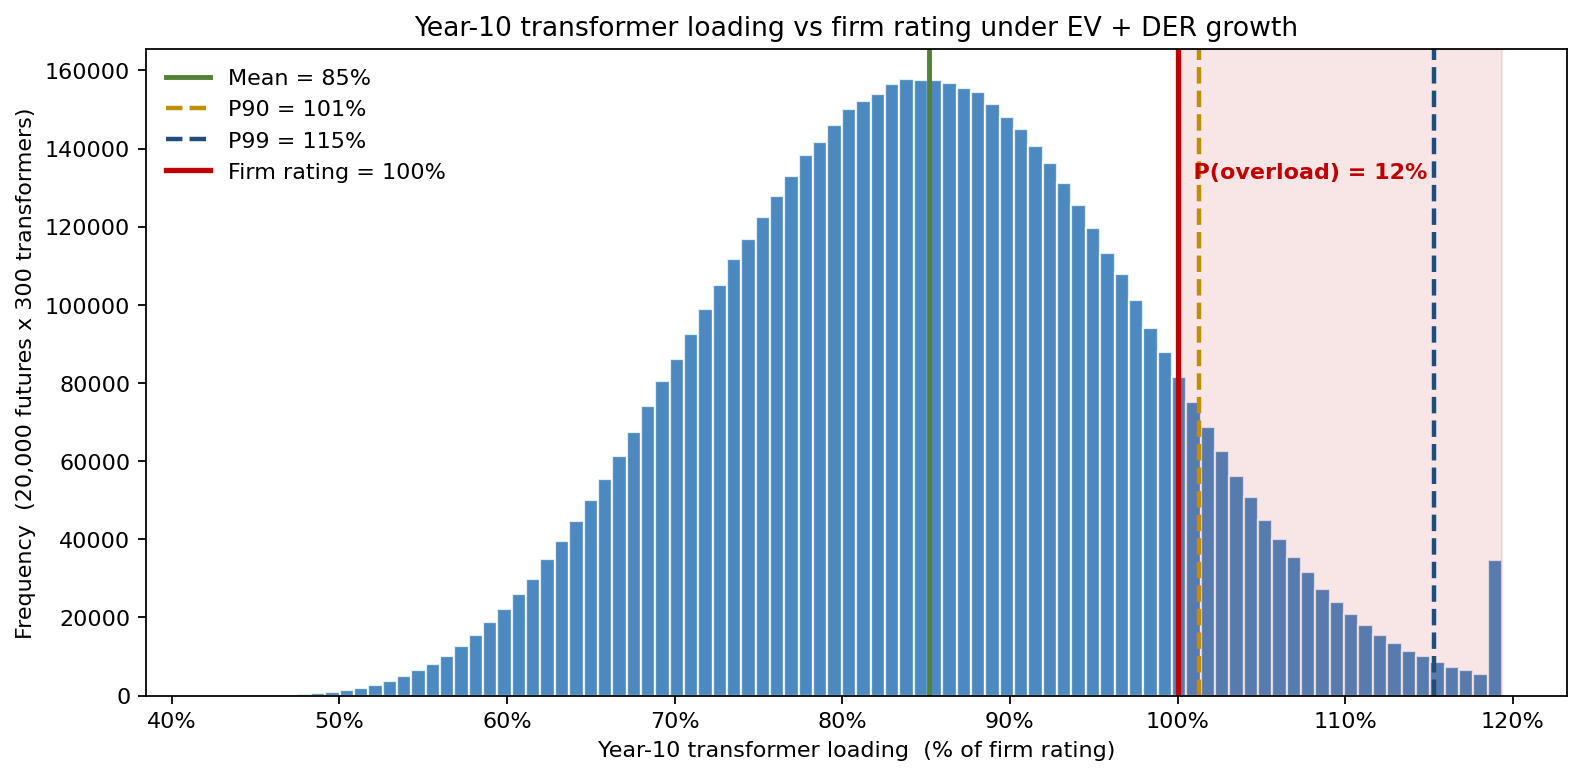
The year-10 loading distribution has its bulk below the firm rating but a tail that crosses cleanly into overload: mean 85%, P90 101%, P99 115%, and 12% of the fleet-and-future mass above the 100% line. Every transformer to the right of that red line is a thermal-ageing, fault-risk and replacement event the deterministic 85% never flagged. The rest of this study is about when that tail arrives, what drives it, and how big the reinforcement program has to be.
Why a point estimate fails here
The deterministic forecast computes loading per transformer as a single product:
\[ \text{Loading}(t) = \text{start} \times (1+g)^t + \text{EV load}(t) - \text{PV relief}(t) \]
then reads off the mean. The Monte Carlo reframing replaces each term with a distribution and — critically — shares the growth drivers across the fleet so overload risk does not average away:
- Year-0 headroom — Beta scaled to [36%, 96%] loading. The fleet does not start uniform; some transformers are already near their rating, and those are the ones the tail comes from.
- Organic demand growth — Normal(1.1%, 0.6%)/yr, drawn once per future and applied across the whole fleet (a shared macro factor, not 300 independent draws).
- EV-charging adoption — a logistic S-curve with an uncertain ceiling (Beta scaled to 18%–55% of customers) and an uncertain midpoint year (Triangular 2028/2031/2034). Each adopted EV adds a coincident-peak load drawn LogNormal (mean ≈ 0.34 of rating, heavy right tail for clustered fast-charging).
- Rooftop PV — a second S-curve that trims only 12% of its nameplate at the early-evening system peak, so PV cannot be counted on to cancel EV growth.
Because organic growth and the EV ceiling are common factors across the fleet, a high-growth future loads every transformer harder at once. That correlation is exactly what an "average loading" number throws away — and it is the difference between 36 transformers in overload and the handful a naive independent model would predict.
Overload risk builds — and crosses the trigger around 2033
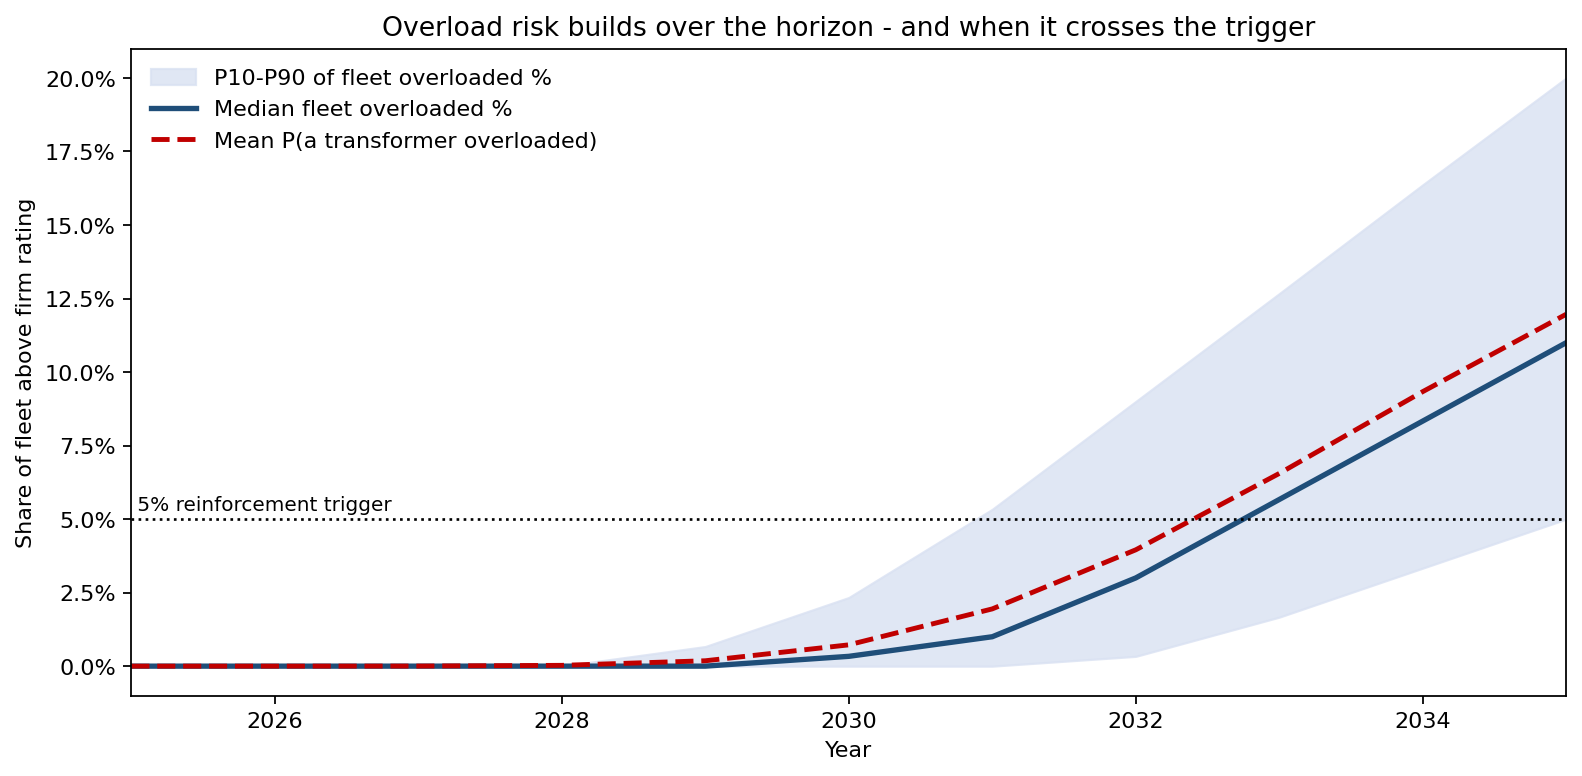
The share of the fleet above firm rating is essentially zero through 2028, then climbs steeply as the EV S-curve steepens. The median fleet-overload share crosses the planner's 5% reinforcement trigger around 2032–2033 and reaches 11% by 2035; the P90 future crosses the trigger two years earlier and ends near 20%. The widening P10–P90 cone is the planner's real problem: the timing of the reinforcement need is itself uncertain by several years, and that uncertainty is driven by how fast EVs actually arrive.
When does reinforcement become necessary?
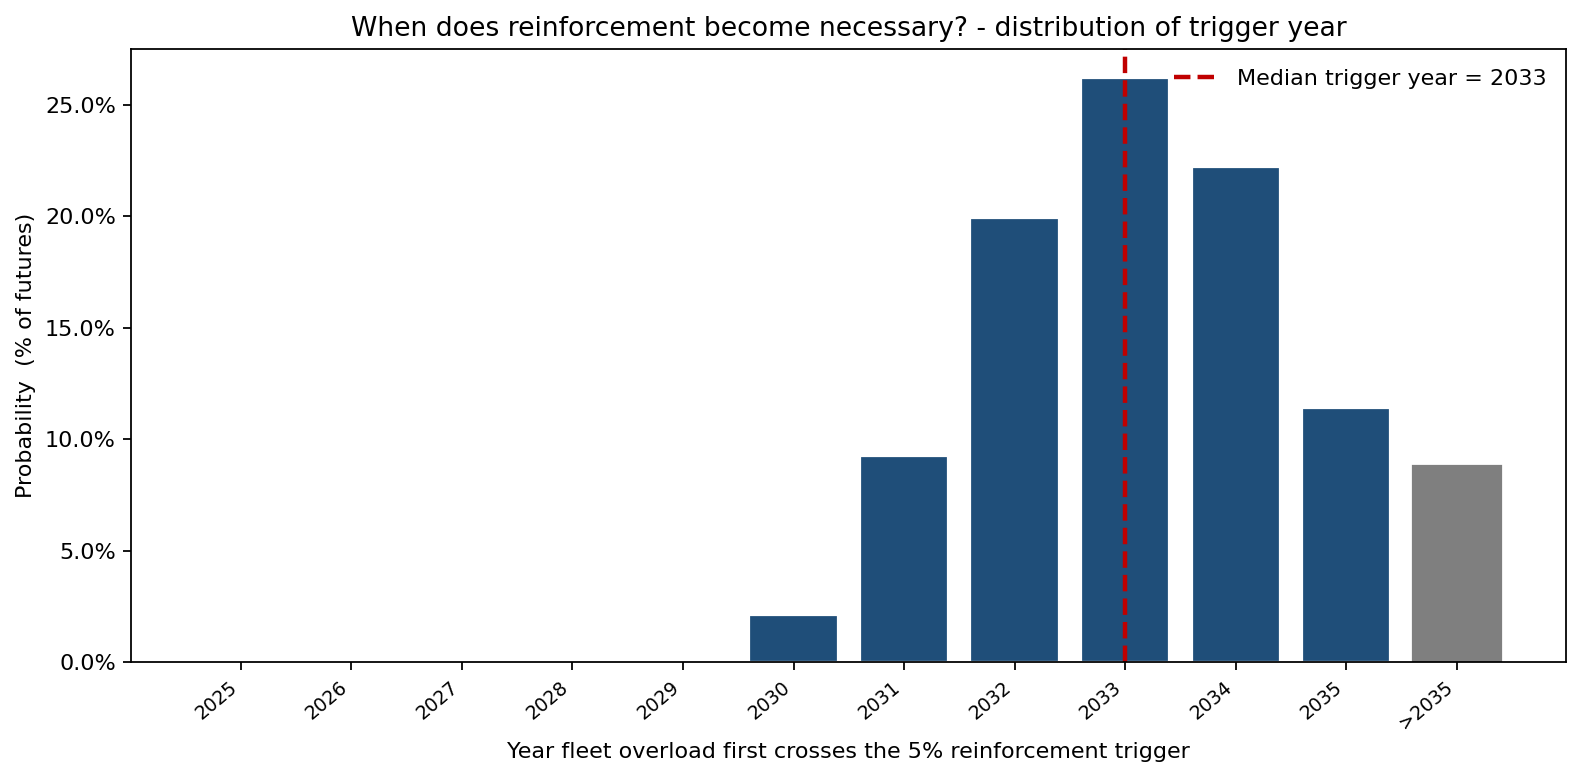
Collapsing each future to the first year its fleet overload crosses 5% gives the reinforcement-timing distribution. The trigger fires within the horizon in 91% of futures, with a median trigger year of 2033 and a P10 of 2031 — but 9% of futures don't trigger within ten years at all (the grey ">2035" bar). This is the planning answer a deterministic model cannot give: reinforcement is near-certain to be needed, most likely in 2033, but possibly as early as 2031 — which is what sizes the capital-plan ramp and the lead-time on long-delivery transformers.
What drives the tail
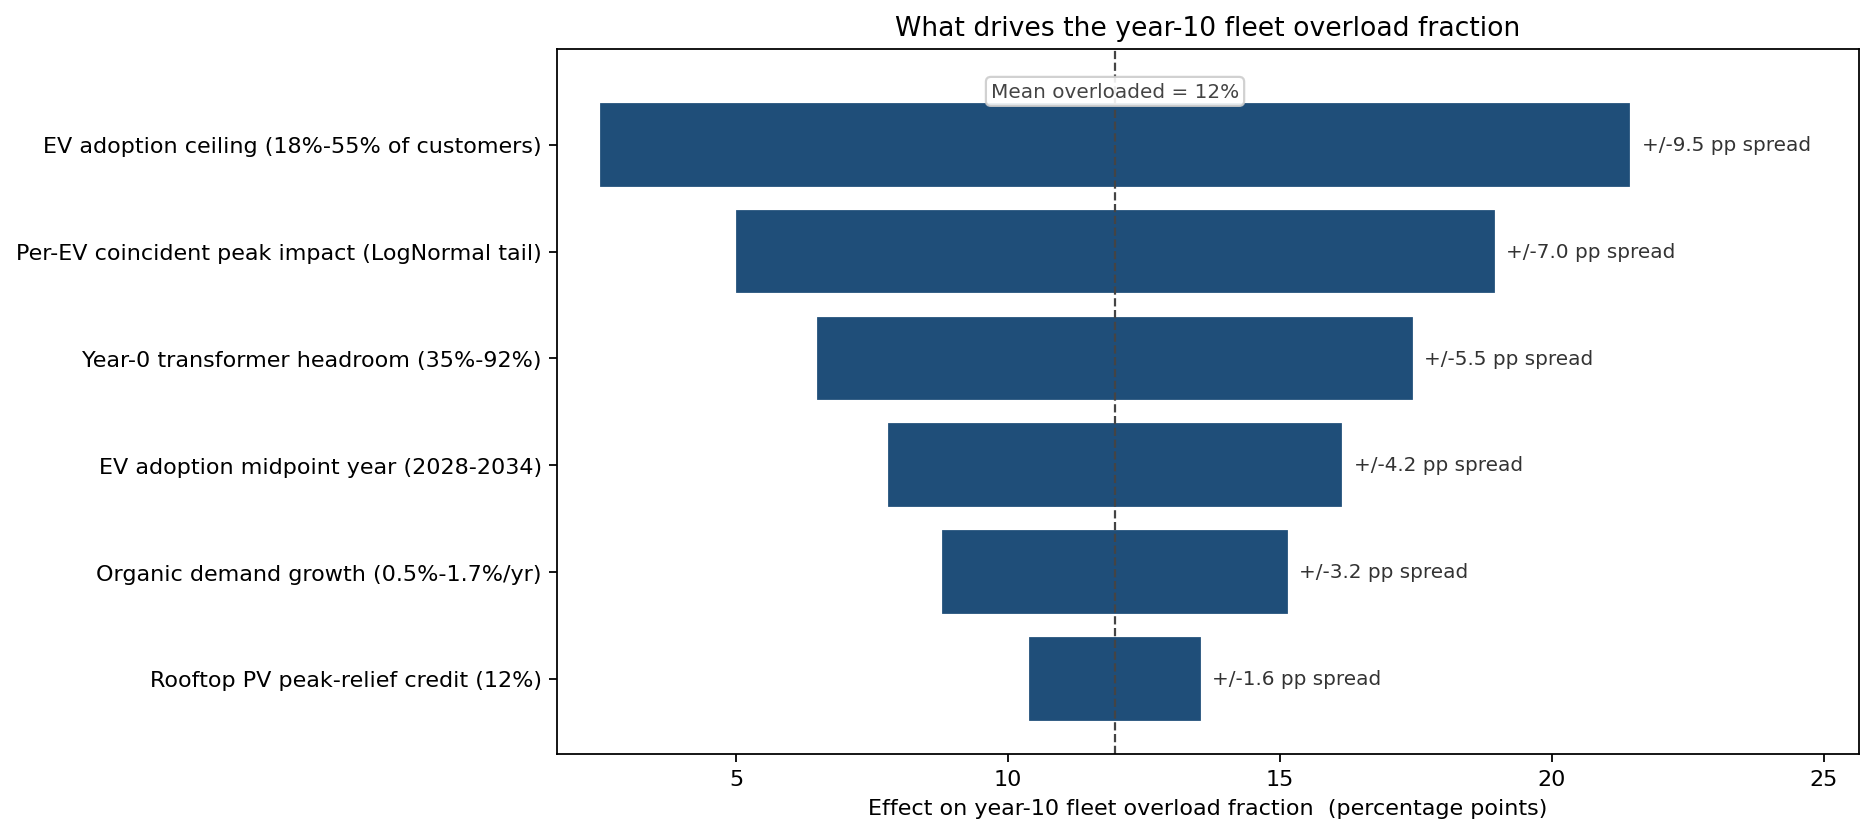
The EV adoption ceiling is the dominant driver of year-10 overload fraction — how many customers ultimately charge at home swamps everything else. The per-EV coincident peak impact (the LogNormal-tailed clustering risk) is second, followed by starting transformer headroom: the fleet that begins with thinner margins tips over sooner. Organic growth and PV relief are comparatively minor. The ranking tells the planner where data collection pays off most — metering EV charging behaviour beats refining the organic growth forecast.
What the model changed
- Reinforcement capital pulled forward to align with the 2031 P10 trigger rather than the 2033 median, buying lead time on long-delivery transformers for the worst-credible adoption paths.
- Mobile-spare stock revisited. With a mean of 36 overloaded transformers against 6 spares, the contingency plan was rebuilt around proactive replacement of the thin-headroom units rather than reactive swap-outs.
- Reinforcement targeted by starting headroom. Because year-0 headroom ranks third in the tornado, the units starting above 90% loading were prioritised regardless of their mean forecast.
- EV-charging telemetry program funded, since the EV ceiling and per-EV peak impact are the two largest drivers and the cheapest uncertainty to actually measure.
ModelRisk Functionality Used
- Beta, Normal, Triangular and LogNormal inputs for starting headroom, organic growth, EV adoption parameters and per-EV peak impact, composed into a year-by-year per-transformer loading formula in native Excel.
- Shared common factors — one organic-growth draw and one EV-adoption ceiling per simulated future, applied across all 300 transformers, so fleet-wide overload risk is correlated rather than washed out.
- Logistic S-curves with uncertain ceiling and midpoint to represent EV and PV adoption, rather than a single deterministic penetration trajectory.
- Fan chart of fleet overload share over a ten-year horizon with P10/P50/P90 bands, locating the reinforcement-trigger crossing in time.
- First-passage timing distribution (year the 5% trigger is first crossed) and a tornado on year-10 overload fraction to rank the drivers and aim the data-collection budget.
A distribution planner's firm-rating constraint is a hard line, but loading against it is a distribution that widens every year as EVs arrive. The deterministic "85% by 2035" looks safe precisely because it averages away the tail that does the damage — and Monte Carlo is what turns that hidden tail into a dated, sized reinforcement plan.