

Industry: Utilities
Product: ModelRisk
Application: Demand Response Capacity Commitment under Uncertainty
A 45 MW Capacity Commitment, a 23% Chance of Falling Short: Pricing the Reliability Risk in a Demand Response Program
A demand response (DR) aggregator clears 45 MW of summer-peak curtailment into the ISO capacity market and gets paid for it whether or not an event is called. The catch is delivery: when the ISO calls a peak event, the aggregator has to actually shed 45 MW from 120,000 enrolled customers. Miss it, and the ISO claws back capacity revenue pro-rata to the shortfall and adds a non-performance penalty. A deterministic plan multiplies an expected 62% participation by an expected 0.95 kW per customer, lands comfortably above 45 MW, and books the capacity revenue as good as banked.
Run the same event 200,000 times with participation, per-customer load, weather and price all uncertain, and a different picture emerges. The mean delivered reduction is 72.6 MW — but on 22.8% of called events the aggregator delivers less than the 45 MW it committed. The program is genuinely profitable, with a mean net value of $279k per event and a loss-making probability of just 0.1% — yet that 23% shortfall probability is the number that puts capacity revenue and a regulator's performance score at risk. A point estimate sees neither the cushion nor the cliff.
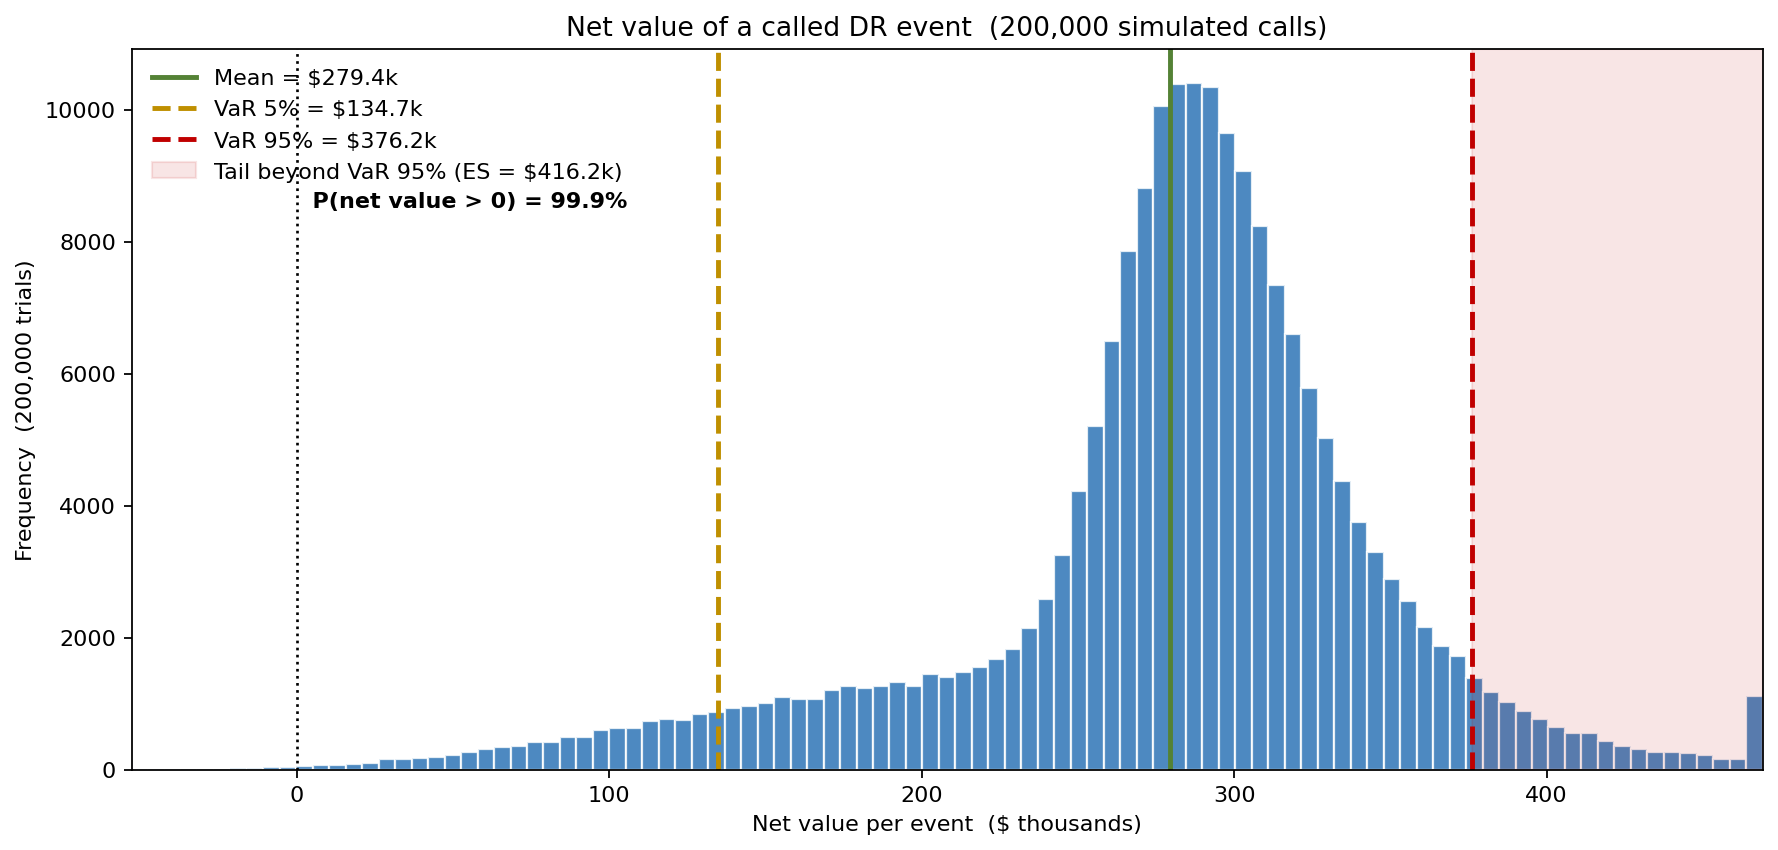
The net-value distribution per called event runs from a 5th-percentile (VaR 5%) of about $172k up to a 95th-percentile near $363k, around a $279k mean, with P10 = $184k and P90 = $351k. The program almost never loses money — but the spread is wide, and the left tail is driven by exactly the low-delivery events that also trigger the capacity-market clawback. The rest of this study is about where that spread comes from and how the incentive design trades net value against shortfall risk.
Why a point estimate fails here
The deterministic business case computes one number:
\[ \text{MW shed} = P \times L \times N \]
with participation \(P=62\%\), per-customer reduction \(L=0.95\) kW, and \(N=120{,}000\) customers, giving \(\approx 71\) MW — a comfortable 58% cushion over the 45 MW commitment. The trouble is that all three inputs move, and one of them moves together across the whole customer base:
- Participation rate — Beta(30, 18), mean 62%, the call-day opt-in fraction.
- Per-participant load reduction — LogNormal, mean ≈ 0.95 kW, right-skewed, and positively correlated with participation (engaged customers shed more) via a Gaussian copula, ρ = 0.45.
- Weather factor — Normal(1.0, 0.14): a hotter call day lifts sheddable A/C load. This is a shared common factor across all customers on the event, so it does not average away across 120,000 draws the way independent per-customer noise would. It is what keeps the delivered-MW distribution wide instead of collapsing to its mean.
- Peak/off-peak energy spread — Triangular($80, $160, $420)/MWh, driving the avoided-energy component of value.
- Program cost — Triangular($40k, $65k, $110k) per event for incentives and dispatch admin.
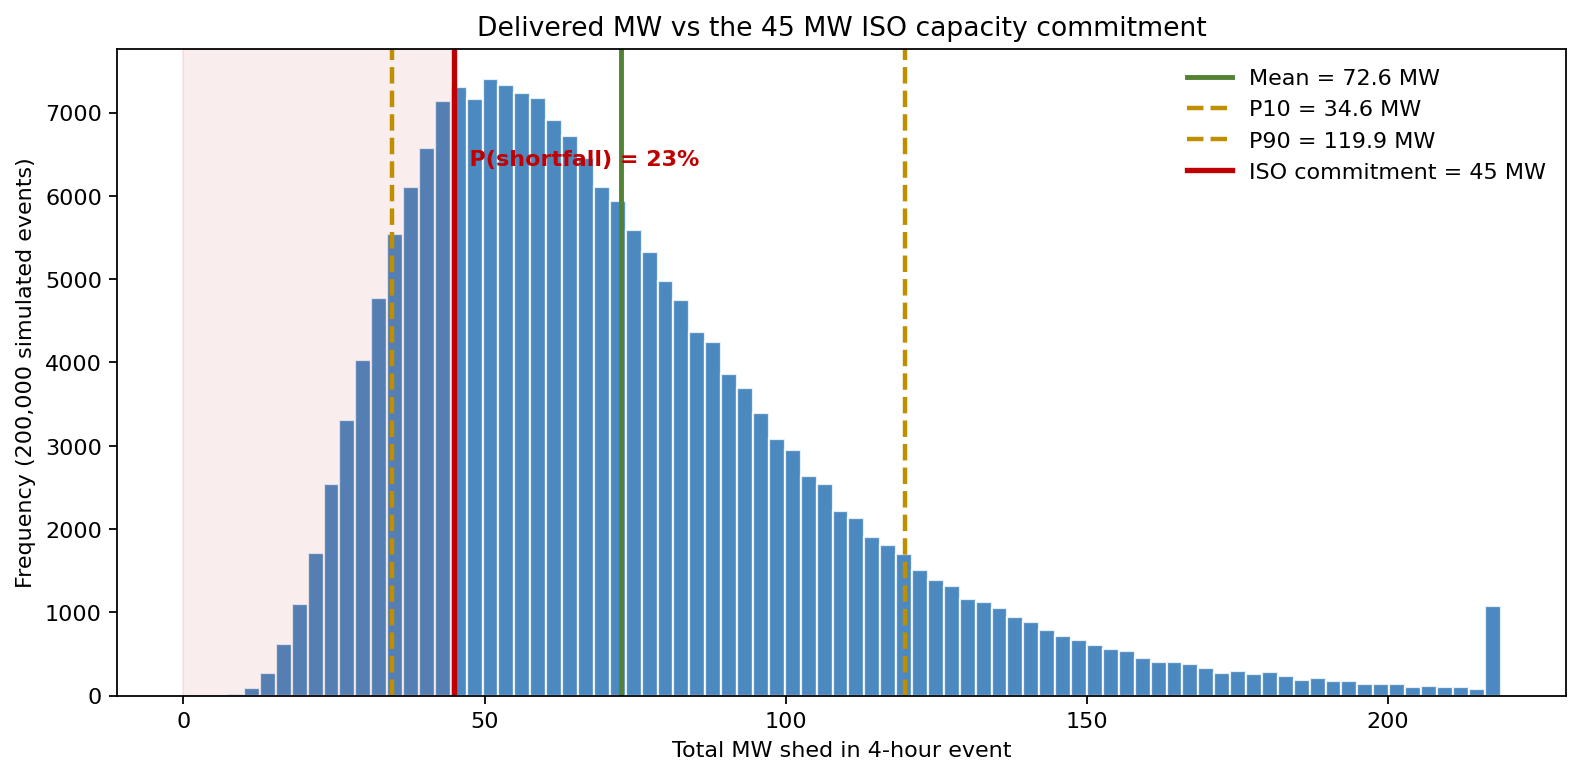
Delivered MW spans P10 = 34.6 MW to P90 = 119.9 MW around a 72.6 MW mean and a 65.1 MW median — a right-skewed spread far too wide to summarise with a single figure. The 45 MW commitment line cuts through the lower body of the distribution: the entire mass to its left is the 22.8% of events where the aggregator under-delivers and the ISO claws capacity revenue back pro-rata. That shortfall probability — not the comfortable mean — is the operative reliability metric.
How incentive design trades value against reliability
The aggregator can dial the incentive level, which shifts participation but also program cost. The model re-runs the full simulation under three designs, holding the same weather, copula and price structure so the curves are directly comparable.
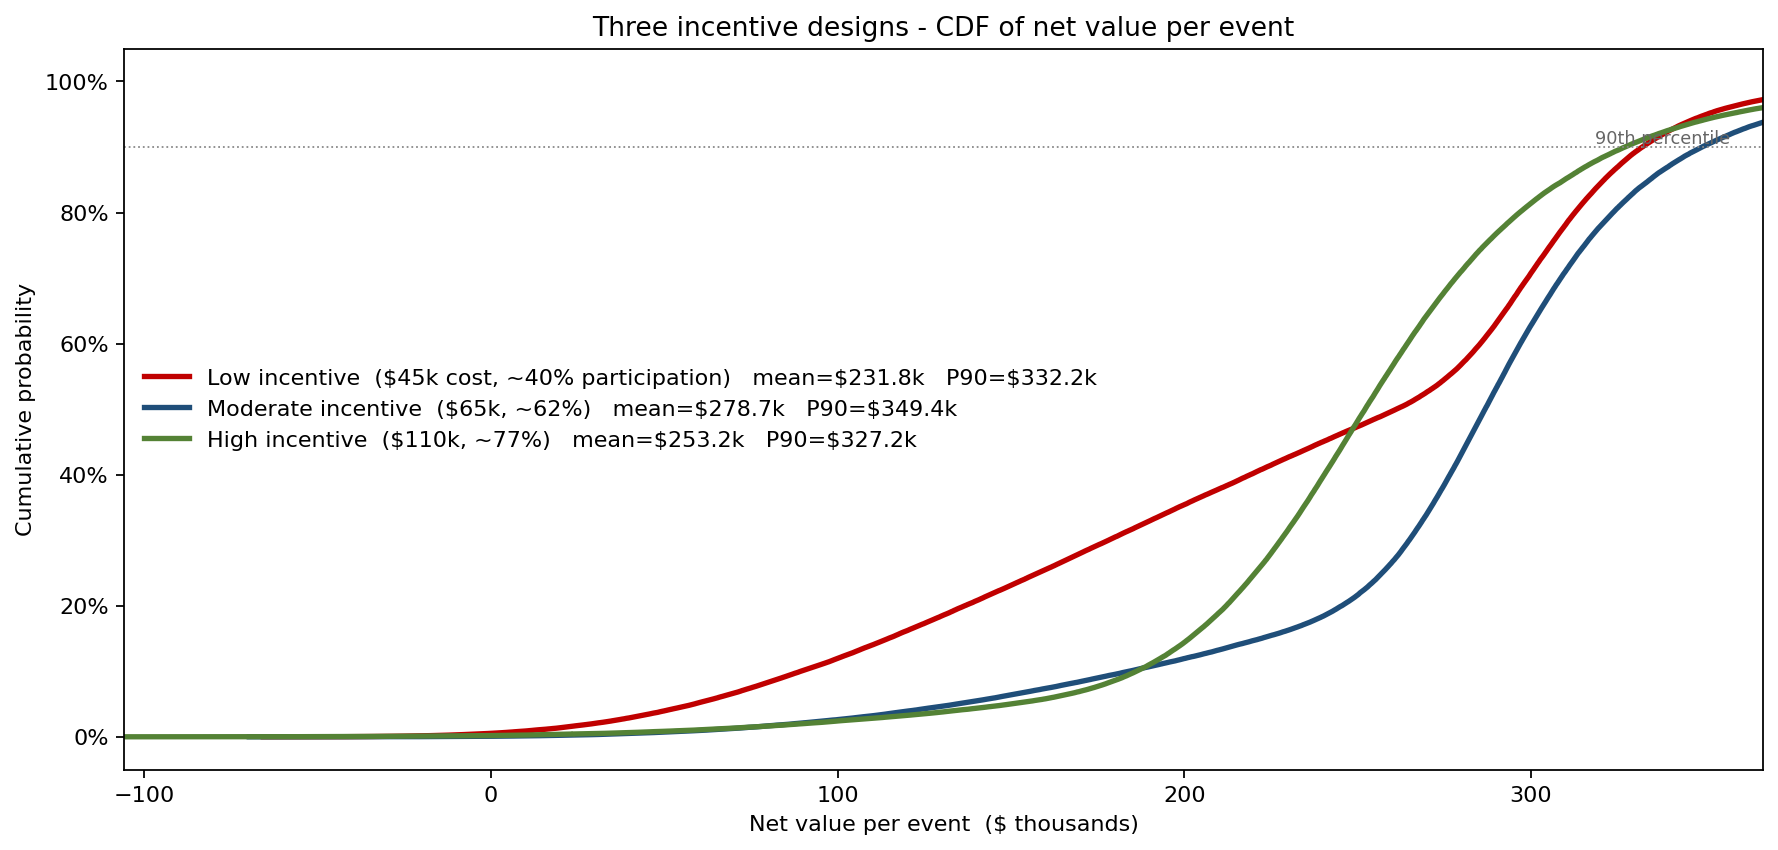
- Low incentive ($45k cost, ~40% participation): mean $232k, P10 $89k, but a 57% shortfall probability — cheap, but it routinely fails the commitment.
- Moderate incentive ($65k, ~62%): mean $279k, P10 $184k, shortfall 22% — the highest net value of the three.
- High incentive ($110k, ~77%): mean $253k, P10 $186k, shortfall 11% — the most reliable, but the extra incentive spend pulls the mean back below moderate.
This is the central trade-off a deterministic model cannot show: moderate incentives maximise expected net value, but only the high tier buys the shortfall probability down to single figures. If the capacity contract carries a hard performance penalty or a regulator-tracked reliability score, the aggregator may rationally pay for the high tier and accept the ~$26k/event of expected value it gives up — a choice that is invisible until both the value distribution and the shortfall probability are on the table together.
What drives the spread
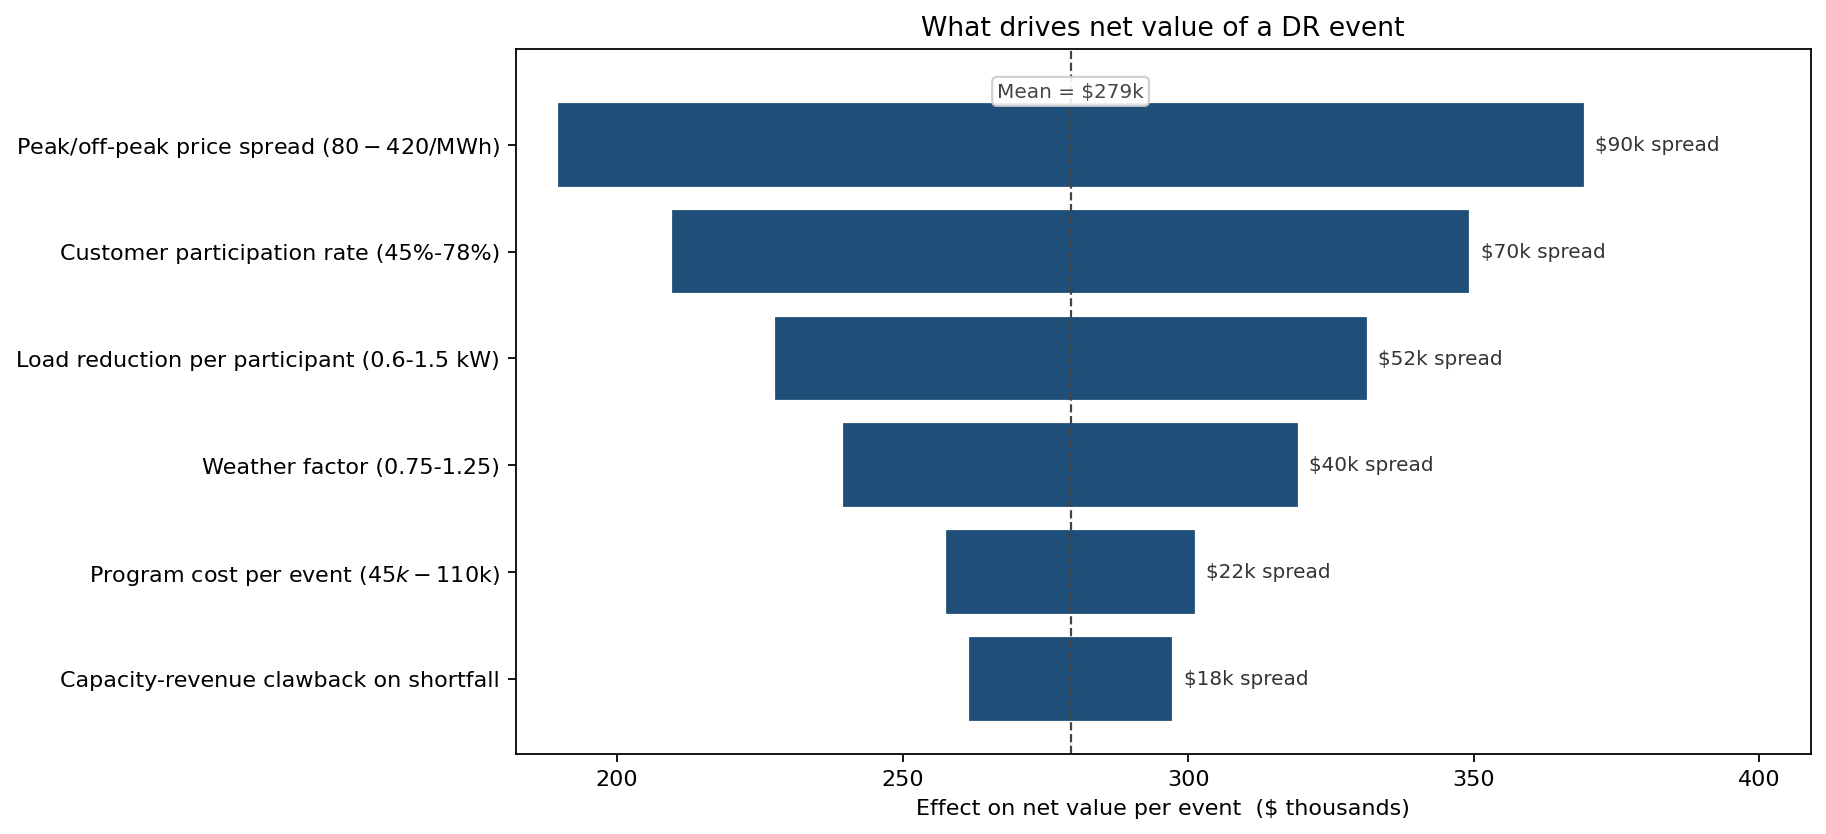
The peak/off-peak price spread is the single largest driver of net-value uncertainty — the avoided-energy component scales linearly with it and the $80–$420/MWh range is enormous. Participation rate is second and is the lever the aggregator most directly controls through incentive design. Per-participant load and the shared weather factor follow; program cost and the capacity-revenue clawback are smaller but asymmetric, since the clawback only bites on the low-delivery tail.
What the model changed
- Incentive tier reset to the high design for capacity-obligated events, trading ~$26k/event of expected value for a shortfall probability cut from 22% to 11% — a deliberate purchase of reliability, sized against the contract's non-performance penalty.
- Commitment right-sized. With a 23% shortfall probability at 45 MW under the moderate design, the cleared commitment was trimmed for risk-sensitive auction periods rather than chasing the mean 72.6 MW.
- Weather treated as a portfolio-wide common factor, not per-customer noise — the change that keeps the delivered-MW distribution honestly wide and prevents the model from understating shortfall risk.
- Recruitment targeted at high-shed, high-engagement segments to exploit the participation–load correlation the copula captured.
ModelRisk Functionality Used
- Beta, LogNormal, Normal and Triangular inputs for participation, per-customer load, weather and price spread, composed into a single per-event net-value formula in native Excel.
- Gaussian copula linking participation to per-participant reduction (ρ = 0.45), so engaged customers shed more — modelled with paired draws rather than independent sampling.
- A shared weather common factor applied across the whole enrolled base, preserving the aggregate-MW spread that independent sampling would have collapsed.
- Scenario CDFs of net value under three incentive designs, run on a common simulation so the curves are true differences, not sampling noise.
- Tornado sensitivity on net value per event, ranking the price spread and participation as the dominant drivers and pointing recruitment and hedging effort at them.
In a capacity-market DR program the cleared MW number on the contract is a commitment, but the delivered MW is a distribution. The aggregator gets paid on the commitment and judged on the delivery — and the gap between them, here a 23% chance of falling short, is precisely what Monte Carlo makes visible and a point estimate hides.