

Industry: Transportation
Product: ModelRisk
Application: Traffic Congestion Modeling on an Urban Arterial Corridor
When V/C = 0.90 Hides the 28% Chance of Gridlock: Probabilistic BPR Modeling of a 4.8-Mile Arterial
A US metropolitan transportation authority almost approved $28M to widen a 4.8-mile signalized arterial because the deterministic congestion model predicted a peak-hour volume-to-capacity (V/C) ratio of 0.90 — comfortably under the 1.00 failure threshold — but commuters were reporting daily breakdowns and travel times above 20 minutes on a corridor with an 8.2-minute free-flow baseline. The disconnect was not a calibration error. It was the assumption itself: V/C of 0.90 is the mean of a distribution whose 90th percentile sits at 1.18 and whose 99th percentile reaches 1.49. The Bureau of Public Roads (BPR) travel-time function is sharply convex in V/C; averaging the inputs and then evaluating the BPR formula understates the mean travel time on a corridor near the failure point — and erases the tail entirely.
The clearest picture is the corridor's full travel-time distribution. Evaluating the BPR at the mean V/C gives a tidy 8.7 minutes; sampling V/C from the joint distribution and then applying the BPR produces a heavily right-skewed curve with a mean of 10.3 minutes, a P90 of 12.7 minutes, and a P99 of 37.8 minutes — a tail four-and-a-half times the free-flow time that the point estimate cannot show.
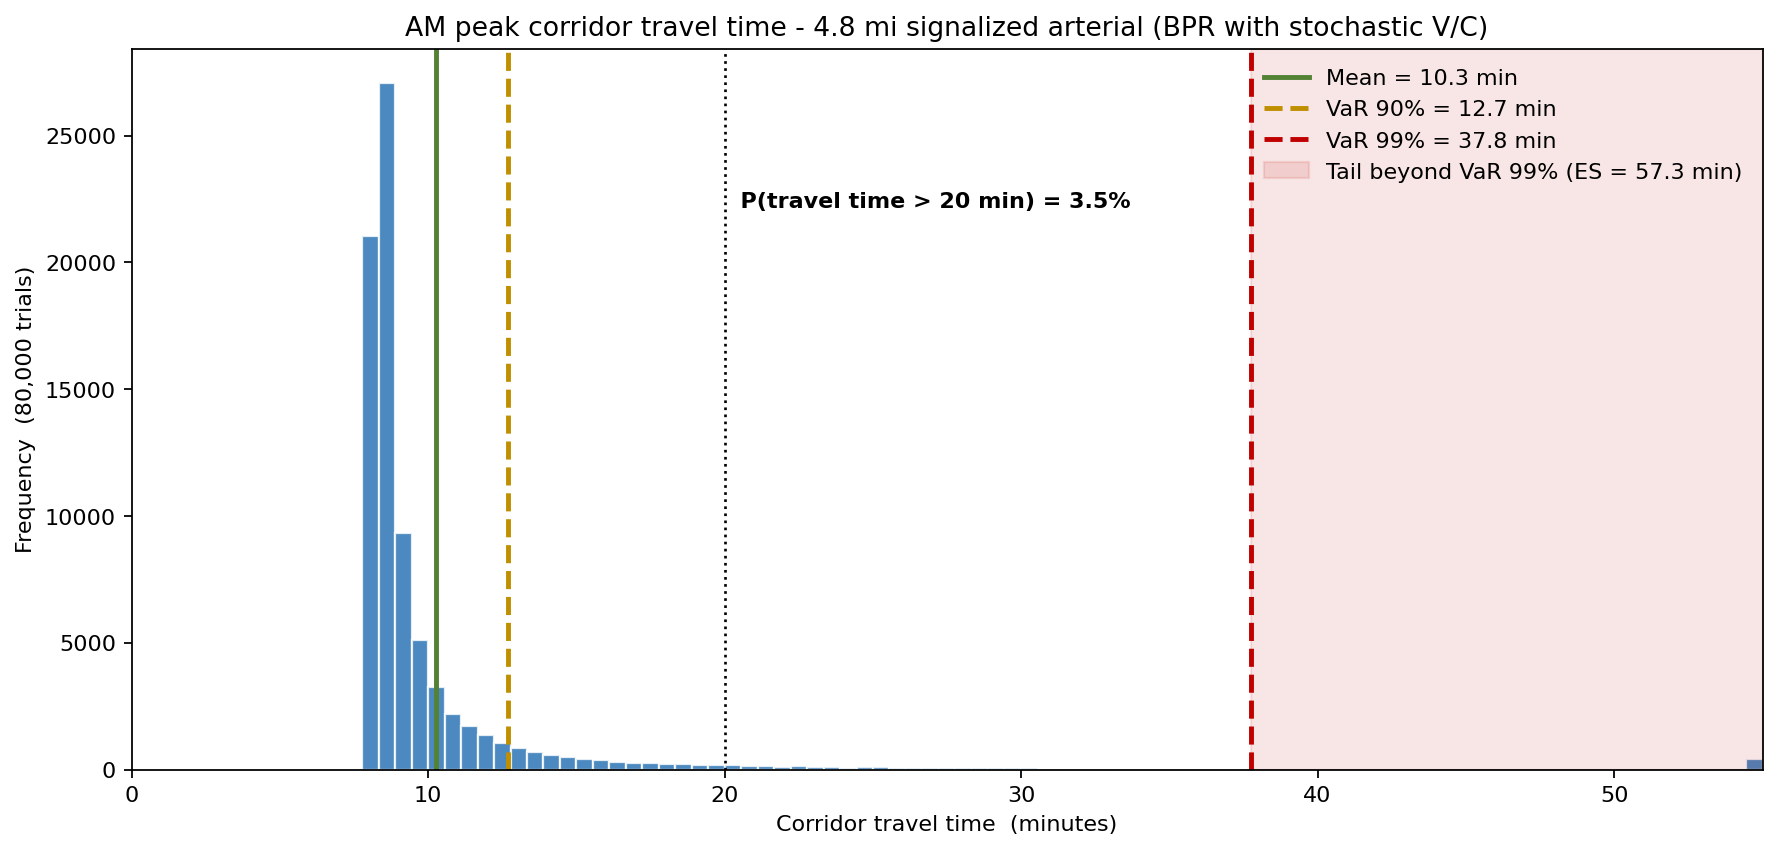
The authority rebuilt the corridor model in ModelRisk: peak volume is a LogNormal, effective capacity is a Triangular (degraded by weather and incidents), and the BPR convexity is preserved by Monte Carlo rather than smoothed out by averaging. The simulation produces the full travel-time distribution above that the deterministic model could not.
Why LogNormal volume, Triangular capacity, and a Jensen-aware BPR
Peak-hour AM volume on the corridor is bounded below by trip generation rates and unbounded above on event days — the empirical distribution from five years of loop-detector data is right-skewed with a mean of 2,900 vph and a CV of 0.22. A LogNormal fit captures the 99th percentile near 4,700 vph; the previous Normal fit truncated the tail and missed it.
Effective capacity is not the nominal 3,400 vph that the HCM lookup tables give. Lane drops from incidents, signal mistiming and adverse weather (drizzle, fog, freezing rain) shave capacity. A Triangular(2,700, 3,400, 3,600) reflects empirical low/mode/high counts from a 2023 capacity audit. The asymmetry — the long downward tail — matters: capacity rarely beats the design value but routinely loses 700 vph on a bad-weather day.
Applying the BPR
travel_time = t0 × (1 + α × (V/C)^β) with t0 = 8.2 min, α = 0.15, β = 8
at the mean V/C of 0.90 produces 8.7 minutes. Sampling V/C from the joint distribution and then evaluating the BPR produces a mean travel time of 10.3 minutes, a P90 of 12.7 minutes, and a P99 of 37.8 minutes. (The steep β = 8 exponent — rather than the HCM β = 4 default — is the standard correction for an oversaturated signalized arterial, where the BPR otherwise understates oversaturated delay.) That P99 — nearly half an hour of corridor travel — is what residents are experiencing one rush hour in every hundred. The deterministic model literally could not produce it.
Deterministic said V/C = 0.90. Monte Carlo said P(V/C > 1) = 28%.
The simulation reports:
| Metric | Deterministic | Monte Carlo |
|---|---|---|
| Mean travel time | 8.7 min | 10.3 min |
| P90 travel time | n/a | 12.7 min |
| P(V/C > 1.0) | 0% | 28% |
| P(V/C > 1.2, severe congestion) | 0% | 8.6% |
| P(travel time > 20 min) | 0% | 3.5% |
Roughly twenty-eight percent of weekday AM peaks exceed capacity; about three-and-a-half percent push the corridor above 20-minute travel time. The deterministic model said it never happens because it averaged the inputs.
Three demand-growth regimes and one mitigation
Demand on the corridor is forecast to grow 6% over three years from upstream zoning changes. The simulation evaluates that growth two ways:
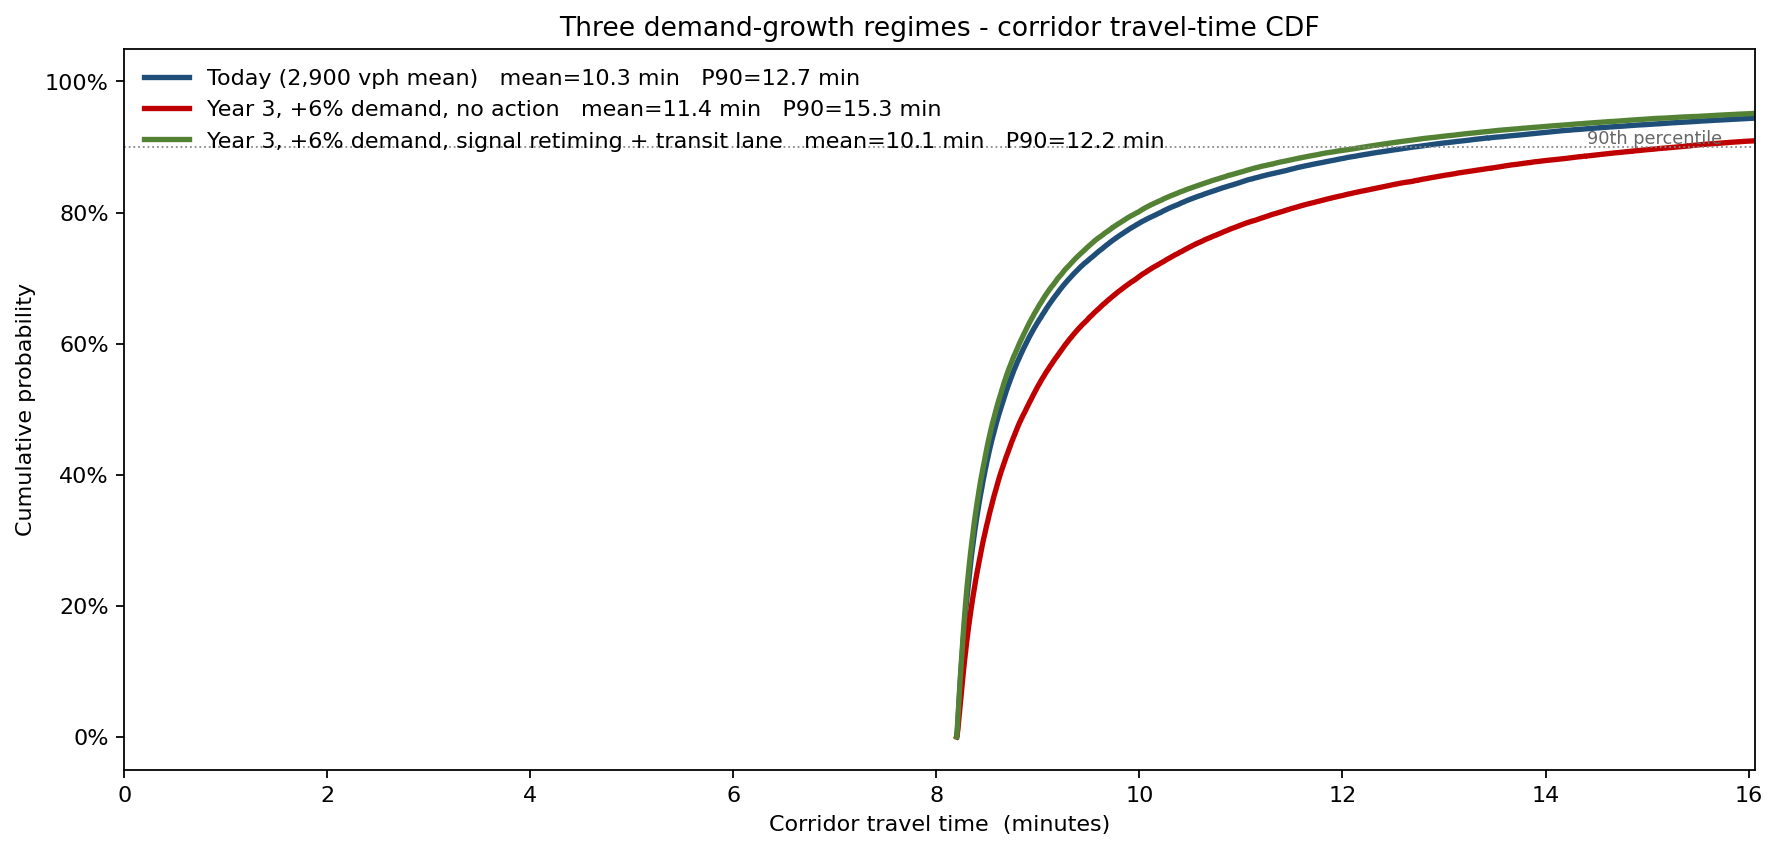
- Today (2,900 vph mean) — P90 travel time 12.7 min; P(travel time > 20 min) 3.5%.
- Year 3, +6% demand, no action — P90 travel time 15.3 min; P(travel time > 20 min) jumps to 6.0%.
- Year 3, +6% demand, signal-coordination retiming + part-time bus-only lane — P90 travel time 12.2 min, P(travel time > 20 min) back to 3.0%.
The mitigation package — $4.3M for adaptive signal hardware and operational changes vs the $28M road widening that was on the table — wins on every percentile. The probabilistic comparison was what reframed the capital-program priorities.
Pareto of discrete delay sources
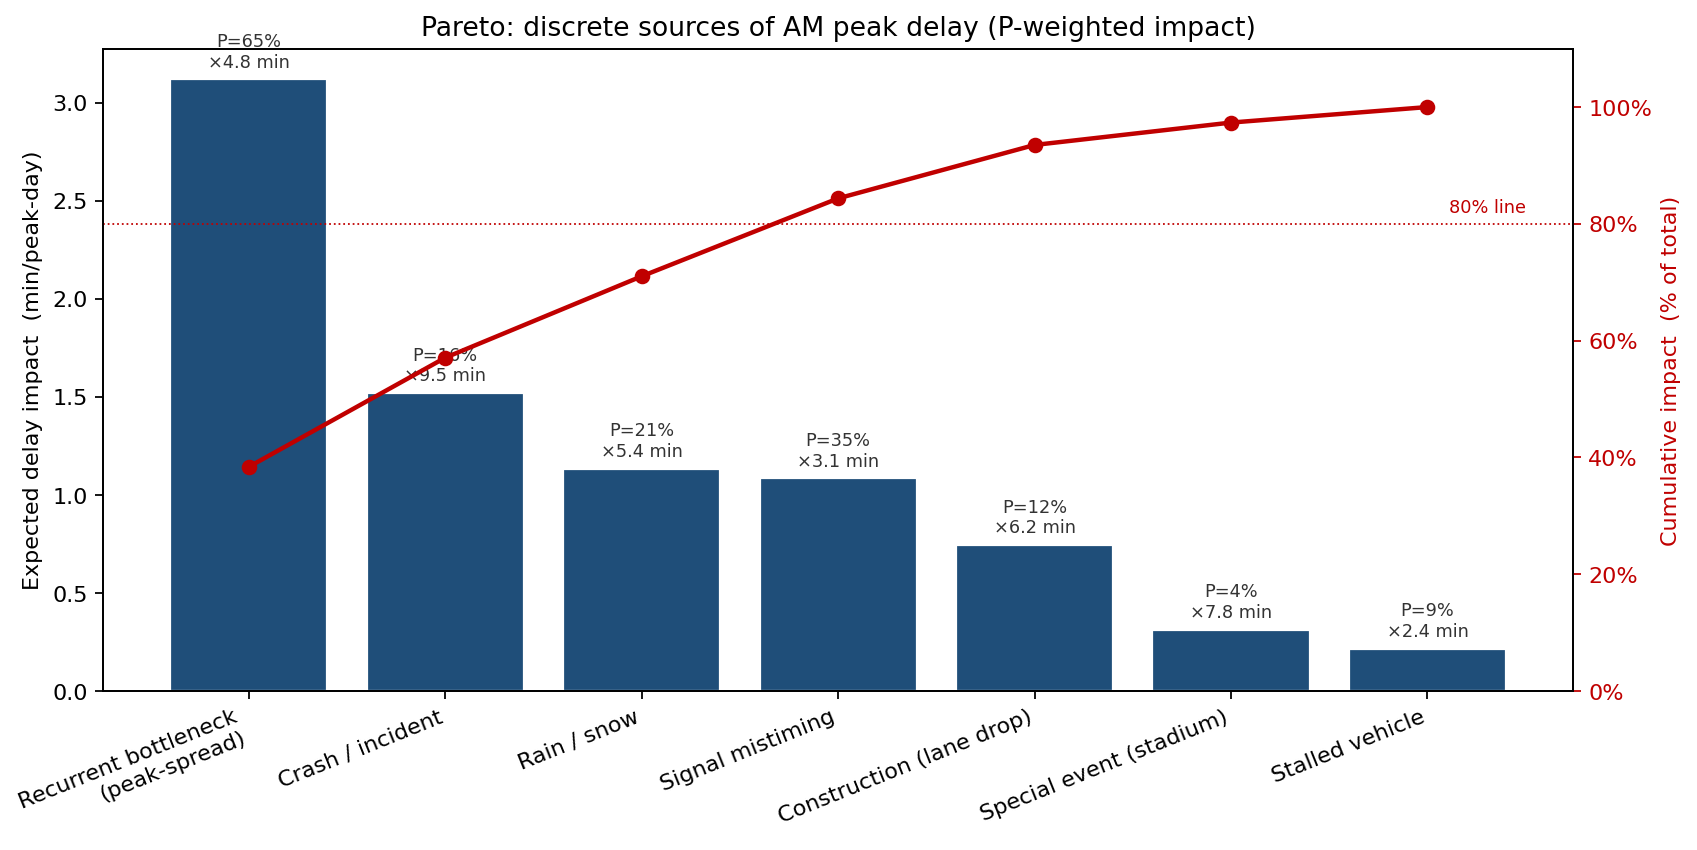
Among discrete events on the corridor, the recurrent bottleneck at the I-285 interchange (P = 65% per peak-day, 4.8 min expected delay) generates the most aggregate delay. Crashes are rarer (P = 16% per peak-day) but the per-event delay is 9.5 minutes — heavy tail, big stake — putting them second on the P-weighted ranking, ahead of rain/snow (P = 21%, 5.4 min). The Pareto top three cumulatively cause 71% of corridor delay; ranking the interventions against this list gave a defensible cost-per-minute-saved comparison.
What actually moves the mean travel time
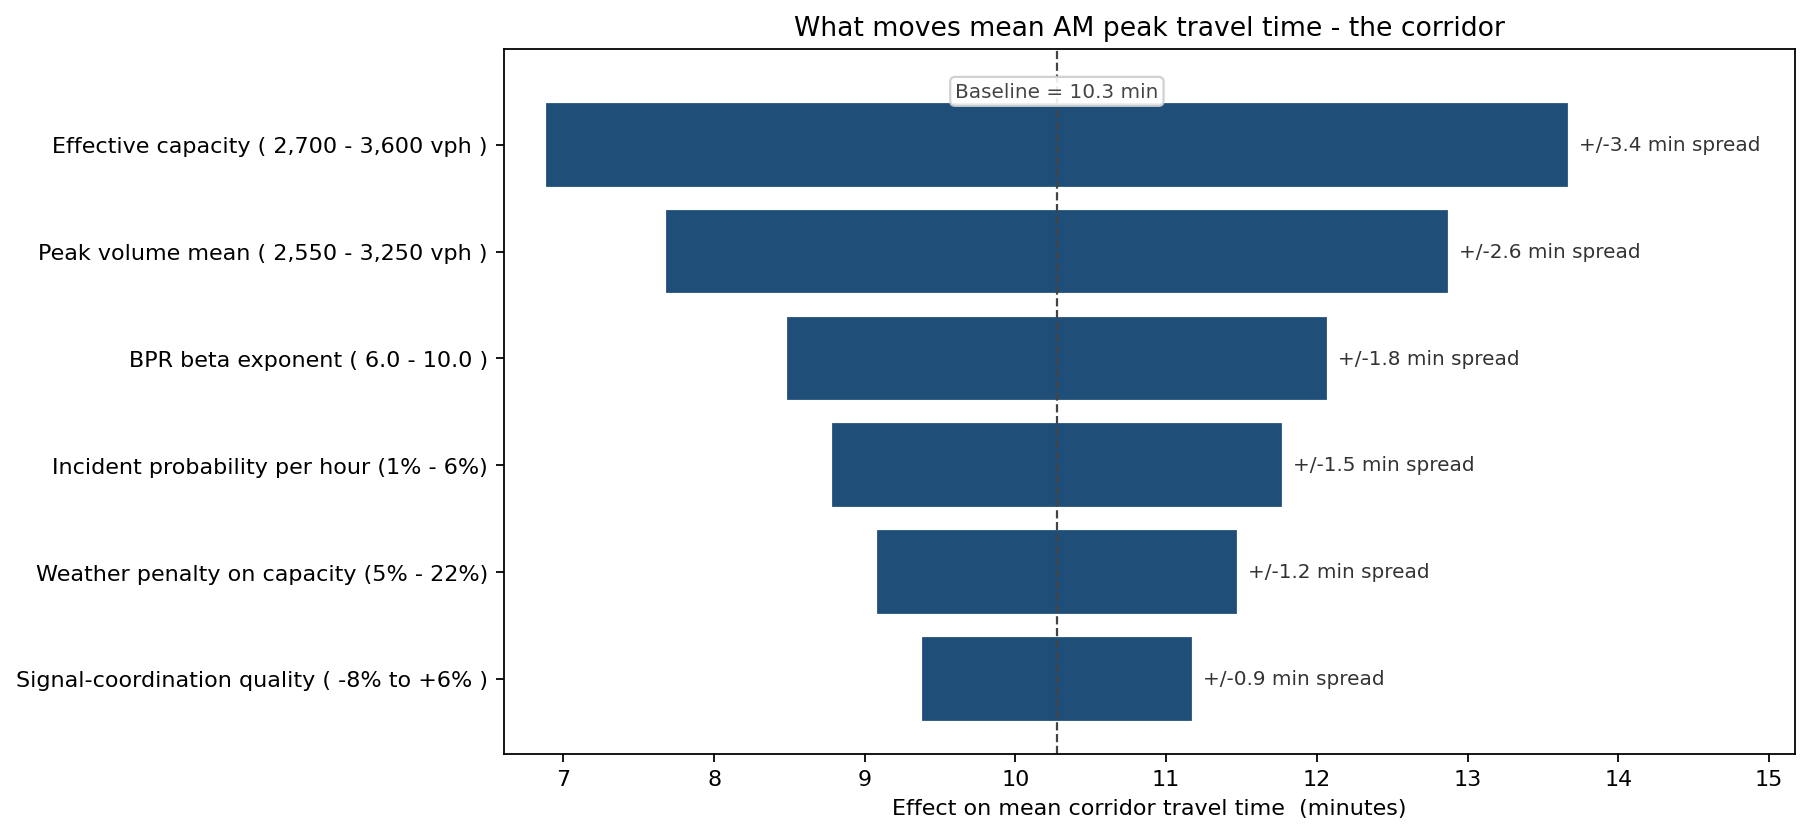
Effective capacity dominates: a swing across the capacity distribution (from a weather-and-incident-stripped 2,700 vph low to the design-value 3,600 vph high) moves mean travel time by ±3.4 minutes. Peak volume mean is next (±2.6 minutes over a 700 vph range). The BPR β exponent — which the team calibrated to 8 from segment-level fits of oversaturated behaviour — accounts for ±1.8 minutes; that input alone justified preserving the steep BPR in the probabilistic engine rather than substituting a linear approximation.
What the model changed
- The road-widening was deferred. The probabilistic comparison showed the signal-coordination + bus-lane package delivered a Year-3 P90 travel-time improvement (15.3 → 12.2 min) the road widening could not match on a per-dollar basis, saving $24M of capital deferred.
- Capacity-protection investments prioritized. Because effective capacity was the top tornado driver, the authority funded incident-management technology (additional cameras, automated incident detection on the corridor) rather than further demand modeling.
- Communication with the public changed. "There is a better-than-one-in-four chance the corridor exceeds capacity on any given weekday morning" landed in two council meetings where "the V/C ratio is 0.90" had not.
- Annual driver cost quantified. With per-commuter VOT at $19/hr, the simulation produced an expected annual delay cost per commuter on this corridor of $164, with a P90 of $356 — numbers that anchored the benefit-cost ratio for the mitigation package.
ModelRisk Functionality Used
- LogNormal peak-hour volume (mean 2,900 vph, CV 0.22) fitted from 5 years of loop-detector data, replacing the Normal fit that truncated the high-volume tail (99th percentile near 4,700 vph).
- Triangular effective-capacity distribution (2,700 / 3,400 / 3,600 vph) reflecting the empirical asymmetry between best-case and degraded conditions.
- BPR travel-time function (α = 0.15, β = 8) applied inside the simulation loop, preserving the near-saturation convexity that produces an 18% understatement of mean travel time — and the entire right tail — when inputs are averaged first.
- Scenario simulation across three demand regimes with the mitigation package modeled by shifting the capacity Triangular up and trimming the volume LogNormal mean — directly producing the Year-3 P(travel time > 20 min) drop from 6.0% to 3.0%.
- Pareto ranking of discrete delay events that produced the top-three contributors covering 71% of corridor delay.
- Tornado that identified effective capacity as the dominant driver and steered the capital-investment priority toward incident-management technology.
Modeling a congested corridor with point estimates is asking a convex function to behave linearly. ModelRisk gave the authority the corridor's full travel-time distribution — and a P(V/C > 1) of 28% says everything that V/C = 0.90 cannot.