

Industry: Transportation
Product: ModelRisk
Application: Supply Chain Logistics
When a $2,850/FEU Mean Hides a $4,200 P90: Probabilistic Logistics for a 4-DC Retail Network
A US big-box retailer with four regional DCs feeding 380 stores blew through its 2024 logistics budget by $7M — about 10% over plan — even though every individual cost forecast looked "on average" correct. The deterministic supply-chain model used point estimates for ocean spot rates ($2,850 per FEU), DC throughput (95k cases/week per DC), and diesel-linked outbound rates ($0.92/case). The simulation rebuilt with ModelRisk showed that the mean of the product is not the product of the means: the ocean spot rate's 90th-percentile sits near $4,200 (and its right tail runs past $4,700), demand at three DCs co-spiking on the same Black-Friday week, and a port disruption that pushed two weekly cycles well above plan — those combinations sat in the joint tail that the deterministic plan was structurally blind to.
The rebuilt model treats every cost-driver and demand stream as a distribution, links the four DCs with a Gaussian copula (cross-DC weekly demand correlation 0.55, fitted from five years of POS data), and runs the network for 60,000 simulated weeks. The output is not "the budget"; it is a P90 weekly landed-cost ceiling that procurement can hedge to and a stockout-probability surface that the inventory team can compare against the cost of holding more safety stock.
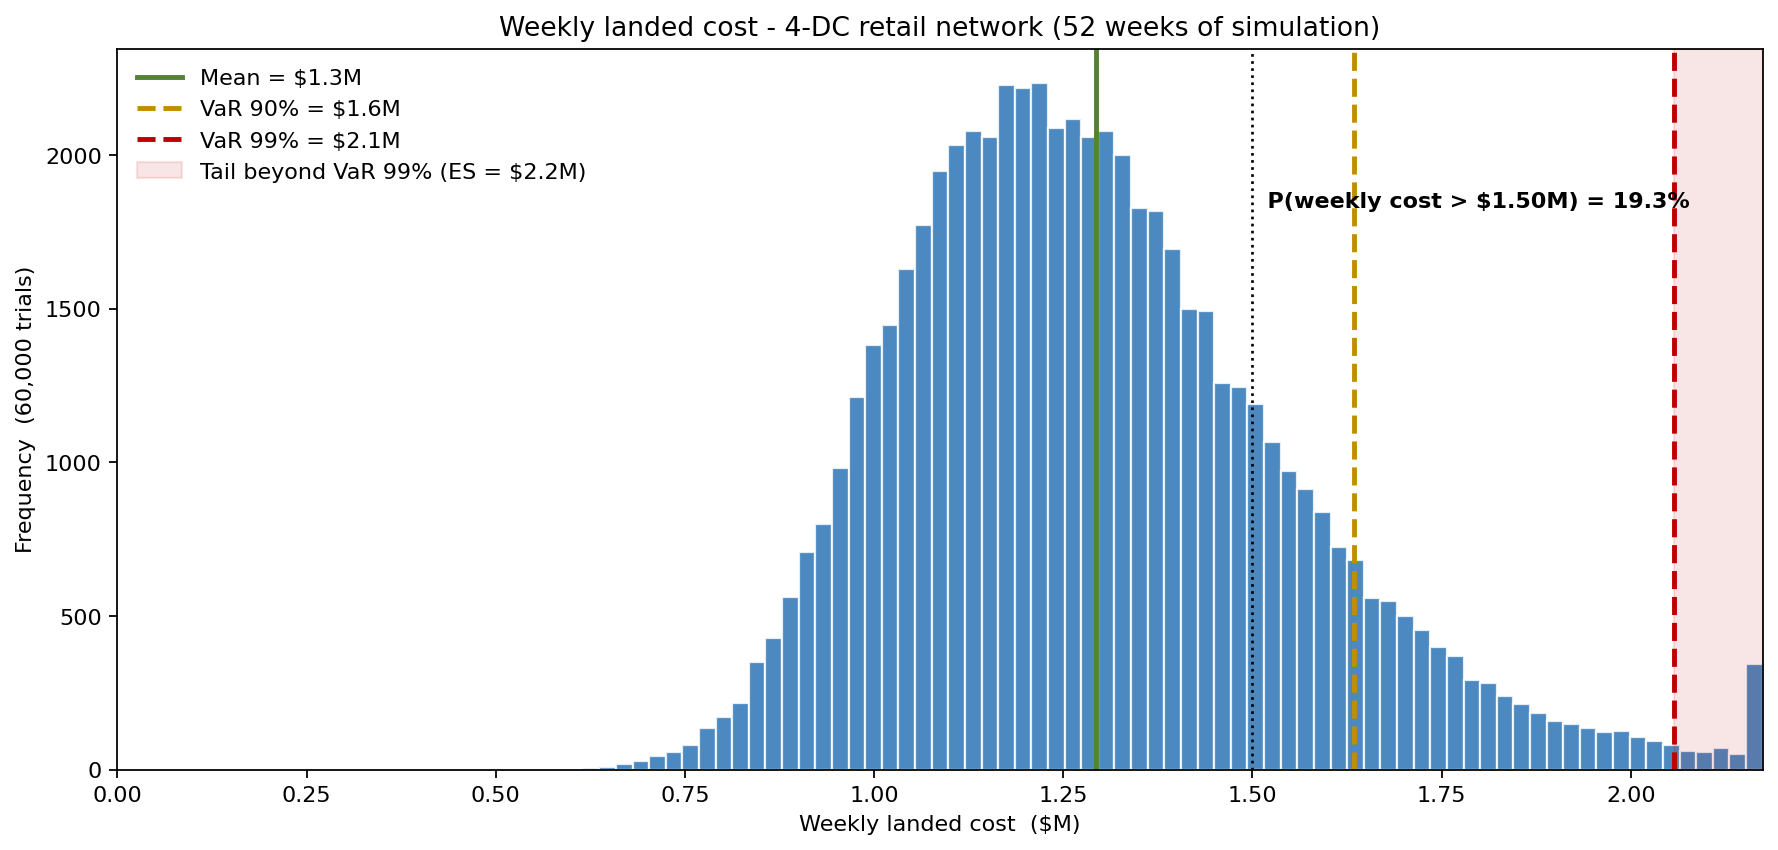
The simulated weekly landed cost is right-skewed: the mean is $1.3M, the 90th-percentile week is $1.6M, and the 99th-percentile week reaches $2.1M. Nearly one week in five (19%) breaches the $1.5M line that procurement treats as its cash-flow alarm — a tail the deterministic plan's single weekly average could never expose.
Weekly demand is over-dispersed and co-moves across DCs
Weekly outbound case-volume per DC is not Normal — it is Negative Binomial with mean 95k–112k cases and a shape parameter \(r = 42\), giving each DC a weekly coefficient of variation near 0.15 (well above the vanishingly small spread a Poisson at this volume would imply). The over-dispersion comes from promo weeks and weather-driven category shifts that move multiple stores in the same direction.
Then the four DCs do not move independently. Hurricanes affect Atlanta and Dallas together; a college-football weekend lifts the Southeast pair simultaneously; a polar vortex lifts the Chicago and Newark pair. A Gaussian copula with off-diagonal 0.55 captures the joint-tail behaviour the marginals alone miss. With independence assumed, the network-wide P90 weekly demand is 386k cases; with the fitted copula, it is 407k cases — a 6% understatement that propagates straight into the cost tail.
Landed cost per case is a sum of four heavy-tailed inputs
For an imported SKU the per-case landed cost is:
- Ocean spot (Long Beach + Savannah blend): LogNormal $/FEU, mean $2,850, CV 0.35. The fitted CV came from 2022–2024 SCFI data and captures the 2024 Red-Sea reroute spike that pushed two months above $4,000.
- Drayage: Triangular(310, 425, 640) $/FEU. Two-leg average per inbound container.
- DC handling: LogNormal mean $0.84/case, CV 0.18.
- Outbound LTL: linear in diesel, where diesel is modelled as an Ornstein–Uhlenbeck process around $3.78/gal with long-run vol 13% — not GBM, which is wrong for a mean-reverting benchmark backed by the strategic petroleum reserve.
Total per-case landed cost: mean $3.70, P10 $3.04, P90 $4.45 (ocean $1.54 + drayage $0.40 + DC handling $0.84 + outbound LTL $0.92 on the mean). A point-estimate of $3.70 hides a P90 that is 20% higher.
Deterministic said $67M; Monte Carlo said the P90 is $77M
The deterministic annual forecast — point-estimate per-case landed cost times point-estimate annual cases — landed on the baseline mean of $67M. The simulation, integrating 52 weekly draws with the copula, a per-year freight-regime shock, and the port-disruption process, produced:
| Scenario | Mean annual cost | P90 annual cost |
|---|---|---|
| Optimistic (calm Pacific, $3.58 diesel) | $65M | $74M |
| Baseline (normal ops, $3.78 diesel) | $67M | $77M |
| Adverse (port disruption + $4.23 diesel) | $71M | $82M |
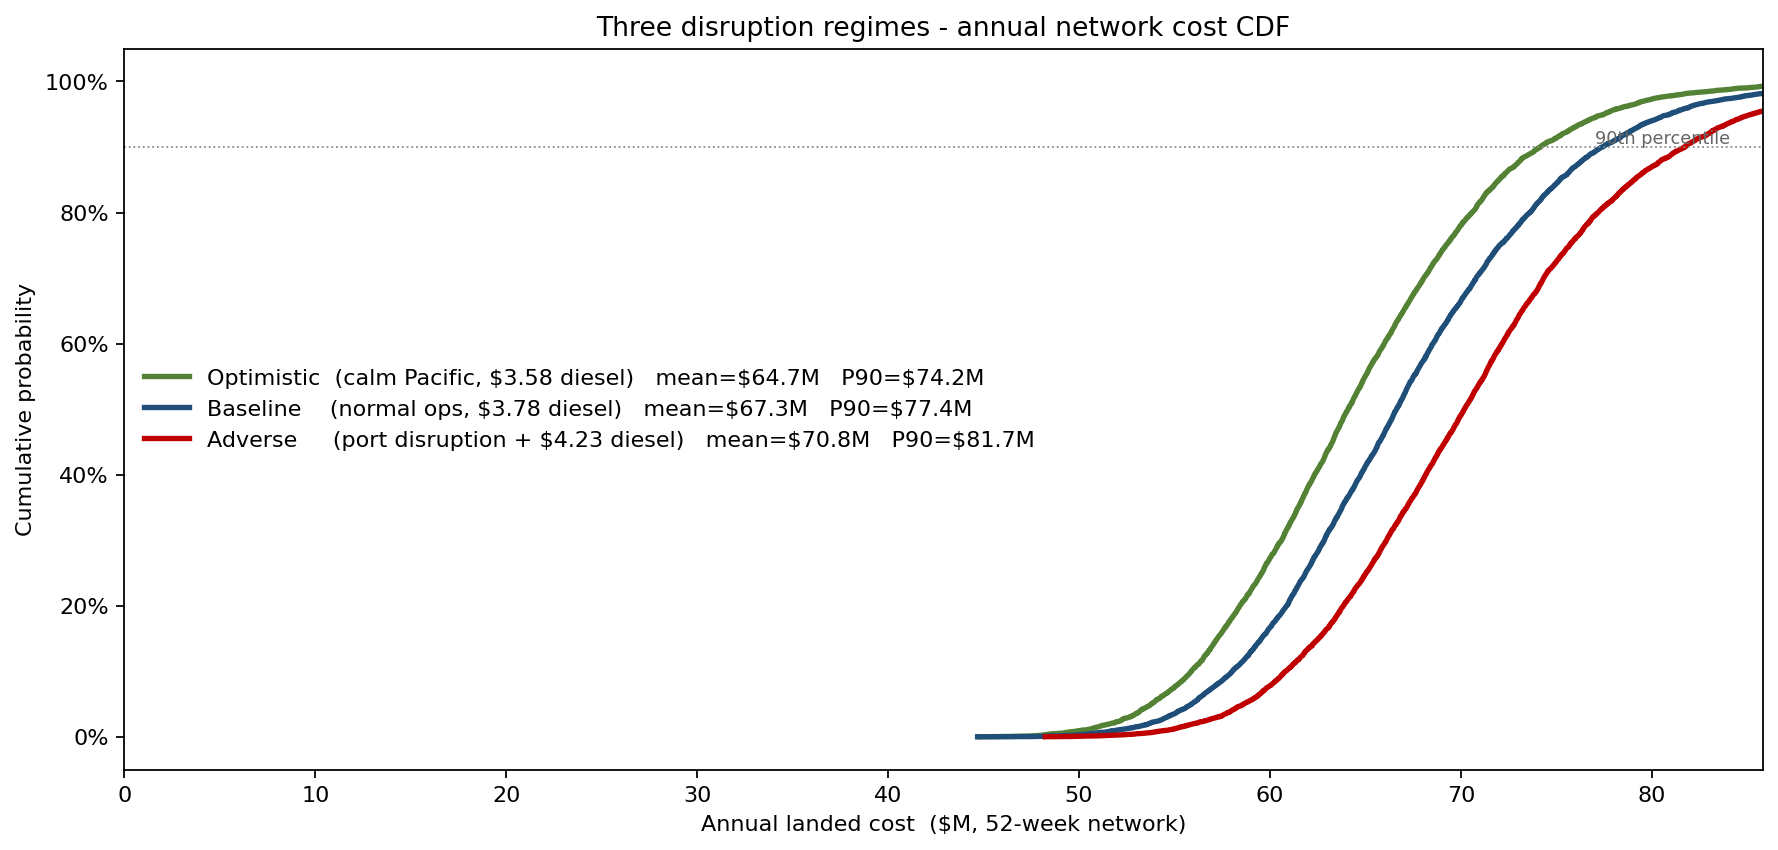
The deterministic plan landed on the baseline mean, but a bad-freight, high-diesel year pushes the bill toward the adverse curve — the $77M baseline P90 and $82M adverse P90 are the regions the planning process never named or budgeted for. That gap between the planned mean and the survivable P90 is what produced the overspend.
Service-level vs holding cost: what 30 basis points of safety stock actually buys
The retailer's current order-up-to policy uses z = 1.65 (a 95% per-cycle in-stock target). The simulation reports that this delivers a 99.56% fill rate but a 15.8% probability of at least one stockout-week somewhere in the network in any given week. Raising the safety factor to z = 2.05 (a 98% per-cycle target) lifts the fill rate to 99.81% and halves the weekly stockout-week probability to 8.2% — cutting mean weekly lost-contribution-margin from $14.3k to $6.2k (lost cases × $9.20 contribution margin), an avoided lost-margin of roughly $0.4M/year against the incremental holding cost of the deeper safety stock.
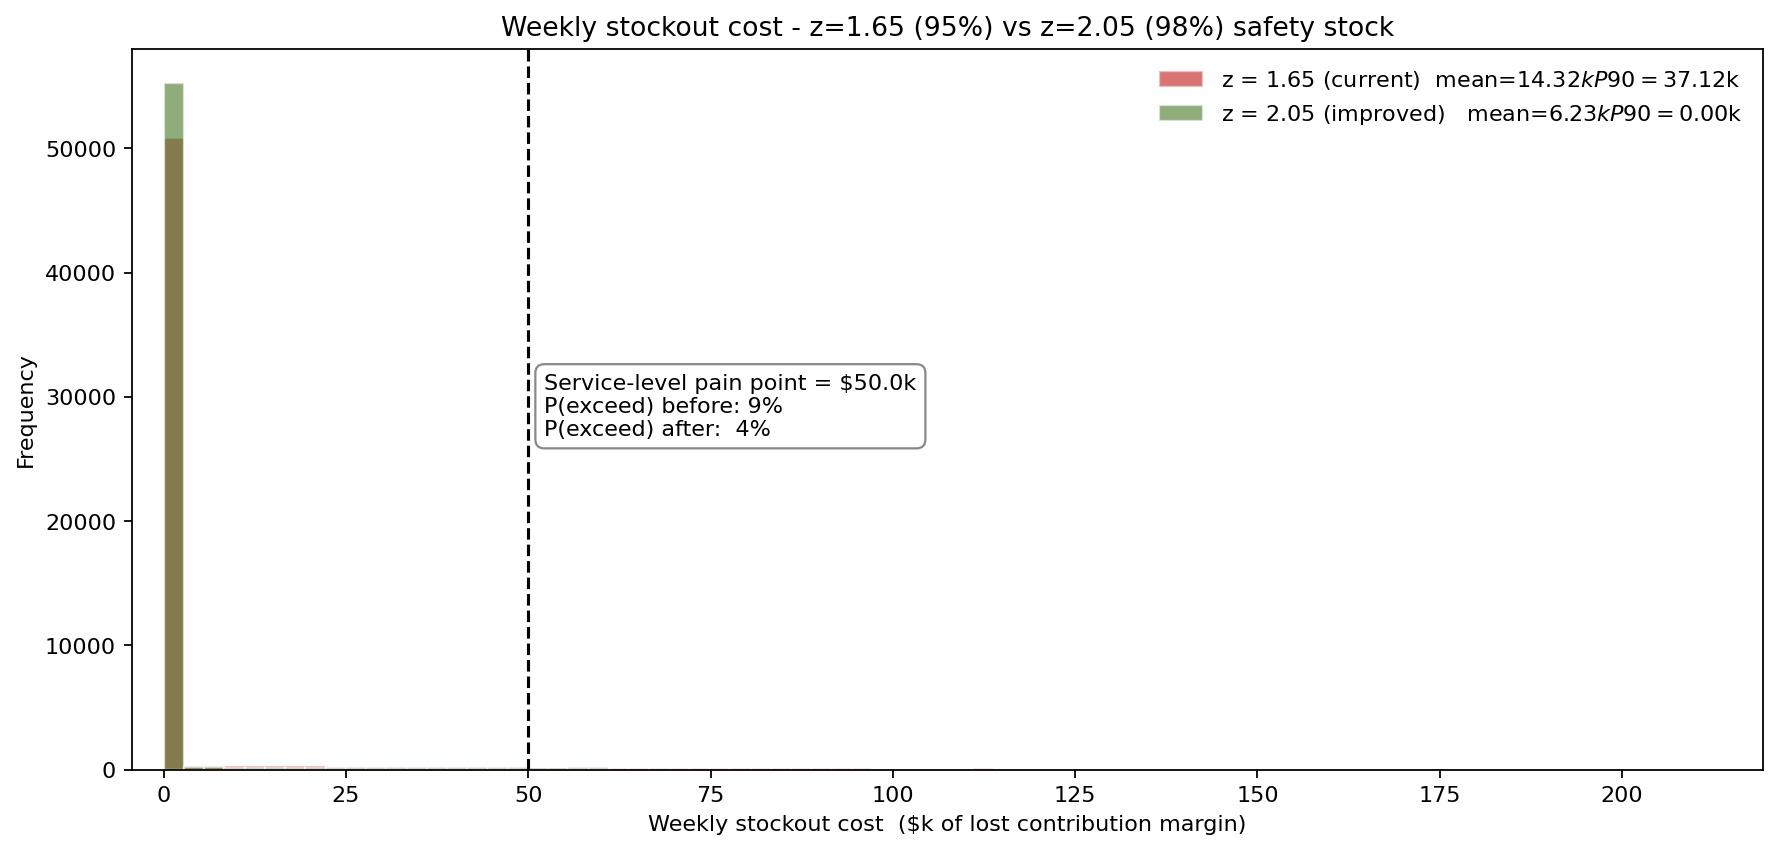
The deterministic model had no concept of "probability of a stockout-week"; it computed a fill rate from the mean and stopped. The simulation made the cost-of-service-improvement a tradeable line item.
What actually moves the annual landed cost
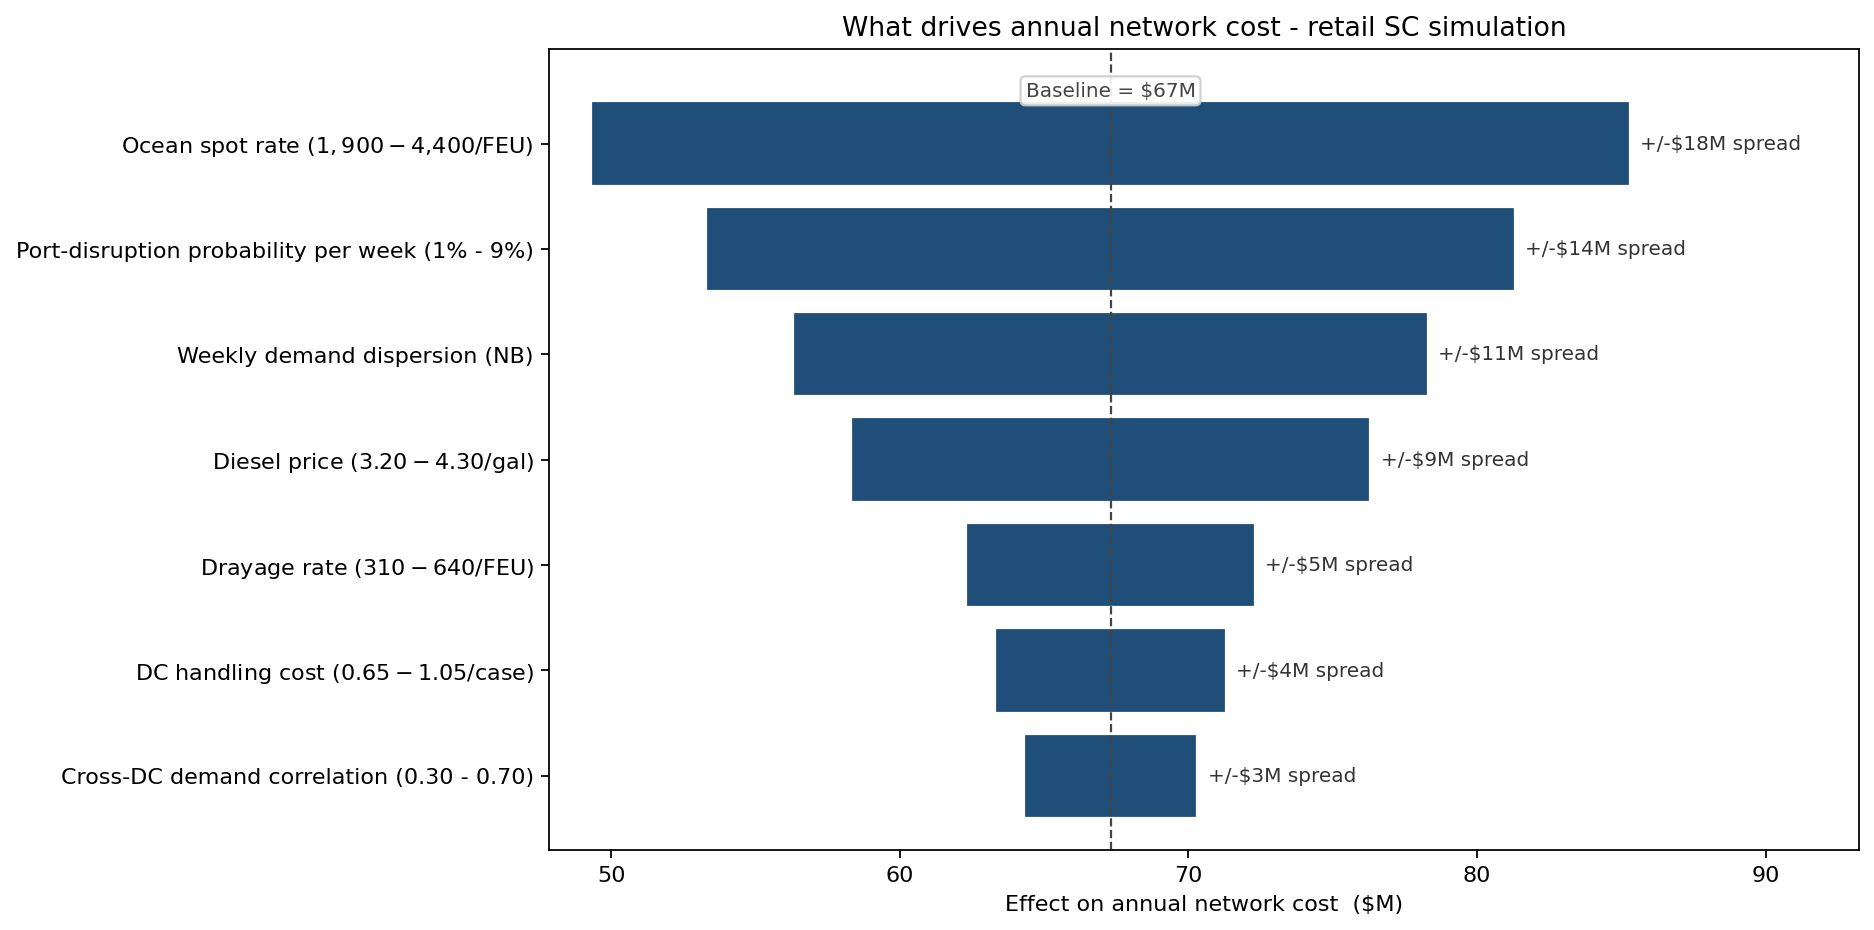
The dominant driver is the ocean spot rate (±$18M on the annual bill across its plausible range). Next is the port-disruption probability (±$14M, because the disruption multiplier compounds on an already-elevated freight regime). Weekly demand dispersion (±$11M) and diesel price (±$9M) come next. Cross-DC demand correlation has the smallest mean effect of the seven drivers (±$3M) — but it acts on the tail, lifting the joint-tail demand that the independent-DC model erased, which is why it earns a place in the ranking despite its modest mean swing.
What the model changed
- Annual budget moved from a single $67M point to a $67M mean / $77M P90 / $82M adverse-tail, which procurement used to size a forward fuel hedge and an ocean-rate cap on 40% of FEU volume.
- Safety-stock policy lifted from z=1.65 to z=2.05 on the top-200 SKUs, lifting network fill rate from 99.56% to 99.81% and halving the weekly stockout-week probability from 15.8% to 8.2%.
- DC capacity investment deferred. The simulation showed the alleged "throughput bottleneck" at the Newark DC was a co-spike artifact of the assumed independence, not a structural shortfall — saving $34M of capex pending one more year of telematics calibration.
- Disruption-response playbook re-priced. The 7-percent-per-week port-disruption probability used in the adverse scenario was the empirical 2021–2024 rate; the team committed to refreshing it quarterly rather than annually because that single input moves the budget more than any other modelable variable.
ModelRisk Functionality Used
- Negative-Binomial weekly demand per DC (mean 95k–112k cases, shape r = 42, weekly CV ≈ 0.15), with Gaussian copula at 0.55 joining all four DCs — correcting the 6% network-wide P90 understatement (386k → 407k cases) that the prior independent-DC model produced.
- LogNormal ocean spot-rate distribution ($2,850 mean, CV 0.35), fitted to 2022–2024 SCFI data — capturing the Red-Sea-reroute period that GBM would have under-weighted.
- Ornstein–Uhlenbeck diesel-price model anchored to $3.78/gal long-run with vol 13%, replacing GBM in the outbound LTL surcharge calculation.
- Compound disruption shock (per-week Bernoulli with severity multiplier 1.6–2.4× on ocean rate) — the single largest tail driver in the tornado.
- Newsvendor-style service-level comparison between z = 1.65 and z = 2.05, tied directly to the simulated lost-margin distribution at $9.20/case.
- Annual scenario CDF for three macro postures (optimistic / baseline / adverse), with the P90 of each driving the hedge-sizing decision.
A logistics plan built on a mean is a plan built for a year that will never happen. A plan built on a simulated distribution names the year it has to survive — and the 2024 overspend that took the retailer by surprise sat around the 80th percentile of the rebuilt model's baseline curve, well inside the band the simulation said it had to budget for.