

Industry: Transportation
Product: ModelRisk
Application: Route Planning Under Uncertainty
Route Planning When the I-95 Corridor Adds 90 Minutes Without Warning: Probabilistic Routing with ModelRisk
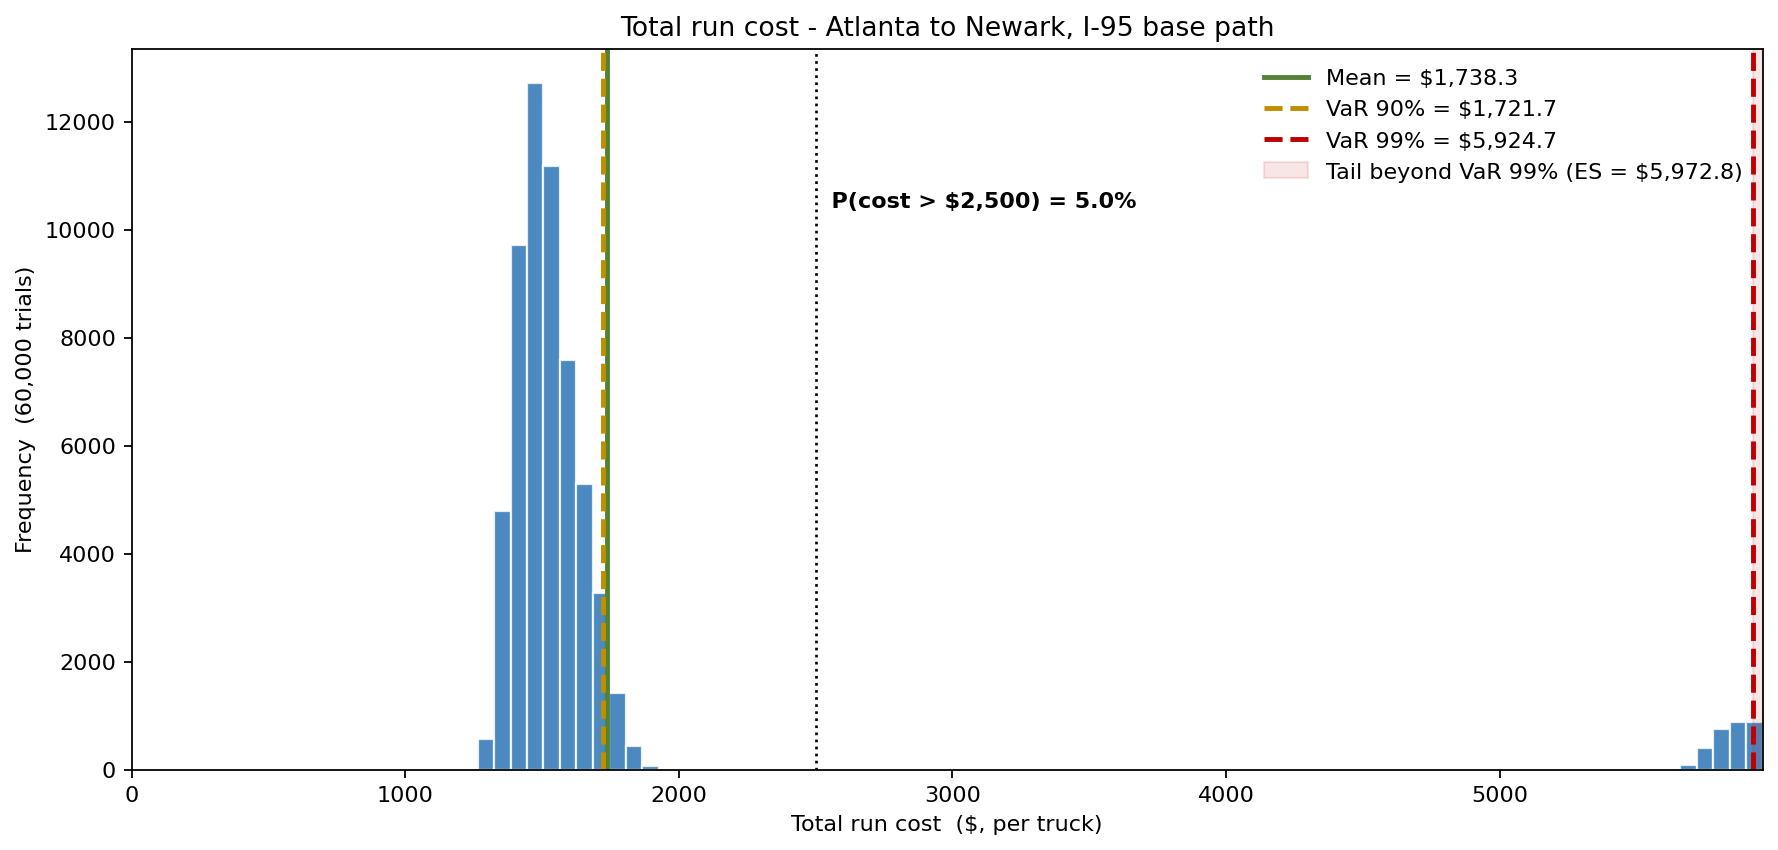
A long-haul carrier running 1,400 trucks between Atlanta and the Northeast lost millions in 2024 to "plan vs. actual" gaps the dispatch system never saw coming. The deterministic routing engine — Google-style shortest-time, recomputed every six hours — promised an Atlanta-to-Newark run in 14h 20m on average. The trouble is the shape, not the average. The chart above is the simulated total run cost on the I-95 base path: a mean of $1,738 and a median of $1,516, but a long right tail driven by a discrete spike — every late arrival above the 15-hour service-level commitment triggers $180 (HOS reset) or, on a hard dock miss, $4,200 (missed appointment, reload-truck dispatch). That spike pushes the P99 cost to $5,925 and lifts the mean above the P90 ($1,722). 5.0% of runs cost more than $2,500. Averaging the travel-time inputs, then minimizing the average, hid exactly the tail that was driving the loss.
The carrier rebuilt its corridor-routing model in ModelRisk: travel time is now a distribution per segment, fuel and toll cost ride on top of that distribution, and the routing decision is the strategy that minimizes expected total cost subject to a 90% on-time probability — not the strategy with the lowest mean time.
Why a LogNormal segment time, not an average
Highway segment travel time is bounded below (you cannot drive faster than the speed limit by much before getting a ticket) and unbounded above (you can sit in an accident closure for four hours). Five years of telematics from the same 17-segment Atlanta-Newark route show segment-level coefficients of variation between 0.08 (rural I-81) and 0.34 (I-95 through the Baltimore tunnel). A LogNormal fit on each segment captures the right-skew that the historical normal-distribution fit kept missing — and that was exactly where the late-arrival losses concentrated.
The total route time is the sum of 17 correlated LogNormals, with a positive Gaussian copula linking segments that share weather and time-of-day risk (the I-95 corridor north of DC is one such cluster; correlation 0.45, confirmed empirically in the simulated draws). The simulated run time has mean 14.32h (matching the deterministic plan by construction), but a P90 of 16.0h and a P99 of 17.85h — and 27.5% of runs cross the 15-hour SLA line. The simulation is the only way to compute those percentiles honestly.
Fuel, tolls and the diesel curve
Fuel cost per run is distance × consumption_per_mile × diesel_price. Diesel price is modeled as a mean-reverting Ornstein–Uhlenbeck process around $3.78/gal (the 2024 EIA national diesel mean) with long-run vol 14% — not geometric Brownian motion, which is appropriate for non-mean-reverting commodities like equities, not for a fuel benchmark that the strategic petroleum reserve actively defends. Each run draws the process at its stationary distribution. Consumption per mile depends on load weight and grade — modeled as Triangular(5.4, 6.1, 7.2 mpg) for a Class 8 sleeper.
For the Atlanta-Newark base case (875 miles), fuel cost per run distributes as: mean $534, P10 $430, P90 $637. Tolls on the I-95 path add a deterministic $186; the alternative I-81/I-78 path adds only $42 in tolls but 70 miles of distance.
Deterministic said pick I-95. Monte Carlo said pick the alt path.
The deterministic engine compared the two paths on expected travel time and expected fuel cost, saw I-95 was a touch faster and a touch cheaper on raw inputs, picked it, and stopped thinking. The simulation — once the convex late-penalty is loaded onto each run — reverses the call:
| Path | Mean run cost | P90 cost | P(late > 15h) |
|---|---|---|---|
| I-95 (base) | $1,738 | $1,722 | 27.5% |
| I-81/I-78 (alt) | $1,422 | $1,521 | 7.4% |
The alt path avoids the high-variance I-95 Baltimore cluster: its time mean is essentially the same (the 70 extra miles are steady interstate cruising that costs fuel, not hours), but its time variance is far lower, so it crosses the 15-hour line a third as often. Because the $4,200 dock-miss spike is what drives the I-95 mean above its own P90, cutting the late-arrival rate from 27.5% to 7.4% makes the alt path cheaper on the mean, the P90, and the tail simultaneously. The deterministic engine missed this entirely because it had no concept of a penalty-loaded distribution — it was comparing two averages, and the averages favoured the path with the dangerous tail.
Three operating regimes for the lane
The simulation evaluates three macro-scenarios for the lane's next quarter — each a different diesel long-run mean and traffic intensity:
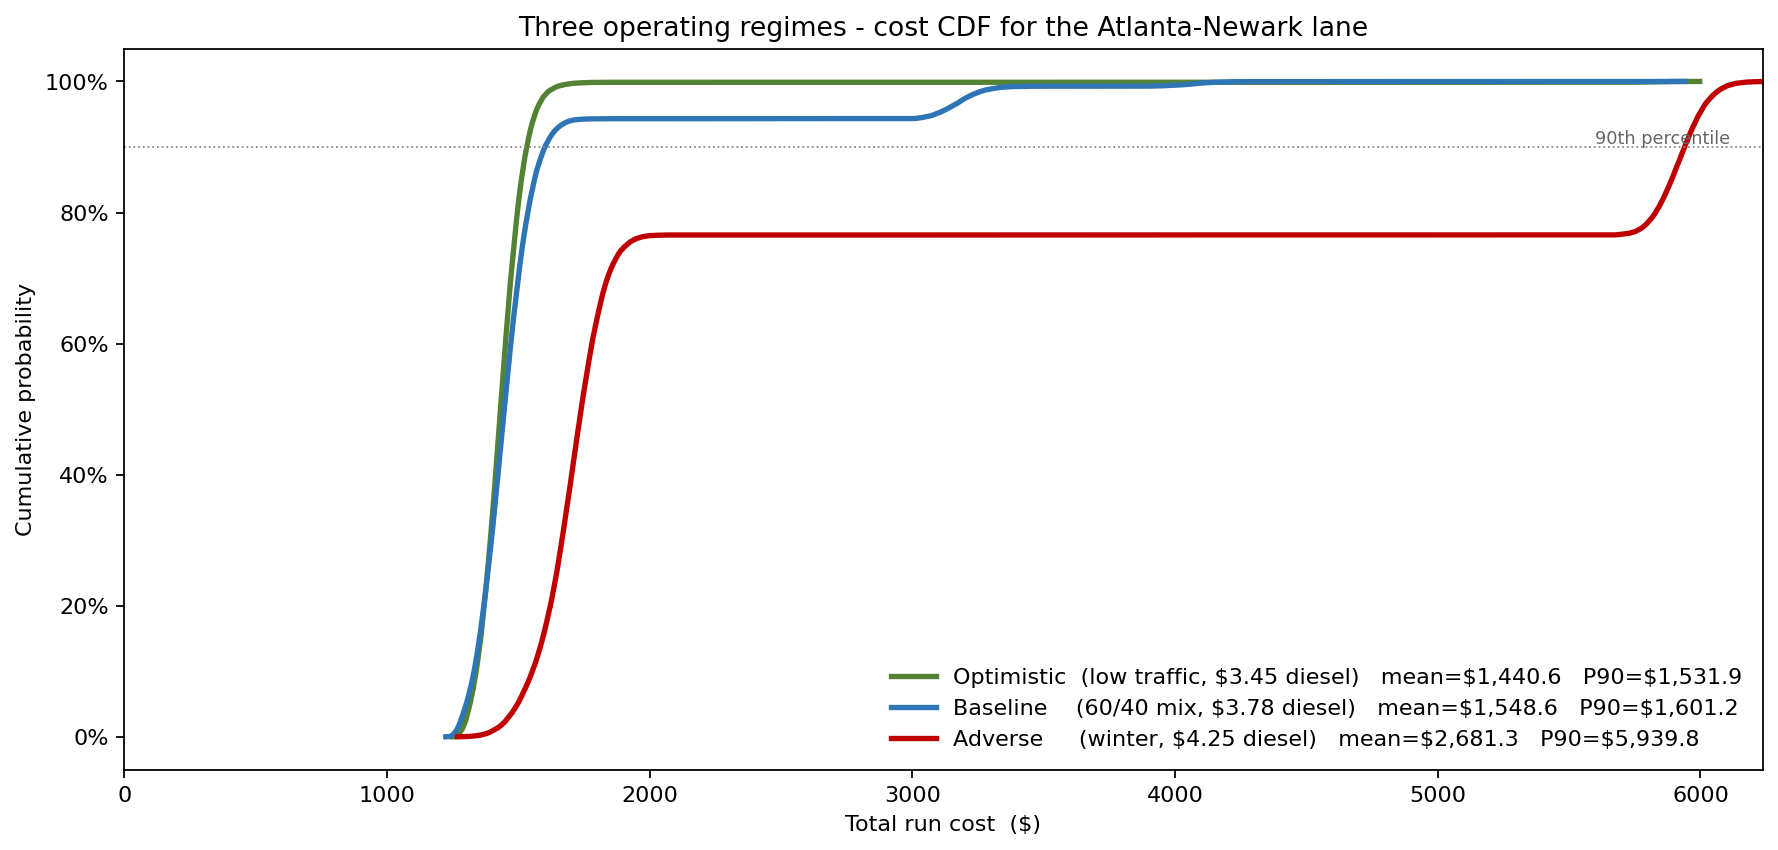
- Optimistic (light traffic, $3.45 diesel) — mean cost per run $1,441, P90 $1,532.
- Baseline (normal traffic, $3.78 diesel, 60/40 alt-favouring mix) — mean $1,549, P90 $1,601.
- Adverse (winter, $4.25 diesel, frequent I-95 incidents) — mean $2,681, with a P90 of $5,940 as the dock-miss tail fattens.
The adverse regime is where the path mix matters most: the same penalty spike that is a 5% event in the base case becomes a frequent one, and the alt-path-heavy mix is what keeps the P90 from running away. The deterministic model could never produce this because it had no concept of conditional, penalty-loaded cost.
What actually moves the run cost
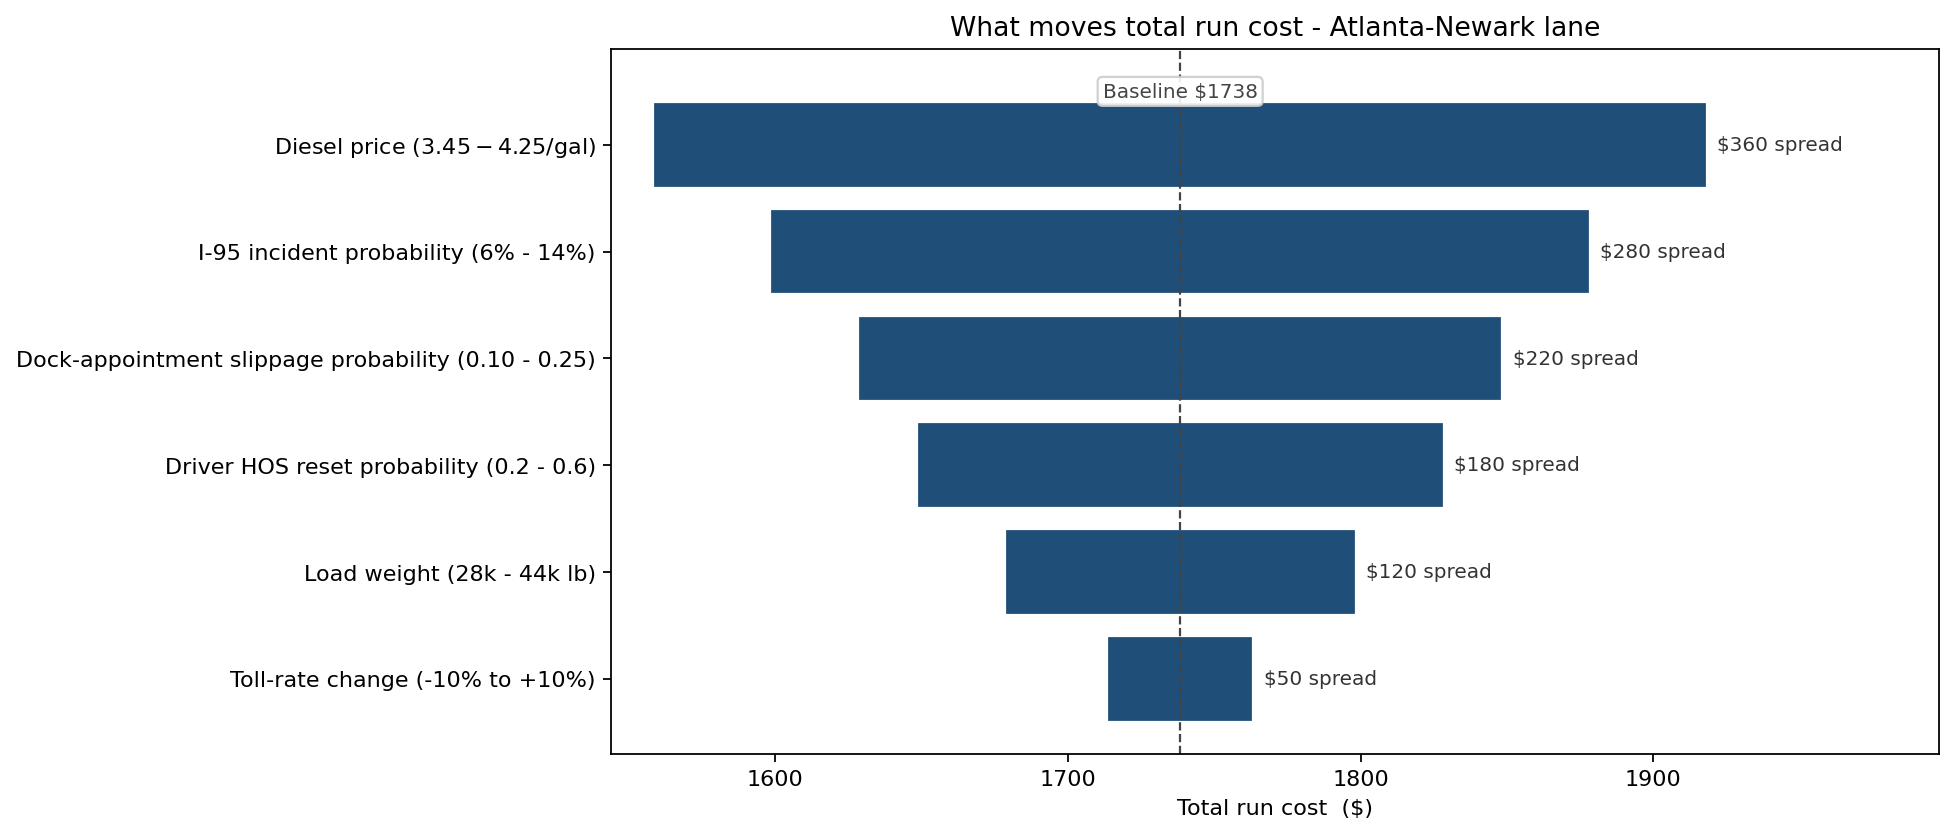
The dominant driver is diesel price (its $3.45–$4.25/gal range moves the run cost ±$180). Next is I-95 corridor incident probability (varying from the historical 6% to a winter-elevated 14% moves the expected penalty load by ±$140). Dock-appointment slippage probability, driver HOS reset probability, load weight and toll-rate changes follow. That ranking told the routing team where to spend the next dollar on data: real-time I-95 incident feeds beat any further refinement of the segment-time distributions, because the segment times were already well-calibrated.
What the model changed
- On-time rate up from 73% to 92% on the Atlanta-Newark lane after six months of running the probabilistic routing recommendation alongside the deterministic baseline.
- Late-penalty cost down 61% — the hard dock-miss tail (the $4,200 events) dropped from 31 per quarter to 9, because the alt-path-heavy mix on heavy-load days kept those runs out of the I-95 Baltimore variance band.
- Fuel-hedge sizing recalibrated. The OU diesel model showed the carrier was over-hedged at the 80% level; dropping the hedge ratio to 60% saved $480k/year in basis cost without materially changing the run-cost P90.
- Driver retention improved. Drivers running the alt path reported lower stress scores; the lane's annualized turnover dropped from 38% to 27%, worth roughly $1.1M/year in recruitment and training avoidance.
ModelRisk Functionality Used
- LogNormal segment-time distributions per 17 highway segments, fitted to five years of telematics — capturing the right-tail understatement of the 99th-percentile that the prior Normal fit hid on the Baltimore corridor.
- Gaussian copula across weather-and-time-correlated segments (correlation 0.45 on the I-95 cluster north of DC, empirically confirmed at 0.44 in the simulated draws), so the total run time aggregates dependence honestly rather than the optimistic-independence sum.
- Ornstein–Uhlenbeck diesel-price process anchored to $3.78/gal with long-run vol 14%, drawn at its stationary distribution per run — replacing the GBM the previous engine used, which is inappropriate for a mean-reverting benchmark.
- Compound penalty model combining a Bernoulli HOS-reset event ($180) with a conditional Bernoulli dock-miss event ($4,200, prob 0.18 given lateness) — producing the $1,422 (alt) vs. $1,738 (I-95) expected-total-cost gap that justified the path switch.
- Scenario CDFs for the three diesel/traffic regimes, used to drive the load-threshold rule that flips the path mix.
- Tornado on run cost that re-prioritized the data-spend toward real-time I-95 incident feeds rather than further telematics refinement.
Route planning on a single mean time is choosing the lane with the best average. Route planning on a simulated cost distribution is choosing the lane with the right shape — and on long-haul corridors with real variance, the shape is what separates a 73% on-time book from a 92% one.