

Industry: Transportation
Product: ModelRisk
Application: Route Optimization
What the VRP Solver Doesn't Tell You: Wrapping the Optimal Plan in Monte Carlo
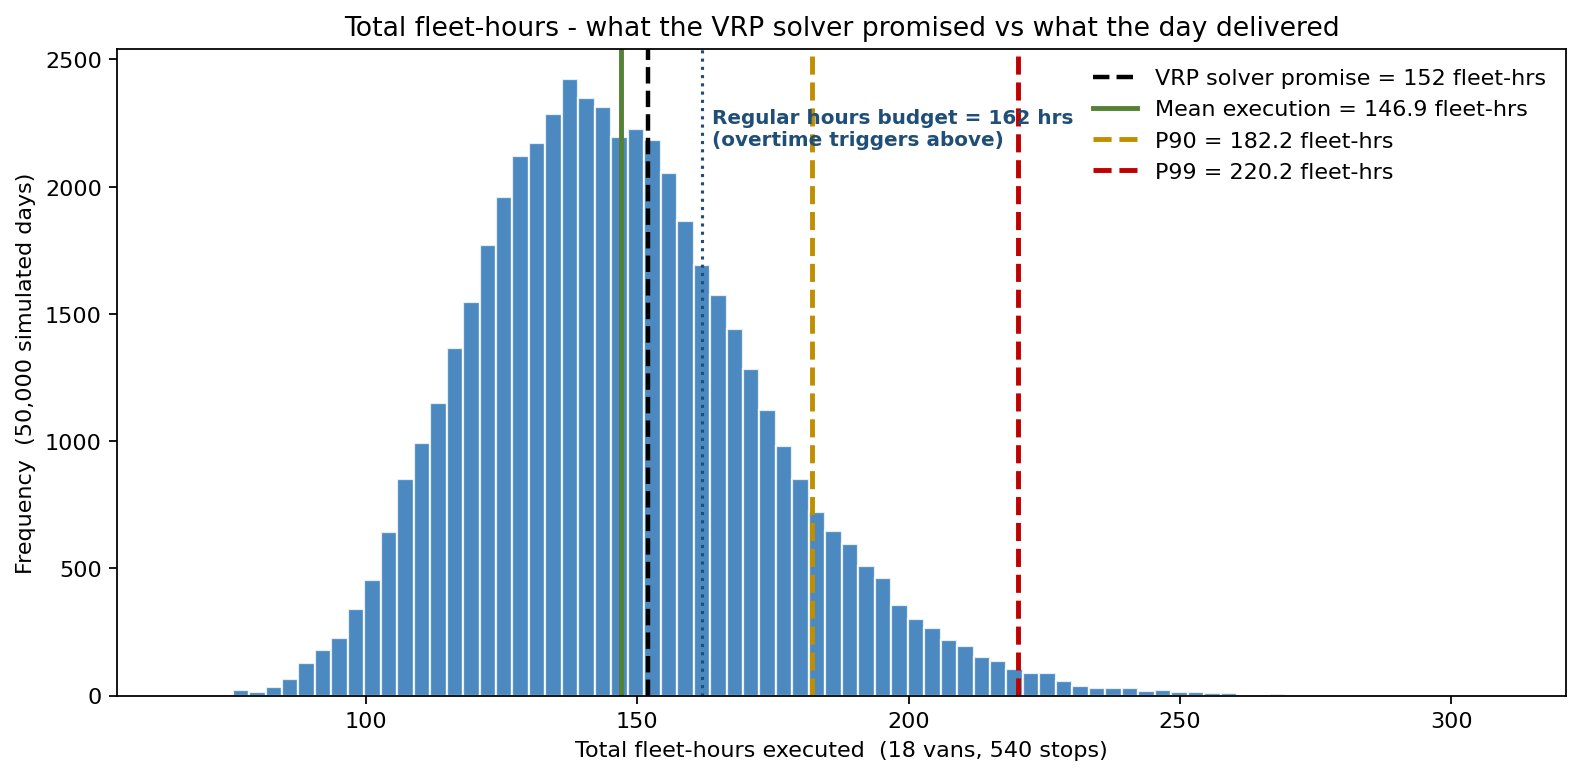
A same-day delivery 3PL operates 18 vans serving 540 metro-area stops a day. The classical vehicle-routing solver returns a 'baseline plan' with one promise: total fleet-hours = 152. The dispatcher commits to that number on the morning standup, the executive dashboard uses it for daily forecasting, and the wage budget is built on it. The chart above is what the solver never shows: the execution-day distribution of fleet-hours once stochastic service time, traffic, and operational shocks are wrapped around the plan. The mean lands at 146.9 fleet-hours, the P90 at 182, the P99 at 220 — and the deterministic 152 sits up at roughly the 61st percentile, comfortably inside the body but well short of the days that break the budget. The regular wage budget of 162 hours (18 vans × 9 hours of regular pay) is breached on 26% of days: the operation lives in overtime more than a quarter of the time.
The 3PL rebuilt the VRP-execution wrapper in ModelRisk. The decision was not how to solve the routing problem better — the OR-Tools solver does that — but how to evaluate the solver's recommended plan against the stochastic reality of execution, and whether to swap the solver's objective from "minimize expected fleet-hours" to "minimize 95th-percentile fleet-hours" (a CVaR formulation).
What the VRP solver assumes — and what the day actually delivers
The VRP solver treats per-stop service time and inter-stop drive time as deterministic constants. The execution-day distribution comes from three sources of variability the solver has no way to express:
Per-stop service time is LogNormal with mean 4.5 minutes and CV 0.5 — small-business and residential parcel handoff with a long right tail for signature stops and recipient-absent re-attempts. LogNormal, not Normal, because the right tail is what generates overtime.
Inter-stop drive time is LogNormal with mean 5.2 minutes/leg and CV 0.42 — dense metro density, parking variability, occasional unexpected one-way or construction reroute.
Metro-wide traffic day-shock is a single LogNormal multiplier with CV 0.18 applied across all stops on a day, capturing the correlation that a bad-traffic morning creates: every van slows down, not just one. The independent-noise assumption (the solver's default if asked to stress-test) averages away across 540 stops, so it cannot reproduce the right tail — the shared shock is precisely what makes the tail fat.
What the deterministic 152 actually means
The "Why Monte Carlo" beat in VRP is the chart above. The optimal solver's recommended plan is not "wrong" — it correctly minimizes the expected fleet-hours under deterministic inputs — but the execution of that plan is a probability distribution, and any planning that uses the solver's number as if it were the answer ignores the entire right tail where the budget actually breaks. The mean of 146.9 is below the solver's 152, but the spread runs from the low 120s to past 220 on a bad-traffic day.
Time-optimal vs robust solver objective
A reformulation: instead of minimizing expected fleet-hours, run the solver with a CVaR(0.95) objective — minimize the average of the worst 5% of execution-day outcomes, by adding slack/buffer routing that absorbs the day-shock. The robust solver returns a plan with mean fleet-hours 152.6 instead of 146.9 (a 4% mean penalty) but P95 fleet-hours of 179 instead of 195, a P99 of 191 instead of 220, and a worst-5% CVaR that drops from $9,809 to $7,372.
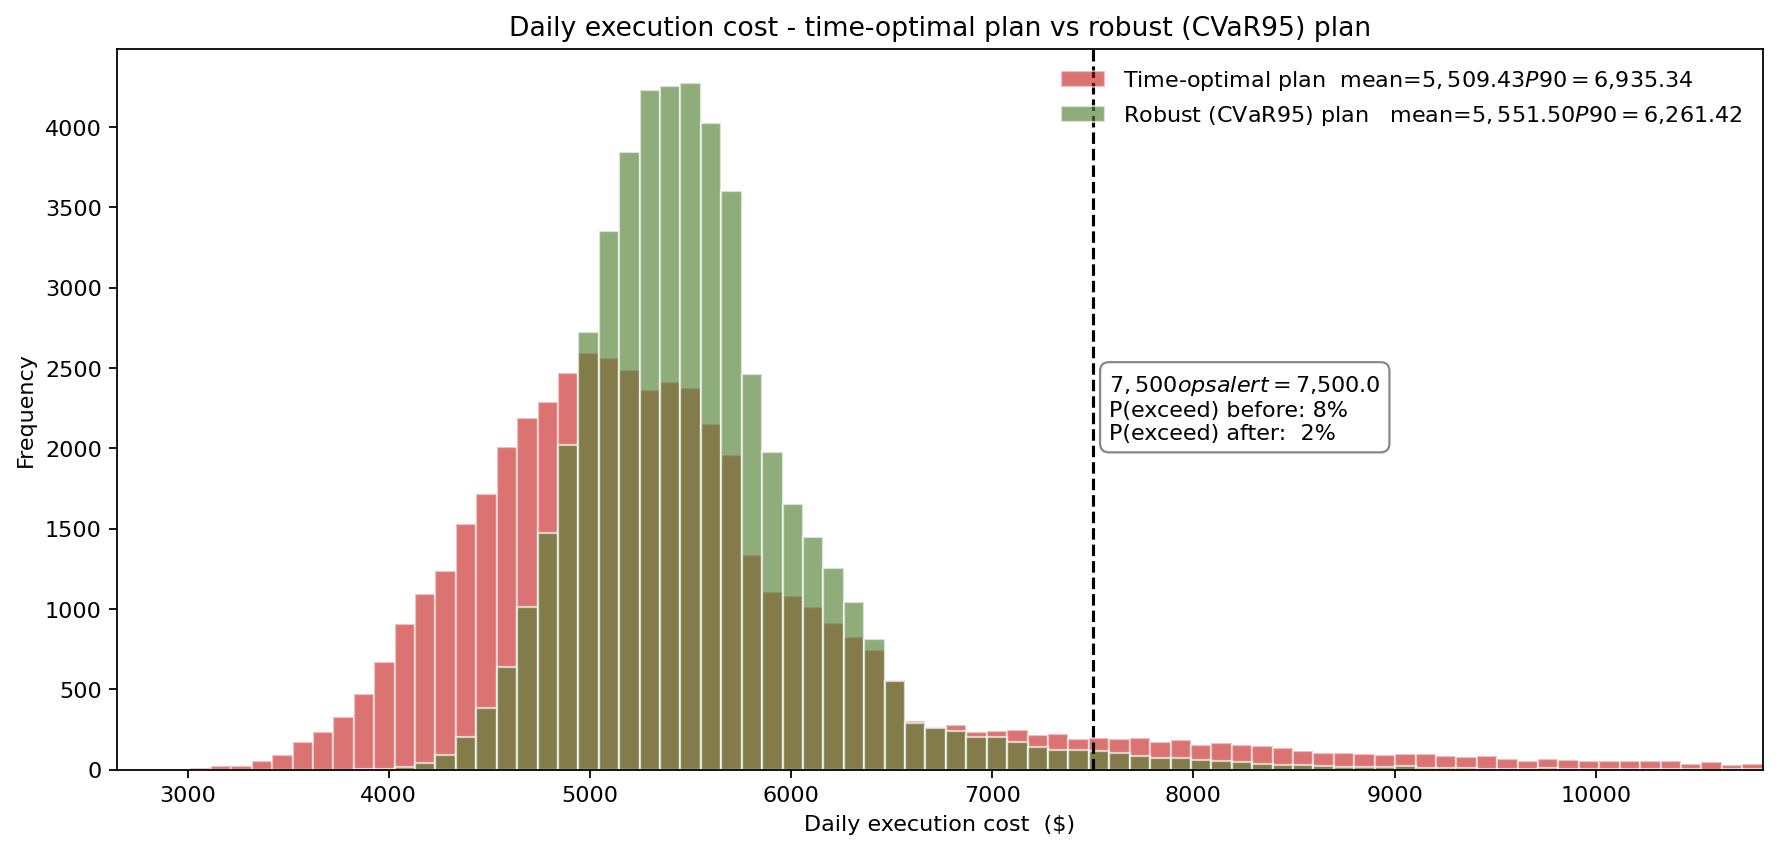
The cost distributions side by side make the trade-off concrete. The two plans cost almost the same on the median day — mean daily cost $5,509 time-optimal vs $5,551 robust, a penalty of only about $42/day — but the robust plan wins decisively on the days that breach the $7,500 operations alert: probability of breach falls from 8% to 2%. For an operation whose wage budget is built monthly (and whose monthly variance is what gets discussed at the operations review), the robust plan is the rational choice — a negligible mean-cost penalty buys a four-fold reduction in the worst-day breach rate.
What actually moves the cost number
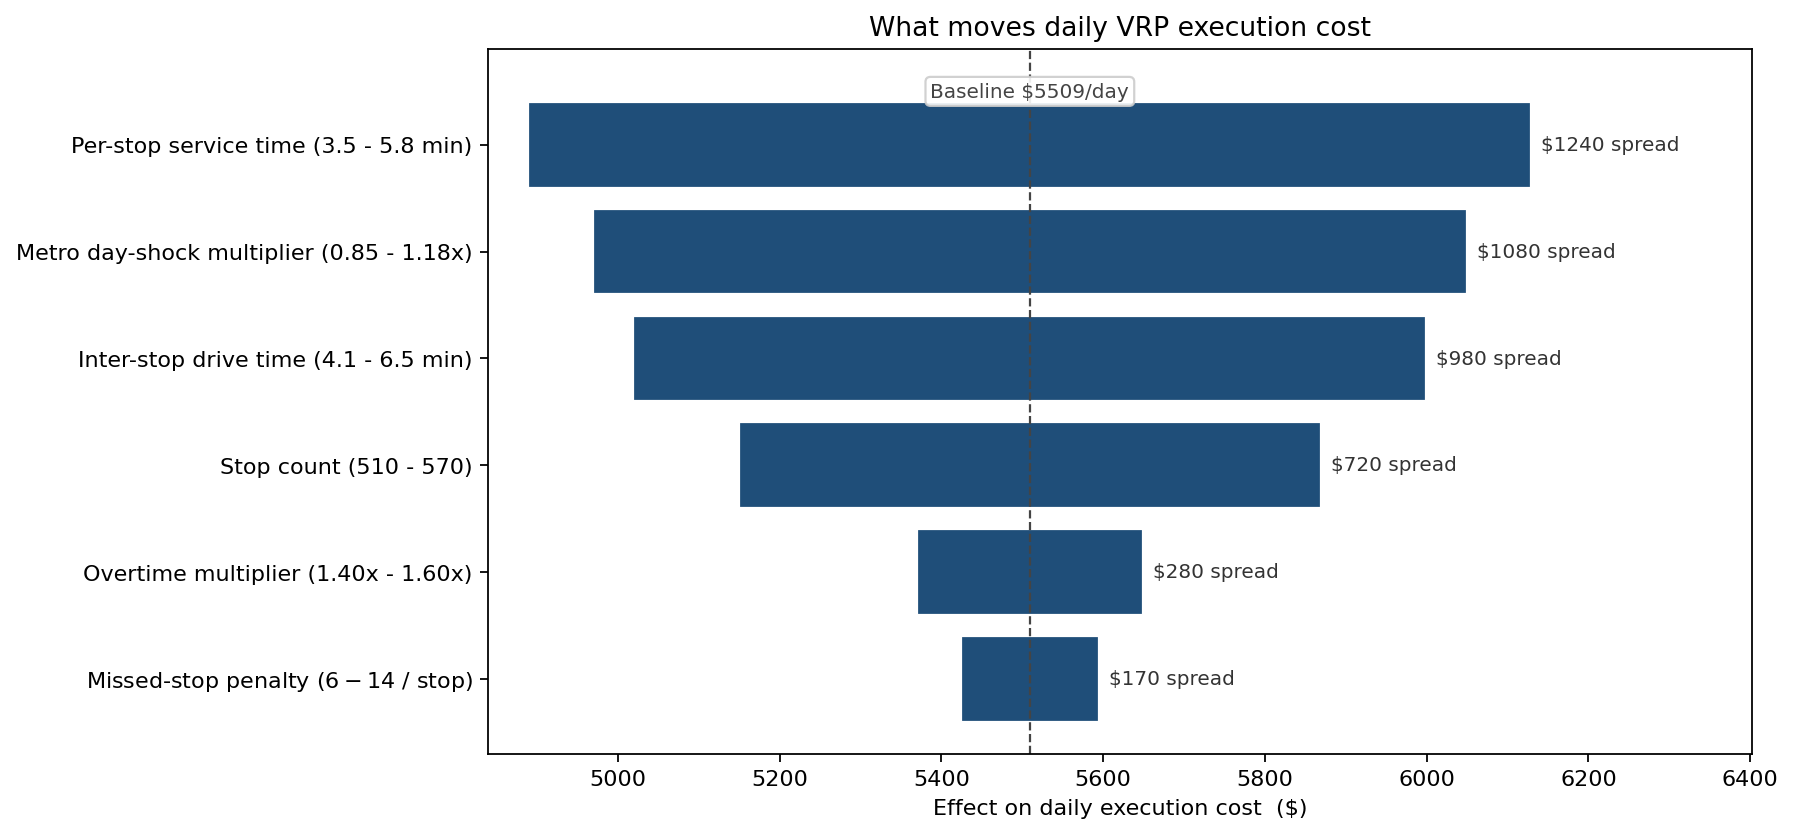
Per-stop service time is the dominant cost driver — confirming the operations team's intuition that the highest-leverage operational investment is handheld-scanner workflow for faster handoffs. The metro day-shock multiplier ranks second, ahead of inter-stop drive time — the parameter the deterministic solver cannot represent at all, yet worth ±$540 in the daily cost spread. Stop count ranks fourth, ahead of overtime multiplier and missed-stop penalty: these "policy lever" parameters move the answer less than the "what the day actually is" parameters do.
From insight to action
- Solver reconfigured to a CVaR(95) objective. Expected daily cost rose by only about $42/day; the P95 cost fell from $8,212 to $6,596 and the worst-5% CVaR fell from $9,809 to $7,372. The probability of a day breaching the $7,500 alert dropped from 8% to 2% — the bad-day variance the operation had been absorbing.
- Morning ribbon redesigned. The standup display switched from a single number ("152 fleet-hours planned") to a P50/P90/P99 ribbon ("147 / 182 / 220 — overtime probability 26%"). Dispatchers now adjust van assignments on the morning of a traffic-warning forecast, rather than discover the overtime at end-of-shift.
- Service-time improvement program funded. The tornado promoted service-time-per-stop above all other drivers; the operations team's first investment was scanner-workflow training, paid out of the savings the CVaR-objective plan generated.
ModelRisk Functionality Used
- LogNormal service-time and drive-time fitting to handheld-scanner and telematics data — with CV calibration explicitly tested by comparing the simulation's right-tail (P95, P99) to the historical record's worst-day percentiles.
- Shared metro-wide LogNormal day-shock multiplier (CV 0.18, mean 1) applied across all 540 stops on the same day — capturing the correlation that the solver's independent-noise stress-test had assumed away.
- VRP-solver-output wrapping rather than rebuilding — the existing OR-Tools solver continues to produce the plan, the ModelRisk wrap evaluates the plan's execution-day distribution. The two tools compose cleanly.
- CVaR(95) objective reformulation of the solver and side-by-side simulation of the resulting plans on identical input draws, producing the apples-to-apples comparison that justified the objective swap.
- Operational threshold-probability outputs (P(fleet-hrs > 162), P(daily cost > $7,500)) in the format the operations VP uses for the morning standup, rather than the expected-value language the prior solver-output report used.
- Tornado decomposition that promoted service-time variability above stop count and overtime multiplier as the highest-leverage operational improvement, redirecting the next year's investment budget.
The VRP solver returns a plan; Monte Carlo returns the distribution of what executing that plan looks like. ModelRisk's job in route optimization isn't to compete with the solver — it's to surround the solver's deterministic answer with the probability shape the operation actually lives inside. When the dispatcher sees "147 / 182 / 220 — 26% overtime probability" instead of "152 fleet-hours," the morning standup turns into a tail-management conversation rather than a number-confirmation ritual — and that is the conversation that compounds.