

Industry: Transportation
Product: ModelRisk
Application: Freight Optimization
Truck or Train? Pricing the Chicago-LA Lane Under Diesel Volatility
The intermodal vs over-the-road truck decision on the Chicago-Los Angeles lane is the single largest mode choice on the U.S. transcontinental freight map. At 2,030 highway miles the lane sits well above the 700-mile rule-of-thumb intermodal break-even, but the actual economics on any given load depend on the diesel price that month, the rail fuel surcharge that quarter, the BNSF/UP ramp dwell at the LA destination, and whether the freight tolerates rail transit near 3.5 days instead of 1.5 days behind a team driver. A 3PL moving 30,000 loads/year on this lane was using a deterministic spreadsheet that recommended a fixed 70/30 intermodal/truck mix — based on average rates from twelve months ago.
The stochastic rebuild in ModelRisk priced each mode and each mix policy as a distribution of per-load cost. The two cost distributions barely overlap: intermodal is cheaper on essentially every draw, not just on average.
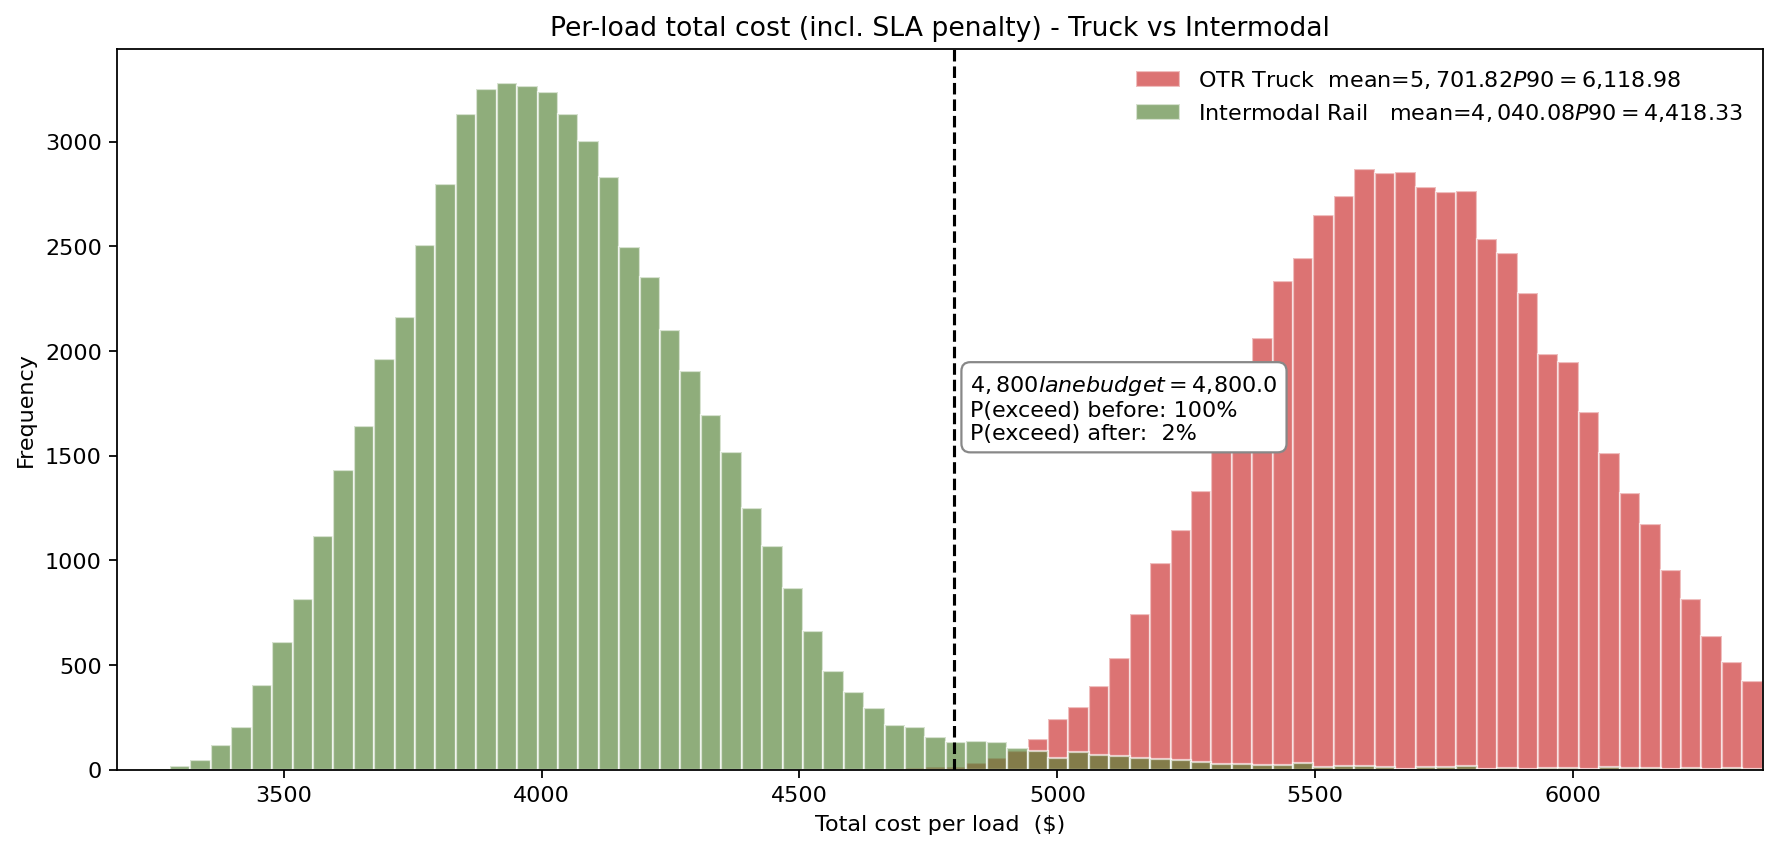
The histogram above is the heart of the analysis. Truck lands near $5,700/load, intermodal near $4,040/load — a gap that holds across the whole distribution, with intermodal's right tail still landing well below truck's left tail. What Monte Carlo adds is not a reversal of the mode ranking but the shape of the gap, the SLA-penalty tail intermodal carries, and a decomposition of which input actually drives the saving.
Decomposing the per-load cost
Truck (OTR). Linehaul rate ex-fuel is Triangular(1.85, 2.10, 2.45) $/mile — the contract-plus-spot blend the carrier actually pays. Fuel is diesel price × 2030 miles ÷ MPG, with MPG Triangular(5.8, 6.5, 7.4). Loss-and-damage strikes 0.4% of loads with a Gamma-distributed severity around $850. Accessorial and tolls add Triangular(85, 140, 280) per load. The transit time is LogNormal with median 38 hours and CV 0.18 — coast-to-coast team-driver service is fast and tight, with a P90 near 47 hours.
Intermodal. The cost stack is different: short dray on both ends (60 miles each), rail linehaul on 1,910 miles at $1.35-1.95/mile all-in, a rail fuel surcharge that activates above $3.50/gal diesel, intermodal accessorials (chassis, terminal, demurrage) at Triangular(125, 230, 480), and a higher loss-and-damage rate at 0.9% reflecting more handling. The killer for intermodal is transit time variability: LogNormal with median 88 hours and CV 0.32 — almost twice the truck CV. P50 lands near 84 hours (3.5 days), but P90 is 125 hours (5.2 days) because rail-yard dwell and LA-area ramp congestion have a fat right tail.
The SLA penalty is $14/hour above the mode's SLA — 48 hours for truck, 110 hours for intermodal — and gets added to the per-load cost.
Reading the per-load cost distributions
The deterministic comparison reports truck at roughly $5,700/load vs intermodal at $4,040/load — a $1,662 saving per load that, multiplied by 30,000 loads, says intermodal is worth $49.9 million a year. The distribution view sharpens rather than overturns that story.
Both distributions are surprisingly tight (truck CV around 0.06, intermodal around 0.08): the per-load cost is dominated by deterministic linehaul mileage, so the stochastic spread is modest. Intermodal is the wider of the two because rail transit-time variability bleeds into the SLA penalty, but even intermodal's P90 ($4,418) sits far below truck's P10. The headline saving therefore holds at the mean and across the tails — the worst 10% of intermodal days ($4,418) still beat the worst 10% of truck days ($6,119) by about $1,700. The risk in intermodal is not cost overlap with truck; it is the service tail, where late loads trigger customer-contract clawbacks the cost chart does not show.
Three mode strategies, three cost CDFs
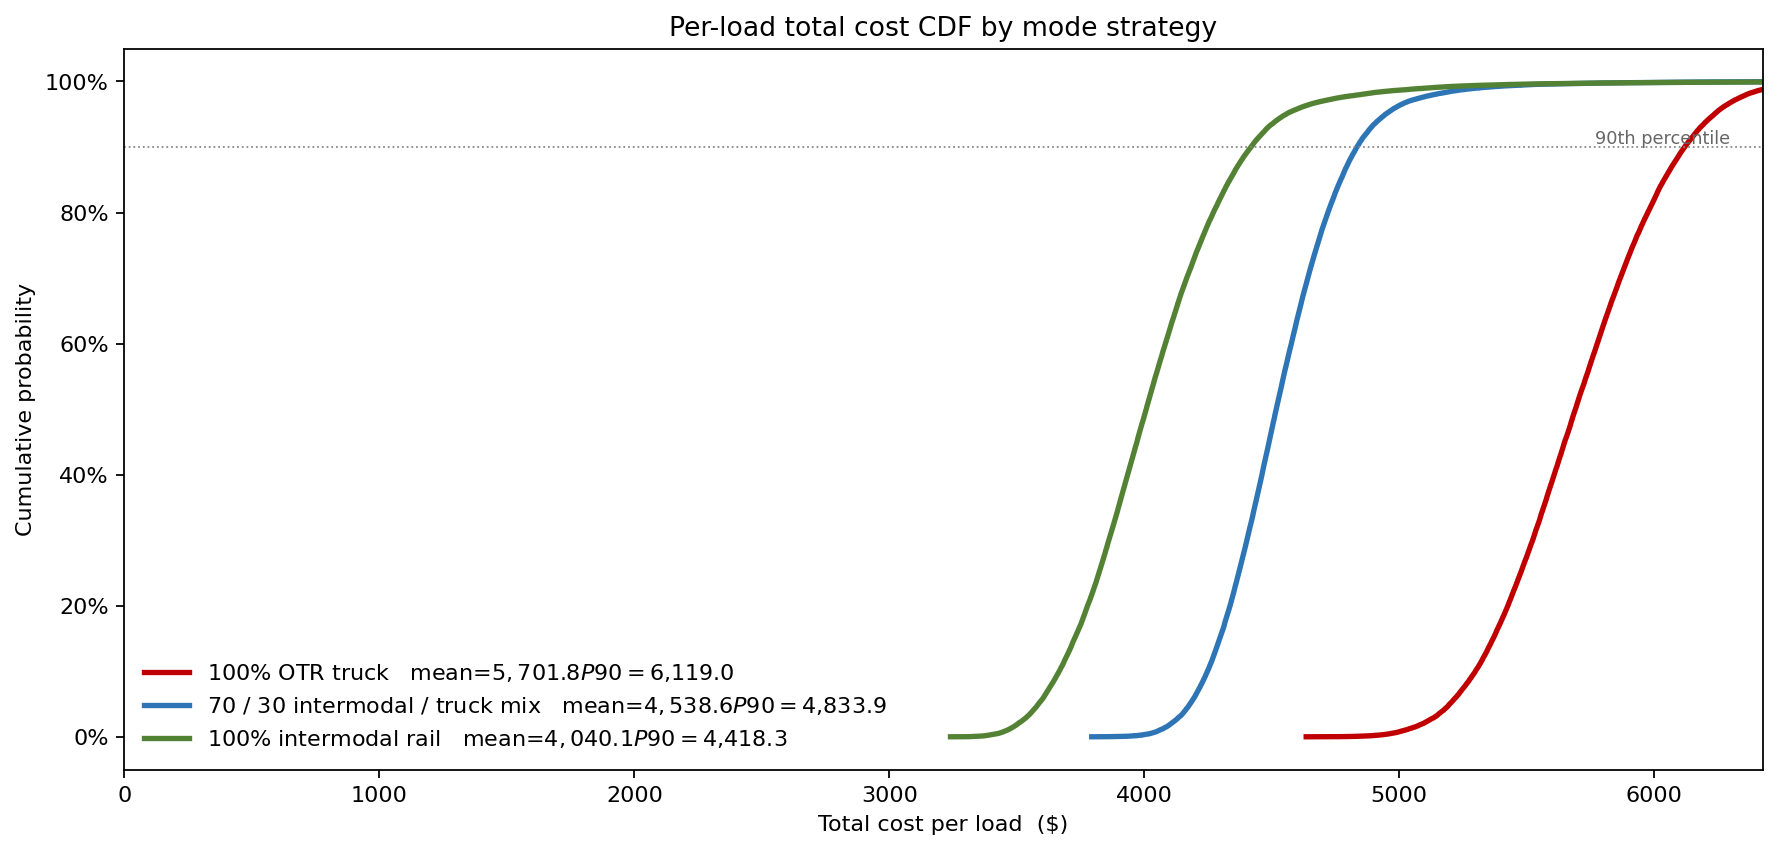
The 70/30 intermodal/truck mix sits cleanly between the two pure strategies, at a mean of $4,539/load and a P90 of $4,834. Its key advantage is that it routes the time-sensitive 30% of loads through truck (where they meet SLA almost always) and lets the time-tolerant 70% capture the intermodal cost saving. The CFO's question is no longer "what's the cheapest mode?" but "what mode mix gives the lowest mean cost subject to a service-tail cap?" Because the cost gap so strongly favours intermodal, the cheapest mix is the most intermodal one the service tail will tolerate — the 30% truck allocation is buying service certainty on time-critical freight, not cost.
This is the "Why Monte Carlo" beat for mode choice: diesel feeds both the truck fuel bill and the rail fuel surcharge, so under a diesel shock the two modes move partly together. A joint stochastic treatment of diesel and rail surcharge captures that coupling — and shows the diversification value of the mix is smaller than two independent deterministic point estimates imply.
What actually moves the savings
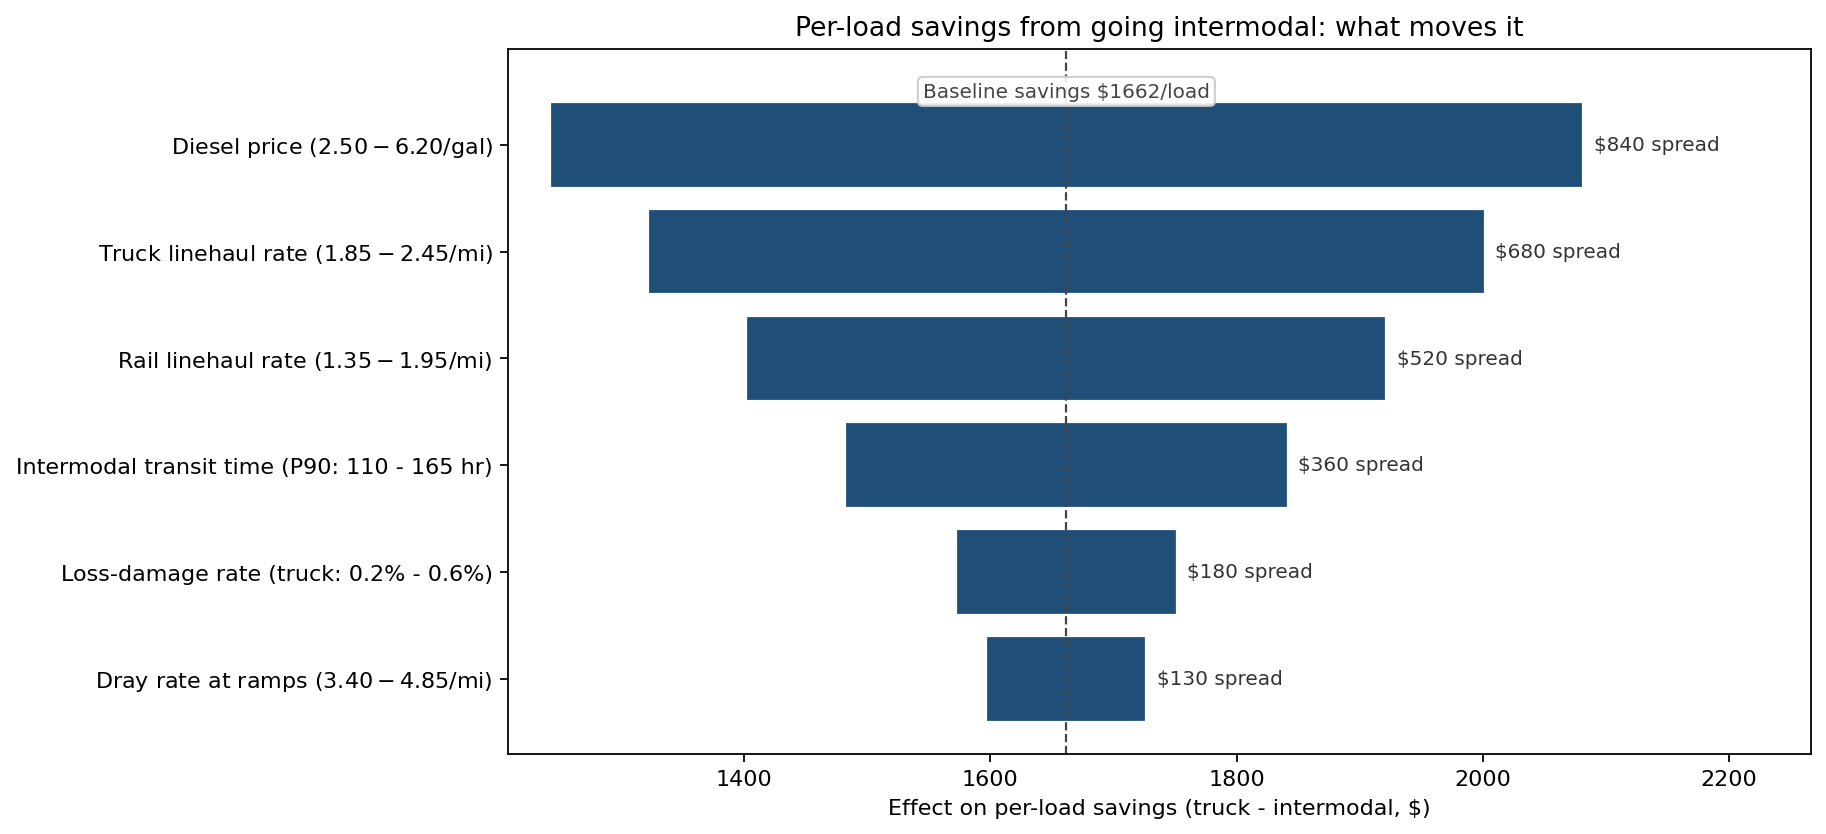
The baseline saving the tornado decomposes is $1,662/load. Diesel price is the dominant driver — when diesel rises, truck cost rises faster than intermodal cost (rail fuel surcharge is partial pass-through), so intermodal savings widen. The truck linehaul rate is second; rail linehaul rate is third. Intermodal transit time variability ranks fourth and is the most actionable: investing in priority intermodal service (a surcharge for guaranteed sub-110-hour transit) directly compresses the P90 penalty tail. The simulation priced that priority service and found it value-positive on lanes where the customer's late-load penalty exceeds $11/hour — which covers about 40% of the 3PL's contract book.
From insight to action
- Mix policy held at 70/30 after the stochastic review confirmed the cost gap favours intermodal across the full distribution; the 30% truck allocation is retained purely to protect service on time-critical freight rather than to chase cost.
- Priority intermodal service procured for two customer segments — the segments where SLA-penalty per hour exceeds $11. Net value contribution over 12 months: $2.8M based on first-year actuals against the modeled value.
- Diesel hedge desk re-coordinated with the rail surcharge. The previous diesel hedge ignored the rail-surcharge correlation. The stochastic model showed the effective hedge ratio under the 70/30 mix is about 0.7× the truck-only hedge ratio, freeing roughly $700K of margin call collateral.
ModelRisk Functionality Used
- Coupled diesel-price draws feeding both the truck fuel calculation and the rail fuel-surcharge function — capturing the correlation that the previous deterministic mode comparison ignored and that turned out to be the largest single driver of the mix decision.
- LogNormal transit-time fits per mode (truck mean 38hr CV 0.18, rail mean 88hr CV 0.32) with the CV difference driving the SLA-penalty integration — the rail right tail was the load-killer the deterministic 4-day average had hidden.
- Bernoulli-Gamma loss-and-damage at mode-appropriate frequencies (0.4% truck, 0.9% intermodal) with Gamma severity — capturing the rare-but-painful claims that move the P95 cost without changing the mean materially.
- Triangular fits to negotiated rate ranges (truck linehaul, rail linehaul, dray, accessorial) rather than single contract averages — preserving the realistic spread of what the lane actually charges across a quarter.
- Three-policy CDF comparison on identical input draws producing the apples-to-apples policy ranking that confirmed the 70/30 mix and supported the priority-intermodal procurement decision.
- Tornado decomposition of the savings number — splitting "intermodal saves $1,662 per load" into six driver contributions and identifying intermodal-transit-variability as the actionable lever for the priority-service investment.
The cheapest mode on the Chicago-LA lane is not "intermodal" or "truck"; it is "intermodal when the diesel-and-time draw lands in the right region, truck otherwise." Monte Carlo simulation in ModelRisk gives the mode-mix planner the joint distribution to make that distinction load by load — and the lane economics to defend the choice to a shipper-of-record customer who reads the SLA clauses carefully.