

Industry: Transportation
Product: ModelRisk
Application: Fleet Optimization
720 Tractors, Three Policies, Seven Years: Picking a Replacement Cycle Under Diesel Risk
Buying a Class-8 sleeper tractor in 2026 is a $142,000 decision that locks in seven years of fuel exposure, maintenance escalation, and residual-value gamble. Scaling that to a 720-tractor regional carrier — and layering on a real strategic option (a 25% Class-8 battery-electric mix on urban-tail routes at $245,000 per truck) — turns the replacement-cycle question into a multi-million-dollar bet on diesel price paths, residual markets, and maintenance escalation curves. The deterministic comparison the CFO inherited ranked the all-diesel cycles against a single forward curve and stopped there. The simulation told a sharper story: the 5-year diesel cycle is genuinely cheaper than the 7-year diesel cycle on most paths — but the EV-mix policy beats both, and does so precisely where it matters, in the expensive diesel-shock tail.
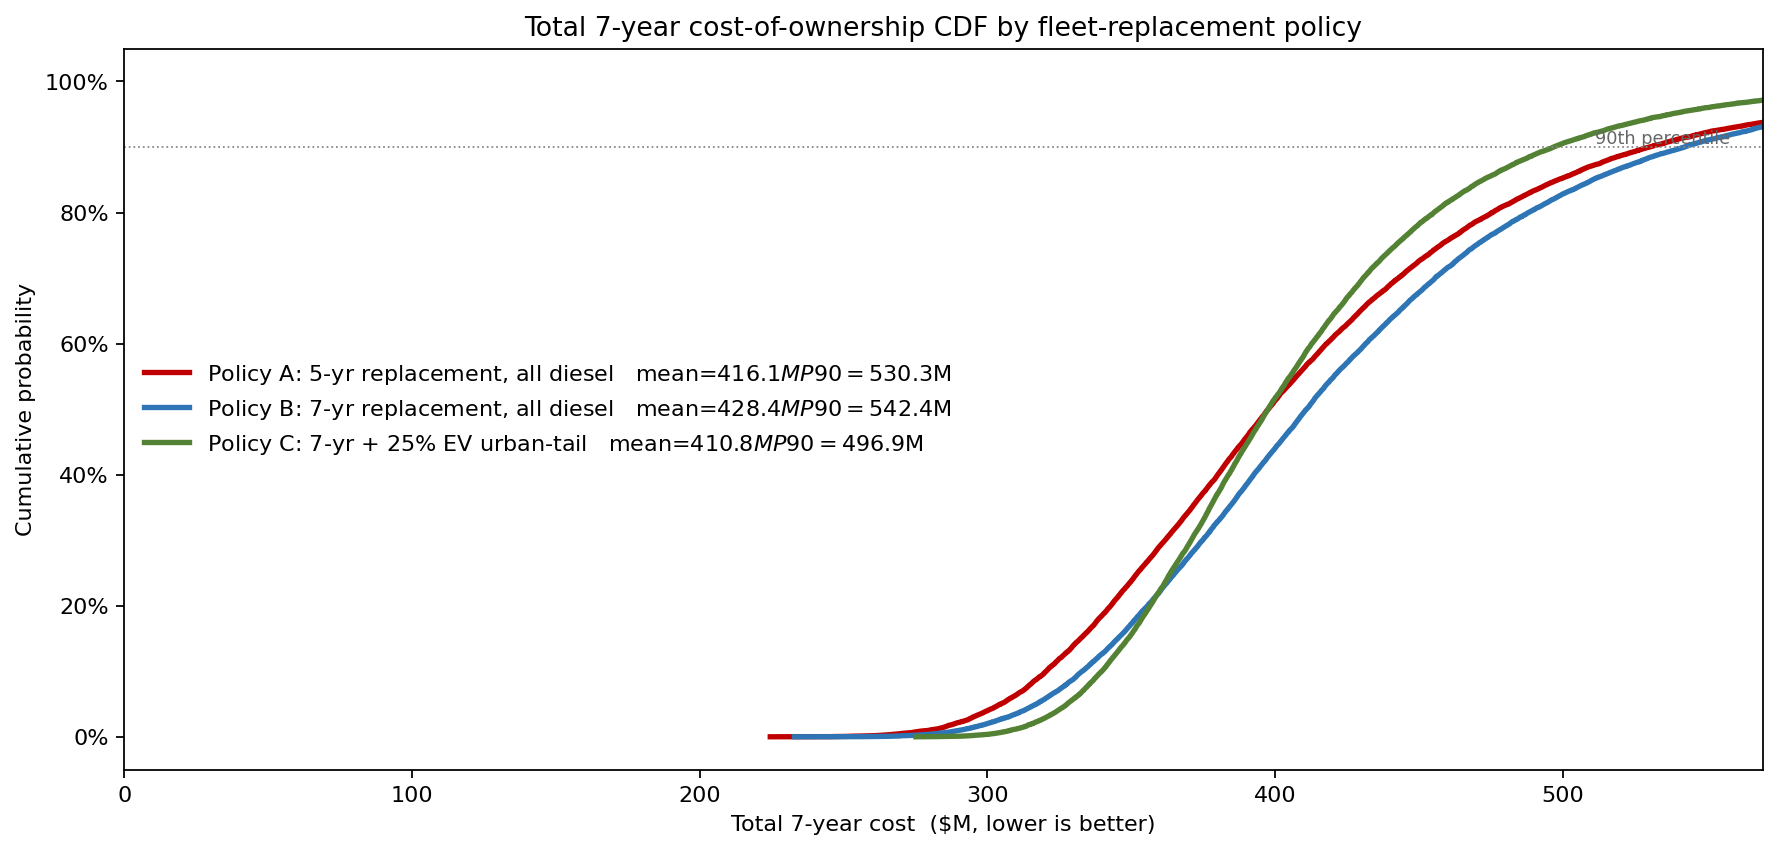
The three CDFs above are the decision. A 720-tractor regional carrier rebuilt the seven-year fleet-strategy NPV in ModelRisk to produce them — 25,000 paired scenarios per policy, each policy priced on identical diesel, electricity, maintenance and residual draws. The point was not to confirm a deterministic ranking; it was to see the shape of each policy's cost under the diesel-price scenarios the next seven years will plausibly contain.
Diesel as a path, not a number
The single biggest input is the diesel price path. The deterministic model uses a forward curve average of $3.85/gal, gently rising at the company-standard 1.5% real drift. A GBM is the textbook default — and it is the wrong choice for diesel. Diesel exhibits jump behavior (refinery outages, geopolitical shocks, hurricane-season Gulf disruptions) that a plain log-normal walk literally cannot generate.
The model used is jump-diffusion: a diffusive log-normal at 18% annual volatility plus a Poisson(0.25/year) jump process with N(0.10, 0.15) log-amplitude. Because the jumps are upward-skewed, the simulated 7-year-average price drifts well above the smooth forward curve: mean $4.64/gal, with a P10 / P90 band of $2.80 / $6.87 per gallon and a long right tail beyond $7 in roughly 17% of scenarios. That asymmetry — cheap downside, expensive and fat upside — is exactly what a deterministic average erases.
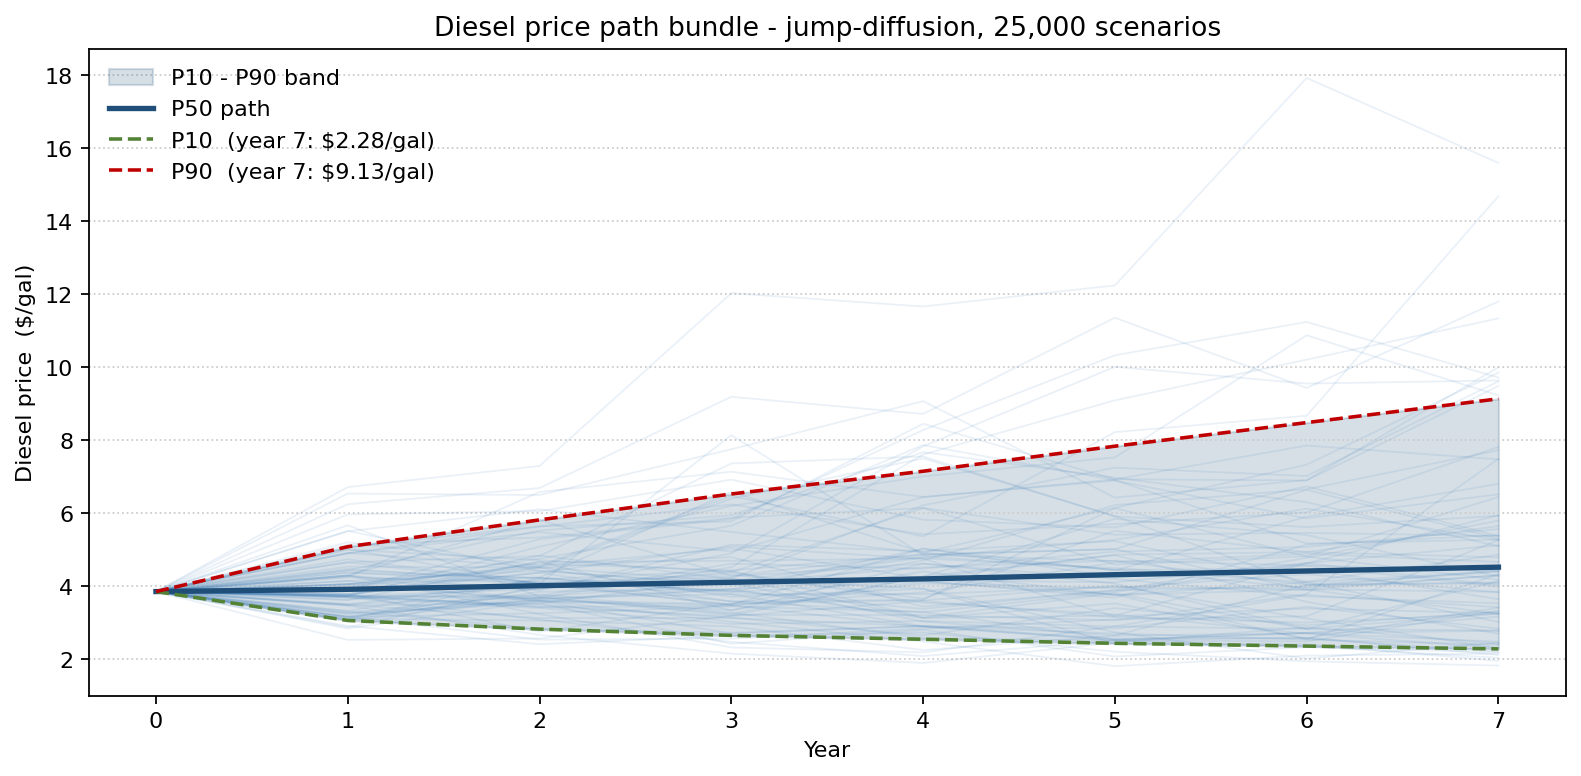
Each colored thread is one simulated diesel future the fleet might operate inside. The P10/P90 band widens substantially after year 3 — which is exactly where the 5-year-cycle and 7-year-cycle policies diverge in their fuel exposure. The deterministic average draws a single line through the middle and prices the policies against it.
Three policies, one stochastic worksheet
The model evaluates three policies on identical diesel/maintenance/residual draws — 25,000 scenarios each:
- Policy A — 5-year replacement, all diesel. Higher capex, lower per-vehicle maintenance, higher residual capture.
- Policy B — 7-year replacement, all diesel. Lower capex per year, steeper maintenance escalation in years 5-7 (Gamma-distributed at 1.18× per year of age), lower residuals.
- Policy C — 7-year replacement + 25% EV mix on urban-tail routes. $245,000 per BEV tractor including charging-infrastructure share, 1.7 kWh/mile, electricity around $0.115/kWh, BEV maintenance at 60% of diesel maintenance.
The residual values at sale are Beta-distributed (because residual % is bounded on [0,1] — using Normal here would let the simulator price tractors at negative resale value). Mean residual is 38% at 5 years, 26% at 7 years, 15% at 9 years based on Class-8 secondary-market history.
What the policy ranking actually looks like
Read the CDFs left to right. Between the two all-diesel policies the ranking is unambiguous: Policy A (5-year) is cheaper than Policy B (7-year) almost everywhere — its curve sits to the left of B's at every cost level. A's mean total cost is $416M against B's $428M, and A is the cheaper of the two on about 55% of paths. The intuition the 7-year cycle was supposed to buy — defer capex, ride the trucks longer — is overwhelmed by steeper late-life maintenance escalation (Gamma at 1.18× per year of age) and weaker residual capture at 7 years (26%) versus 5 years (38%). On the all-diesel question, the deterministic ranking and the simulation agree: keep the 5-year cycle.
Policy C (the EV-mix policy) is where the simulation earns its keep. Its mean is the lowest of the three at $410M, but the real story is the tail: C's P90 cost is $497M against A's $530M and B's $542M — roughly $33M of upper-tail compression versus the incumbent A. Diversification across the diesel/electricity price split reduces the carrier's exposure to a sustained diesel shock, at the cost of a heavier upfront balance-sheet hit. C is at parity with A on the cheap side and pulls clearly ahead on the expensive side; it is cheaper than A on about 50% of paths and cheaper than B on about 55%.
This is the "Why Monte Carlo" beat in fleet finance: the deterministic NPV ranks the policies on one forward curve; the stochastic NPV shows that the policy you actually want is the one whose cost shape survives the diesel paths you cannot rule out — and that policy is C, chosen for its tail, not its mean.
What actually drives the total cost number
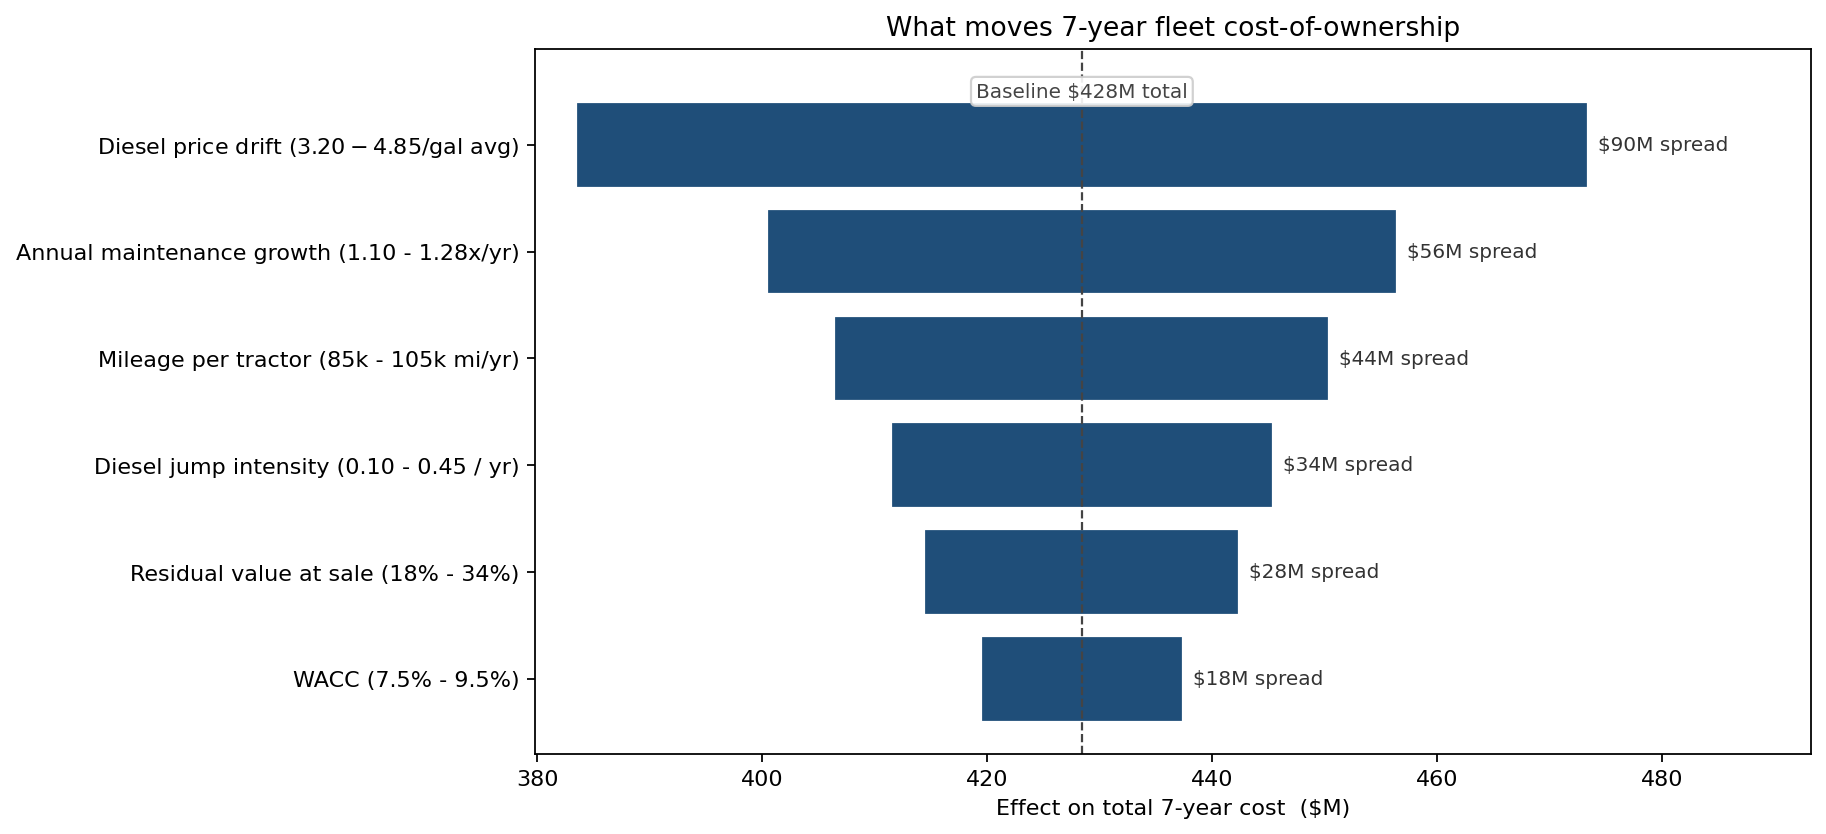
Diesel price drift dominates — a $45M spread, by far the largest mover. Maintenance growth rate (per-year escalation factor) ranks second at $28M, mileage per tractor third at $22M. Diesel jump intensity — the parameter that distinguishes the jump-diffusion model from a plain GBM — ranks fourth at $17M, ahead of residual value ($14M) and WACC ($9M). The jump term is what fattens the right tail that Policy C is built to absorb; treating diesel as smooth (GBM) would erase it and quietly understate the case for the EV mix.
From insight to action
- Policy C adopted in 2026 cohort. 180 EV tractors deployed on the urban-tail routes (sub-200-mile range envelope), with the remaining 540 tractors on the 7-year diesel cycle. Total 7-year cost improvement vs the incumbent 5-year diesel policy: about $5M expected, with a $33M (≈6%) reduction in P90 tail cost.
- Diesel-hedge program redesigned. The deterministic model had set the hedge ratio at 50% of expected consumption flat across the horizon. The stochastic model showed that hedge value drops sharply after year 4 (residual fleet thins), and that front-loading the hedge to 70%-years-1-3, 30%-years-4-7 captured roughly $1.6M of expected hedge cost-effectiveness without changing notional exposure.
- EV-fleet exit option valued. The model priced an embedded option: if EV residual markets fail to develop, the carrier can swap out EVs after year 5 at a salvage haircut. The option value (computed via the difference between EV-mandatory-keep and EV-with-exit NPV distributions) came in at $2.1M — material enough to put into the procurement contract negotiation.
ModelRisk Functionality Used
- Jump-diffusion diesel price simulation with diffusive volatility 18% and Poisson(0.25/year) jumps of N(0.10, 0.15) log-size — replacing the GBM the previous in-house model used and, critically, the textbook-incorrect choice that masked the worst-case scenarios.
- Beta residual-value distributions at 5, 7, and 9 years calibrated to Class-8 secondary-market data — with the modeler explicitly choosing Beta over Normal so that the simulator could not draw negative or super-100% residual percentages.
- Gamma maintenance-cost-by-age model with shape 4 (CV 0.5) and an 18%-per-year-of-age mean escalation, so that the cost of running a tractor rises steeply in the back half of a 7-year cycle — the mechanism that erodes the 7-year cycle's capex advantage.
- Stochastic electricity-price simulation for the EV-mix scenarios at $0.115/kWh mean and ~17% annual vol, bounded to the $0.07–$0.20/kWh envelope the carrier's incumbent utility tariff allows.
- Three-policy paired simulation on identical input draws across 25,000 scenarios, producing the CDF comparison that ranked the all-diesel cycles (A ahead of B) and surfaced the EV-mix policy C as the tail-cost winner the deterministic forward curve could not reveal.
- Embedded-option valuation as the difference between two NPV distributions — pricing the EV-exit clause as $2.1M and putting a defensible number in the procurement contract.
Fleet-strategy NPV is not a number; it is a distribution over diesel paths, electricity paths, and residual-market paths. Monte Carlo simulation in ModelRisk lets a fleet director defend the replacement-cycle decision not as "which is cheaper on the central forecast?" but as "which has the cost shape we are willing to live inside?" — and that reframing is what makes the EV trade-off legible to the board.