

Industry: Transportation
Product: ModelRisk
Application: Fleet Management
What's Rolling Tomorrow? Probabilistic Availability for a 480-Tractor Fleet
A 480-tractor regional trucking fleet has 410 loads booked for tomorrow and a deterministic plan that says 441 tractors will be available — a comfortable 31-tractor buffer. The deterministic plan is correct on average. It is also misleading on roughly a third of operating days, because availability is not a single number, it is a distribution, and a fleet manager who treats it as a number absorbs the variance through sub-rentals, brokered spot capacity, and breakdown overtime that never appear in the budget line they were charged against.
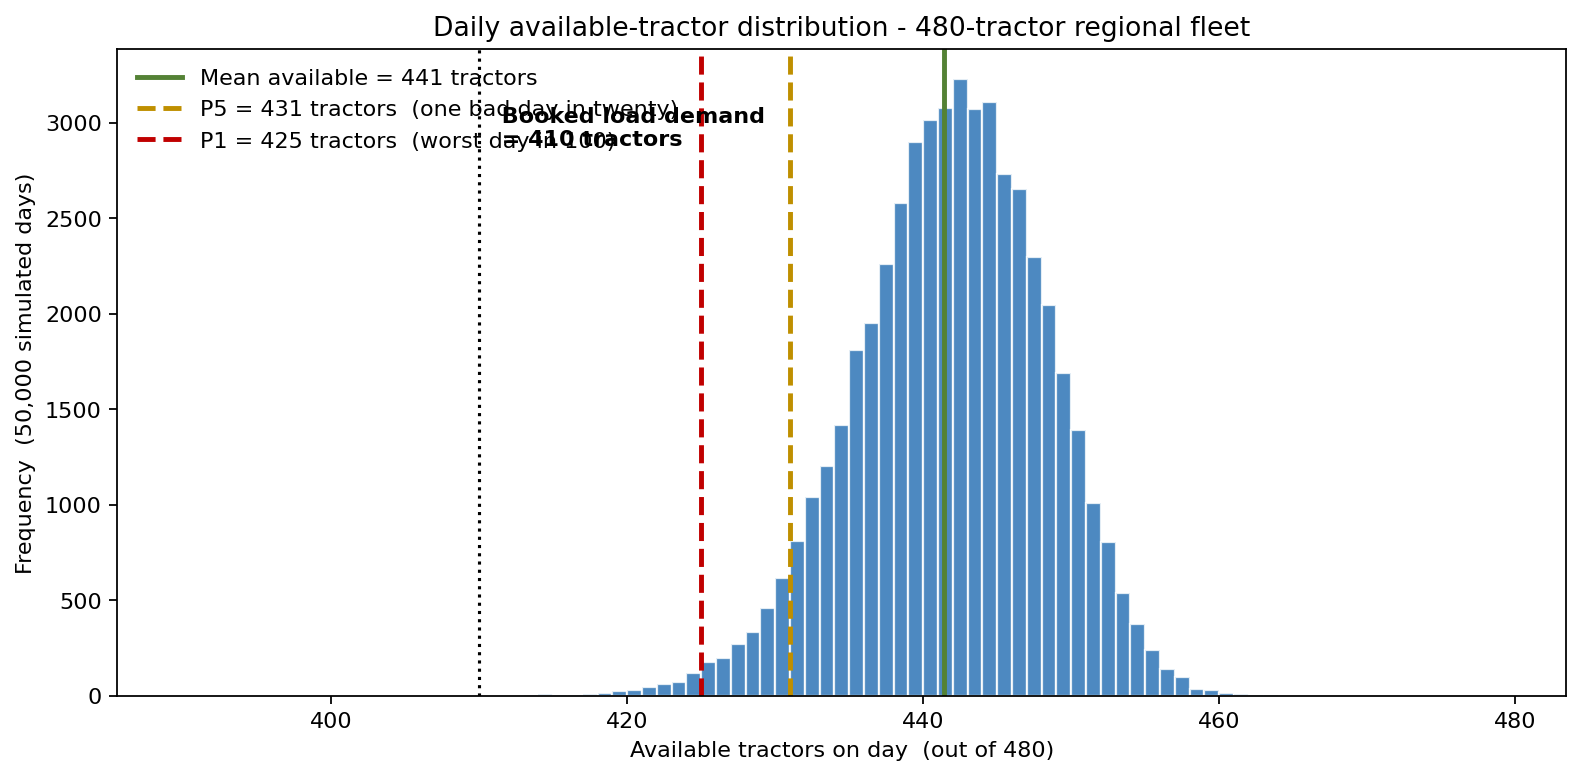
The distribution above is the whole argument. The mean sits at 441 available tractors, but the left tail reaches down to 431 on one day in twenty (P5) and 425 on the worst day in a hundred (P1) — and on roughly 31% of days, the buffer over booked-plus-spot demand goes negative. A regional carrier rebuilt its tomorrow-morning availability model in ModelRisk to expose exactly this. The change reframed the daily 6 AM dispatch question from "do we have enough trucks?" to "what is the probability we're short, and how short are we when we are?" — and produced a credible business case for tightening the preventive-maintenance trigger from 35,000 miles to 28,000 miles.
Where availability really lives
Four sources of daily unavailability stack on top of one another:
Unscheduled breakdowns. Per-tractor, per-day failure probability is roughly 1.8% at this fleet's age profile (mean rolling mileage 18 months out of overhaul). A naive Binomial(480, 0.018) gives a mean of 8.6 breakdowns per day and a standard deviation of 2.9 — neat and tight. The historical data shows a much wider spread. The explanation is the daily shock: a cold snap, a fuel-quality batch, a bad season of tire wear — these correlate failures across the fleet. The model layers a Gamma(8, 1/8) daily multiplier (mean 1, CV ≈ 0.35) on the per-tractor probability, producing a per-day breakdown count with mean 8.6 and a P99 of 21. The independence assumption in the deterministic plan understates extreme days by more than a factor of two.
Scheduled preventive maintenance. At the current 35,000-mile PM trigger, roughly 5% of the fleet (24 tractors) is in the shop on any given day, modeled as Binomial(480, 0.05).
Driver no-shows. Sickness, HOS reset, attrition: 2.2% per driver-day, Binomial(480, 0.022) — about 10.6 tractors a day idled by missing drivers rather than missing trucks.
Tractors are unavailable as the sum of these three. Available = 480 − unavailable. Mean ≈ 441. P5 ≈ 431. P1 ≈ 425.
What the deterministic answer hid
The deterministic dispatcher comparing "441 available vs 410 booked" reported a 31-tractor buffer and went home. But booked loads are not the whole demand: spot-load demand adds a Poisson-distributed 28 tractor-days on top. Against booked-plus-spot demand, the simulation reports a shortfall on roughly 31% of days, with a mean shortfall of about 6 tractors on the days it occurs. The probability of being short by more than 5 tractors — the threshold at which the sub-rental market tightens and brokered capacity becomes necessary — is about 14%. The probability of being short by more than 10 — the threshold at which loads roll to the next day and revenue is at risk — is about 5%.
This is the "Why Monte Carlo" beat. A point-estimate buffer of 31 looks fat against booked loads alone. A distribution of net buffers, short on nearly a third of days once spot demand is layered in, looks like a real operational risk that has been masquerading as overhead.
A real policy question: tighten the PM trigger?
The maintenance director proposed dropping the PM trigger from 35,000 miles to 28,000 miles. The trade-off is mechanical: more scheduled downtime (about 7% of fleet vs 5%) in exchange for fewer unscheduled breakdowns (about 1.1% vs 1.8% per tractor-day, based on prior cohorts of tightened-PM trials). The deterministic comparison was a wash — total unavailable tractors moved by less than 1. The probabilistic comparison was not.
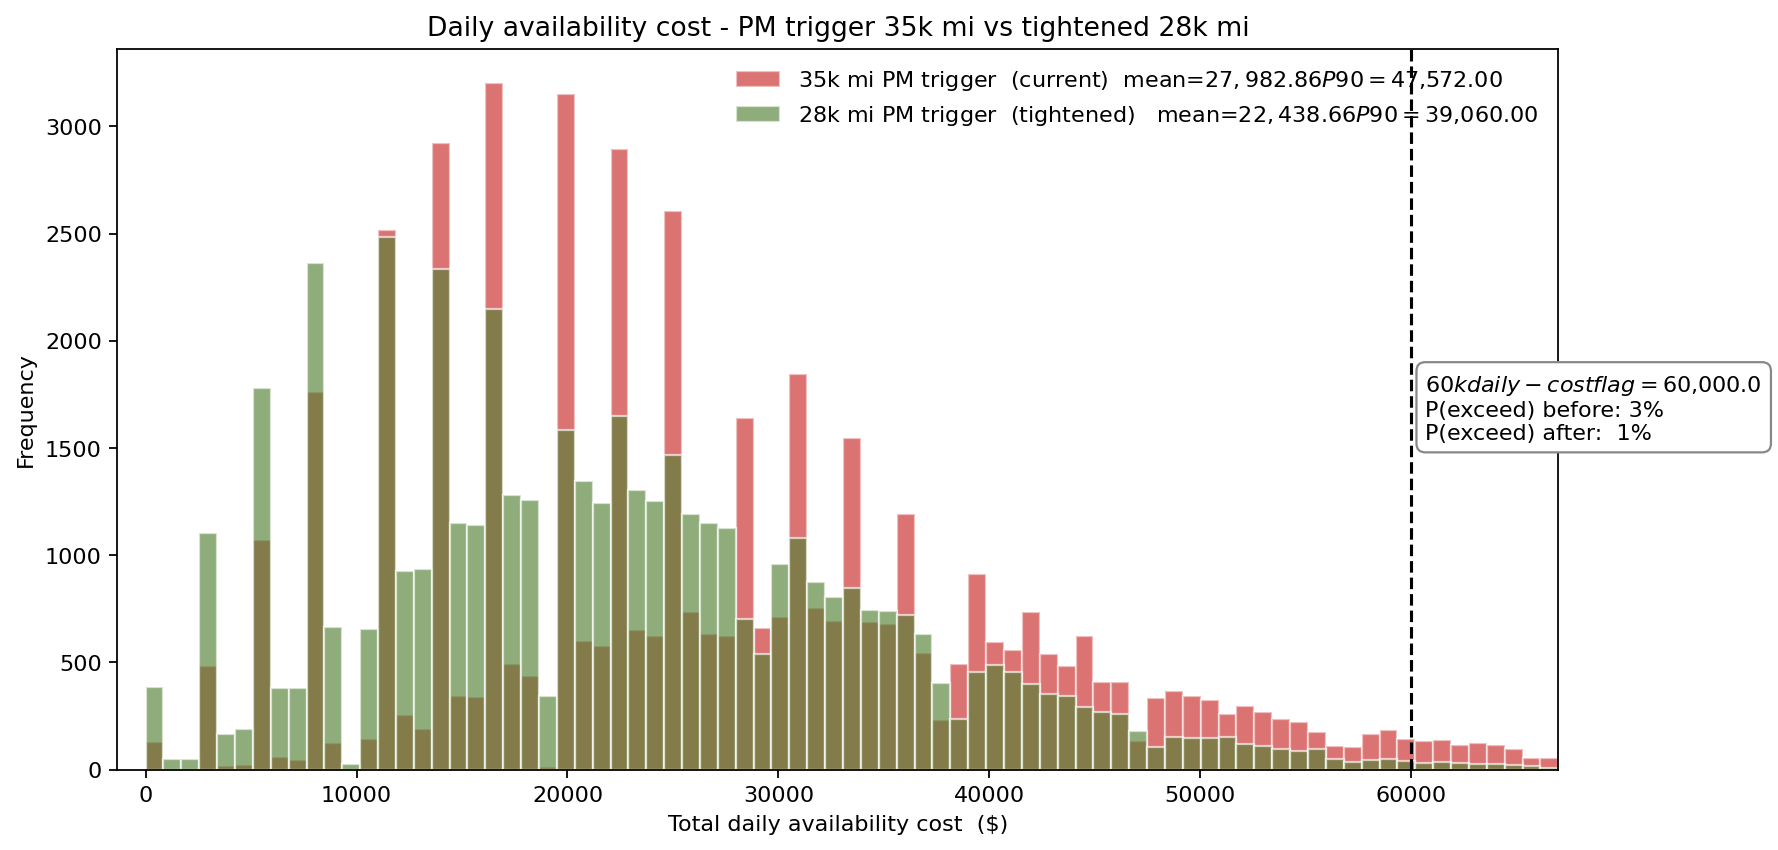
The tightened-PM policy moves the mean daily availability cost down by roughly $5,500 — from about $28,000 to $22,400 per day, about $2.0 million annualized — because the cost is dominated by unscheduled breakdowns at $2,800 per event plus the spot-rental and revenue-loss tail of short-availability days. Critically, the right tail compresses more than the mean shifts: the 90th-percentile day falls from about $47,600 to $39,100, and the probability of a single day exceeding the $60,000 "executive flag" cost threshold falls from 3.5% to 0.6%. The policy decision is not "trade 24 PM tractors for 34 PM tractors"; it is "trade a small predictable cost for a large unpredictable one."
What actually drives availability cost
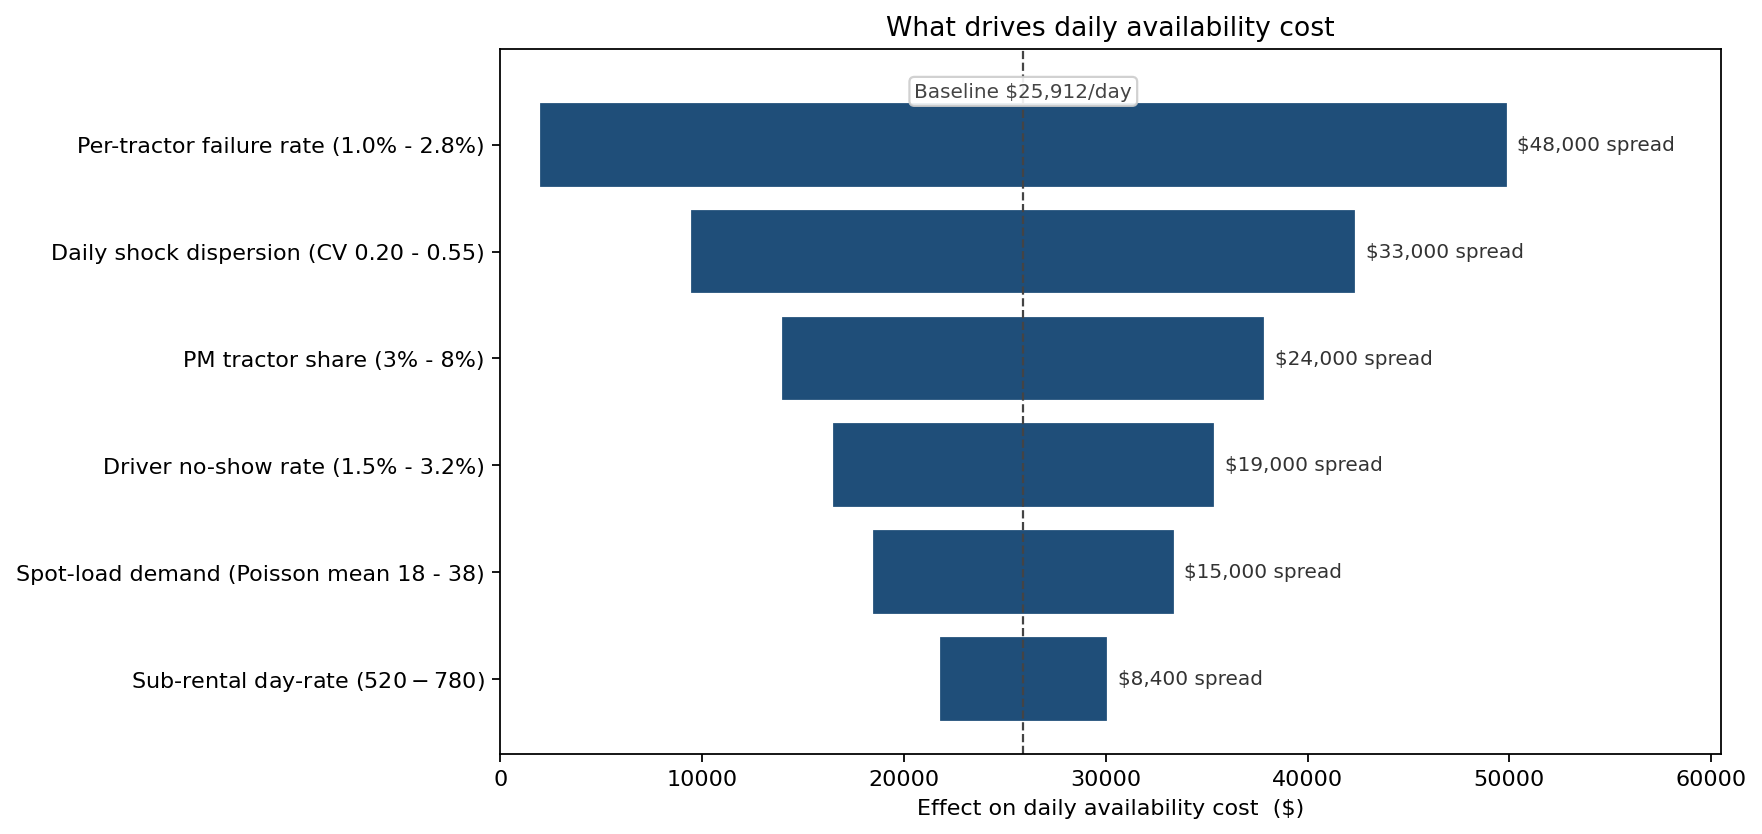
The per-tractor failure rate is the biggest mover — half the daily cost spread lives there. The daily-shock dispersion ranks second, which is the parameter the deterministic model has no way to express at all. Driver no-show ranks fourth, ahead of spot-load demand and well ahead of sub-rental day-rate — the intuitive driver "fuel and rental cost" is actually a minor mover compared with operational reliability.
From insight to action
- PM trigger tightened to 28,000 miles across the regional fleet. Twelve-month track record matched the simulation within $300k of the projected $2.0M annual operational cost reduction.
- Daily availability ribbon added to the 6 AM dispatch board: instead of "441 trucks available today" the board now shows "P5: 431, P50: 441, P5-shortfall vs demand: 4." Spot-broker outreach is triggered preemptively on days where weather or batch-quality flags indicate the shock multiplier is in the right tail.
- Driver no-show campaign re-prioritised. Because no-shows ranked above sub-rental cost on the tornado, the operations team redirected $200k of "fuel cost reduction" budget into an attendance-incentive pilot. The simulation, not the cost ledger, made that case.
ModelRisk Functionality Used
- Binomial daily-failure modeling with Gamma over-dispersion shock — capturing the correlated-failure mode that pure Bernoulli independence misses, calibrated to the observed variance-to-mean ratio of historical breakdown counts.
- Stacked unavailability sources (breakdowns + PM + no-shows) composed inside a single ModelRisk worksheet, with each source's distribution defensible against its own historical record.
- 50,000 simulated operating days producing the available-tractor distribution and the shortfall-cost distribution side by side, enabling the executive flag threshold to be set probabilistically rather than by hunch.
- Policy comparison via paired simulations of the 35k-mile and 28k-mile PM triggers on matched shock draws, isolating the policy effect from the demand-and-weather noise.
- Tornado analysis ranking six availability drivers and demoting the assumed-top driver (sub-rental day-rate) to last — redirecting the next year's capital priorities.
- Threshold-probability outputs (P(short > 5), P(short > 10)) in the format the operations VP uses for daily standup, rather than the expected-value language the finance team uses for budgeting.
A fleet's availability is not 441; it is a distribution centered on 441 with a left tail that costs money the budget never plans for. Monte Carlo simulation in ModelRisk surfaces that distribution day-by-day and policy-by-policy — and turns maintenance, dispatch, and driver-attendance investments into decisions framed in the same language: how much does this option shave off the unavailability tail?