

Industry: Transportation
Product: ModelRisk
Application: Delivery Optimization
Squeezing a Last-Mile Route: Where Cost-per-Stop Actually Lives
The cost-per-stop number on a last-mile parcel route looks like a textbook arithmetic exercise — driver wage plus fuel plus a sliver of overhead, divided by stops delivered. The dispatcher's deterministic spreadsheet says $2.85 a stop on the company's flagship 140-stop metro route. Run the same route 60,000 times in Monte Carlo and the picture changes, as the distribution below shows: the mean is $3.22, the 90th-percentile day is $3.77, the 99th-percentile day is $4.77, and about one route in three slides into overtime past the 9.5-hour mark. The deterministic number is a one-day average that the operation will almost never actually see.
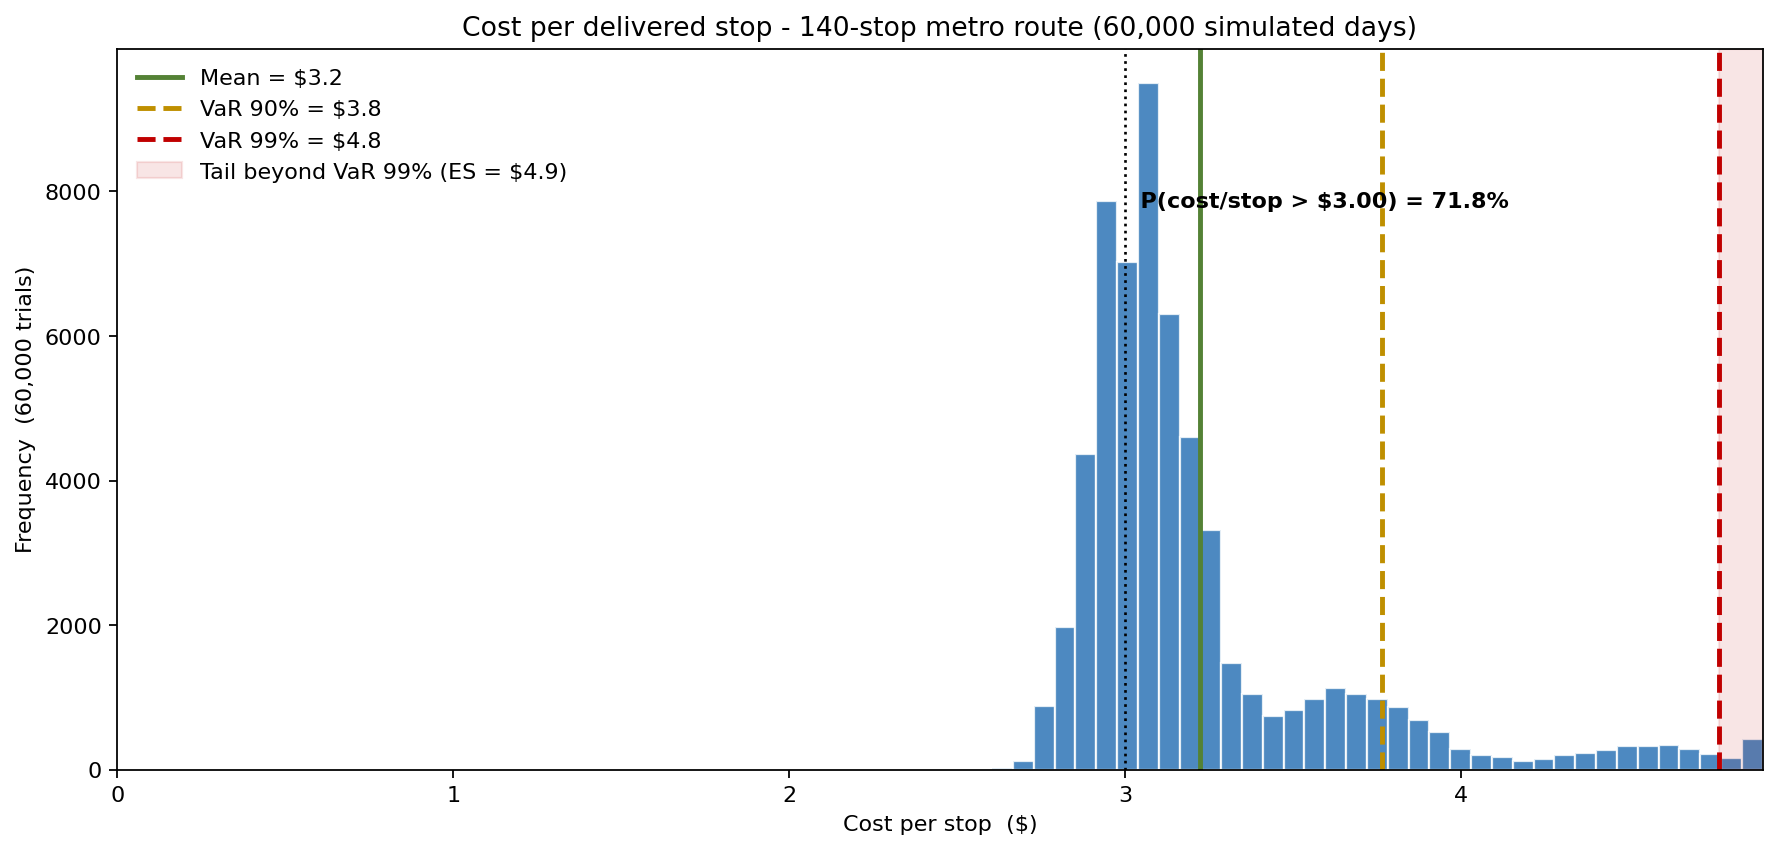
A regional parcel carrier rebuilt the cost model for its dense urban routes in ModelRisk. The question was not "what does a route cost?" but "what is the shape of the cost distribution, and which loading policy bends the right tail?" A 140-stop route is a chain of 140 small uncertainties — stop dwell time, parking, recipient absent, driver pace, signature requirements — and they don't average away when you stack them.
Building the cost-per-stop distribution
The route cost is decomposed into four uncertain elements:
Per-stop service time was fitted as a LogNormal with mean 1.55 minutes and CV 0.55 from 90 days of handheld-scanner timestamps. LogNormal — not Normal — because residential parcel times are bounded below by zero, skew right (signature stops, recipient-absent re-attempts), and the historical histogram shows the long right tail. A single shared route multiplier ~ LogNormal(0, 0.12) couples the 140 stops within a day: when a neighborhood is congested, both dwell and inter-stop drive lengthen together.
Inter-stop drive time averages 2.3 minutes per leg in this metro density, modeled with the same shared route multiplier. The product 140 × (1.55 + 2.3) / 60 = 8.98 hours is the deterministic point estimate — which sits very near the simulated mean of 9.06 hours but hides the 19.5% probability of exceeding 10 hours (and a 32.7% chance of tipping into overtime past 9.5 hours).
First-attempt miss rate is a per-stop Bernoulli with 7% baseline probability, rising to 13% on routes that run past 10 hours (driver-rush effect estimated from prior-quarter A/B). Missed parcels generate a $6.20 reattempt cost each. Overtime at 1.5× wage triggers above 9.5 hours; the SLA breach penalty of $75 hits at 11+ hours.
What the deterministic dispatcher missed
The deterministic build said $2.85 per stop. The simulation says the mean is $3.22, the median is $3.09, and the 90th-percentile day is $3.77. The probability of breaching the operations director's $3.00-per-stop target is 72% — closer to three days in four than to "every other day." The probability of exceeding $3.50 is 17%. The 99th-percentile day costs $4.77 per stop, which is what the route really looks like when traffic, a difficult delivery cluster, and overtime all land in the same shift.
This is the "Why Monte Carlo" beat: the deterministic answer doesn't even reach the median of route days, and route economics are dominated by the right tail of overtime and reattempt cost that the deterministic answer can't see at all.
Tight loading vs buffered loading
The most consequential decision the planner makes every morning is how many parcels to put on the truck. The simulation evaluated two policies against each other: a tight policy at 155 stops per route and a buffered policy at 125 stops per route, each run 60,000 times.
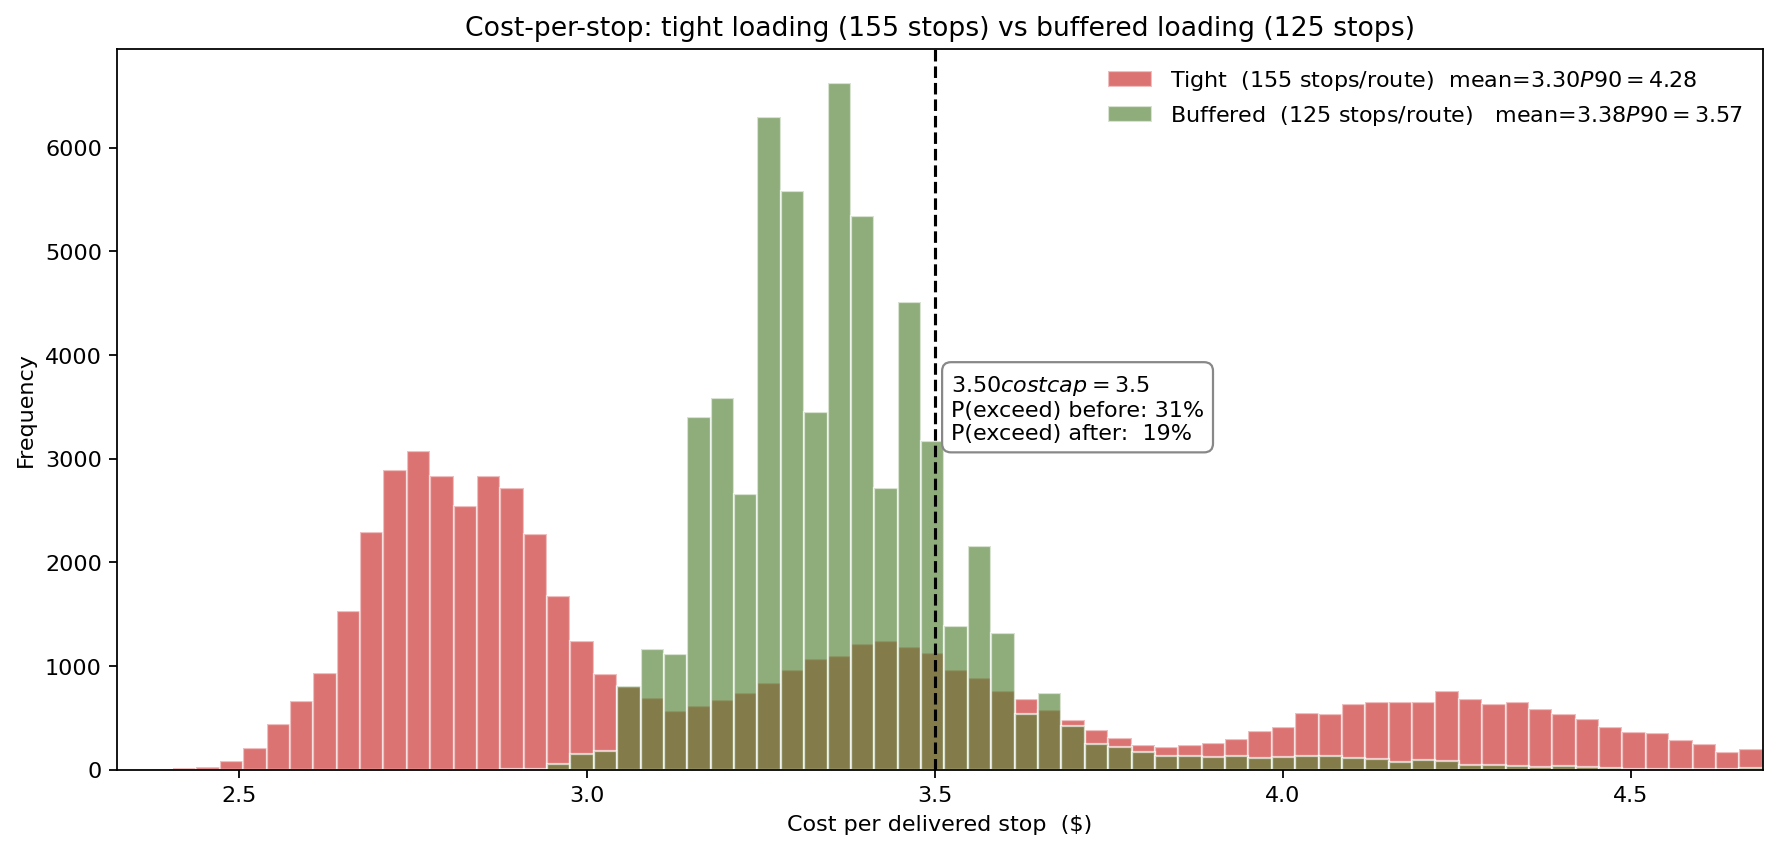
The tight policy looks slightly better on the headline cost-per-stop number — $3.30 vs $3.38 mean, fewer fixed-cost dollars spread across more stops — but the distribution tells the real story. The tight policy lives in overtime: P(route > 11 hours) is roughly 21% versus 0.5% for the buffered policy, and its cost-per-stop has a long right tail stretching past $4.50. The buffered distribution is concentrated around $3.4 with almost no tail — its P90 is $3.57 against the tight policy's $4.28. The redelivery and overtime drag on tight routes erodes the per-stop dilution and then some on bad days, and the worst 10% of tight days are far more expensive than the worst 10% of buffered days. The CFO's preferred answer flips from "load more" to "load to a duration target, not a parcel-count target."
What actually moves the cost number
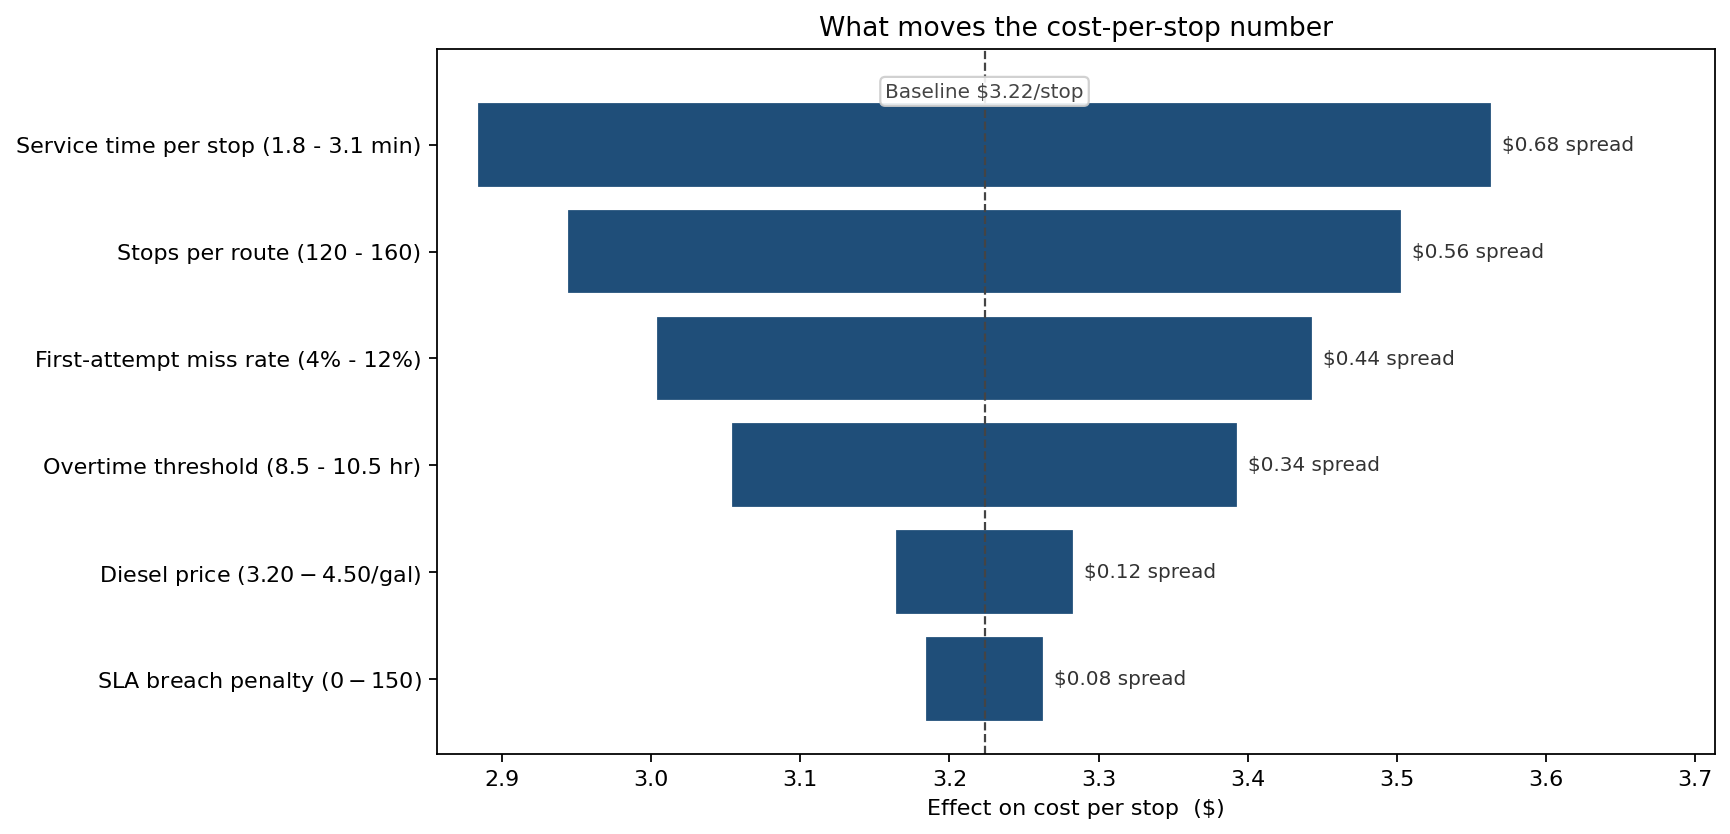
The biggest mover is per-stop service time (the 1.8–3.1 minute range produced by recipient mix and parcel size). Stops per route ranks second — the loading policy decision. Critically, diesel price ranks fifth, well behind the operational drivers. The intuitive temptation when fuel spikes is to redesign the route; the simulation says the marginal return is small. The marginal return on shaving 20 seconds off average dwell time — through better hand-off scoring, smarter dispatch sequencing, or shorter doorstep dialogue — dwarfs it.
From insight to action
- Cost target reset. The $2.85 deterministic target was retired in favor of a median $3.09 / P90 $3.77 target pair. The board now reviews the planning-week distribution, not the planning-week point estimate.
- Loading policy switched to time-budgeted. Routes are loaded to a target P90 duration of 9.75 hours, not a parcel count. Average parcels per route fell from 152 to 128; overtime hours fell by 62%; total cost per parcel fell by $0.18.
- Reattempt economics in the open. Quantifying redelivery cost as a function of route length (rather than a flat 7% miss rate) made the case for the $400K spend on alternate-delivery-location lockers — break-even came in at 14 months in the model, not the 28 months the deterministic case had shown.
ModelRisk Functionality Used
- LogNormal fitting to scanner-timestamp data for the 1.55-minute, CV-0.55 per-stop service time — with the fitting dialog used to confirm the shared-route-multiplier structure rather than independent per-stop draws.
- Coupled per-stop draws via a shared LogNormal multiplier so that congested-neighborhood days correctly run all 140 stops up together — the independence assumption in the deterministic model was the largest single source of error.
- Conditional probability logic that raises the per-stop miss rate from 7% to 13% on routes longer than 10 hours, capturing the operationally observed driver-rush effect.
- 60,000-iteration distribution output that produced the cost-per-stop, route-duration, and missed-parcel histograms feeding the new planning targets.
- Tornado ranking that demoted diesel price from the perceived top driver to fifth — and elevated stop count and service time to first and second.
- Policy comparison via paired simulations of tight (155) and buffered (125) loading policies on identical demand draws, producing the side-by-side cost distributions used to defend the planning-policy change to the regional operations committee.
A 140-stop route isn't a deterministic arithmetic problem; it's a 140-link chain of small uncertainties whose right tail decides whether the day is profitable. Monte Carlo simulation in ModelRisk surfaces that tail, prices it, and turns the morning loading decision from an arithmetic average into a probability budget the dispatcher can actually defend.