

Industry: Telecommunications and IT
Product: ModelRisk
Application: Network Reliability Analysis
The metro ring marketed at 99.99% that actually delivered 99.5%
A carrier's metro fibre ring serves 1,400 enterprise customers with a contract clause that promises four-nines availability — 0.876 hours of downtime per year. The architecture documentation listed every component with its vendor-supplied MTBF and the deterministic series-parallel calculation rolled up to 99.991% — comfortably inside the SLA. Customer-reported outage minutes told a different story: the rolling 12-month average was closer to 99.5%, more than fifty times the contractual downtime budget. The gap between the architecture-diagram number and the customer-experience number was not bad luck; it was what happens when redundancy is multiplied as (1 − p)² without the matching common-cause shock and without a heavy-tailed repair-time distribution.
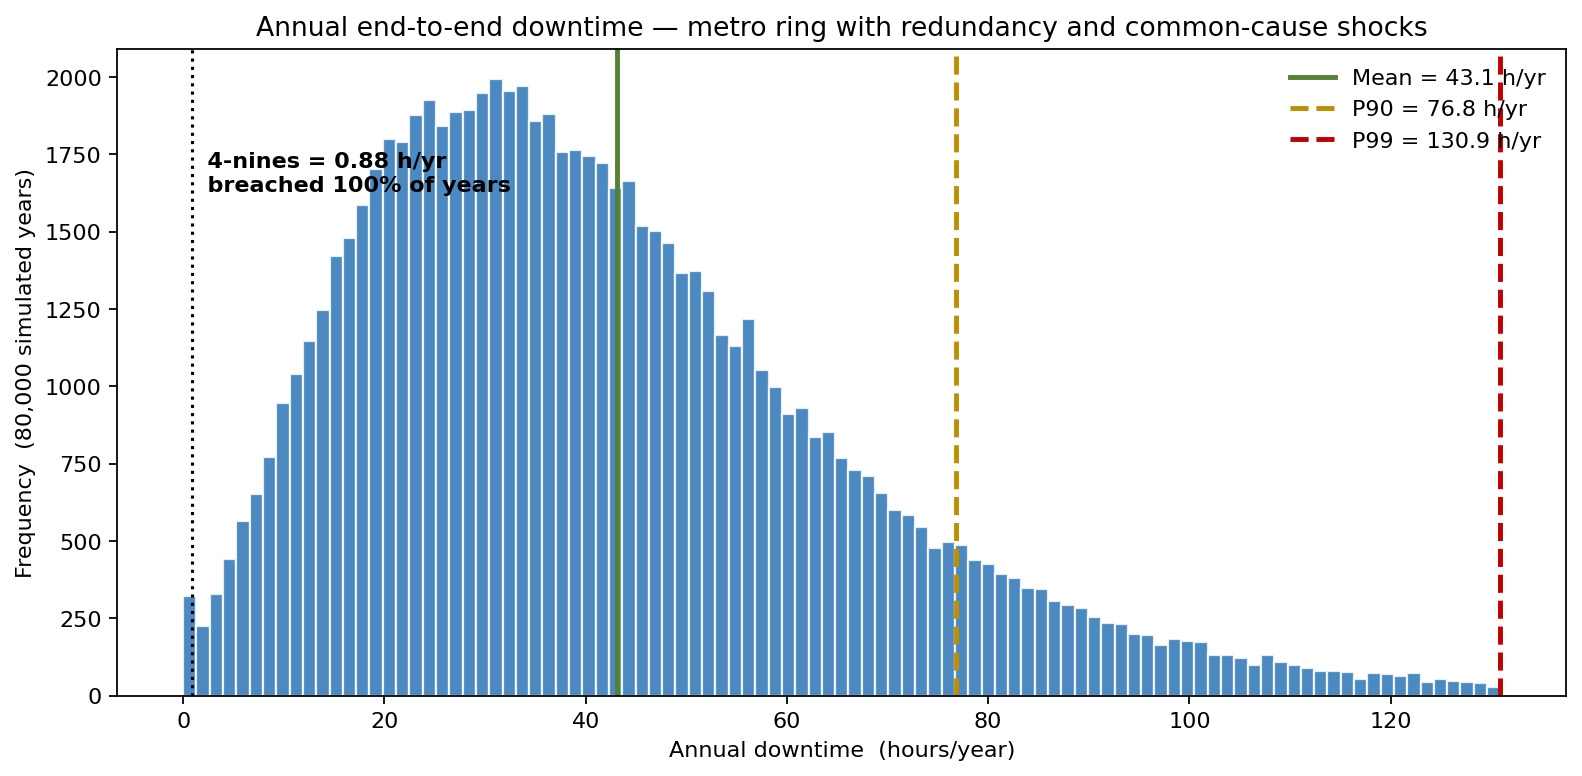
Rebuilding the same fault tree in Vose Software's ModelRisk produced a mean annual downtime of 43.1 hours, a P90 of 76.8 hours, and a P99 of 130.9 hours — and a per-component contribution ranking that targeted the next $2.9M of capex precisely.
The leaves of the fault tree
The end-to-end path through the network touches ten failure modes — seven equipment classes and three common-cause hazards. Each was modeled with its own Poisson failure rate and LogNormal mean-time-to-repair:
| Component / hazard | λ (events/yr) | MTTR median | MTTR GSD | Redundancy |
|---|---|---|---|---|
| Core router pair (1+1) | 0.45 | 3.2 h | 1.8 | 2-of-2 active-passive |
| Metro ring west fibre | 0.85 | 8.0 h | 2.2 | 1 (no second path) |
| Metro ring east fibre | 0.85 | 8.0 h | 2.2 | 1 |
| Aggregation switch (active-active) | 0.60 | 2.4 h | 1.6 | 2 |
| Access tail circuits (per-customer avg) | 3.20 | 4.5 h | 1.9 | 1 |
| DWDM optical layer | 0.30 | 6.0 h | 1.7 | 1 |
| Edge BGP peer (multi-homed) | 0.55 | 1.8 h | 1.5 | 2 |
| Site power / generator | 0.25 | 5.5 h | 2.5 | 1 |
| Carrier BGP control-plane | 0.18 | 1.6 h | 2.0 | 1 |
| Regional fibre cut (correlated hazard) | 0.10 | 14.0 h | 2.8 | 1 |
A few modeling notes worth surfacing:
- MTTR is LogNormal, not Normal. Median repair times are 2–8 hours, but a regional fibre cut can take 24-plus hours when the repair crew has to travel and splice; a Normal MTTR makes the long tail invisible.
- Redundancy is treated probabilistically. A 2-of-2 redundant pair fails when both elements are down inside the same MTTR window; the probability of that coincidence is roughly
λ × MTTR / 8760per partner, which is what the simulation samples — not the(1 − p)²shorthand that ignores repair-window correlation. - Common-cause hazards are leaves of their own. A regional fibre cut and a carrier BGP control-plane event take out multiple "redundant" elements simultaneously. Treating them as separate leaves is what lets the model capture the failures that the redundant-element calculation would otherwise hide.
What the architecture diagram literally cannot say
The deterministic series-parallel rollup multiplied component MTBFs through the diagram and reported 99.991% availability. The Monte Carlo simulation, integrating the same fault tree with proper Poisson event counts and LogNormal MTTRs, reports a mean availability of 99.51%, a median of 99.56%, and a P10 of 99.12% — a mean of just 2.4 nines. The four-nines budget of 0.876 h/yr is breached in 99.6% of simulated years; the three-nines budget of 8.76 h/yr is breached in 96% of years. The architecture diagram was never wrong about its components — it was wrong about how unredundant the metro rings actually are, and silent about the repair-time tail.
Where the hours actually come from
The per-component Pareto chart names the culprits.
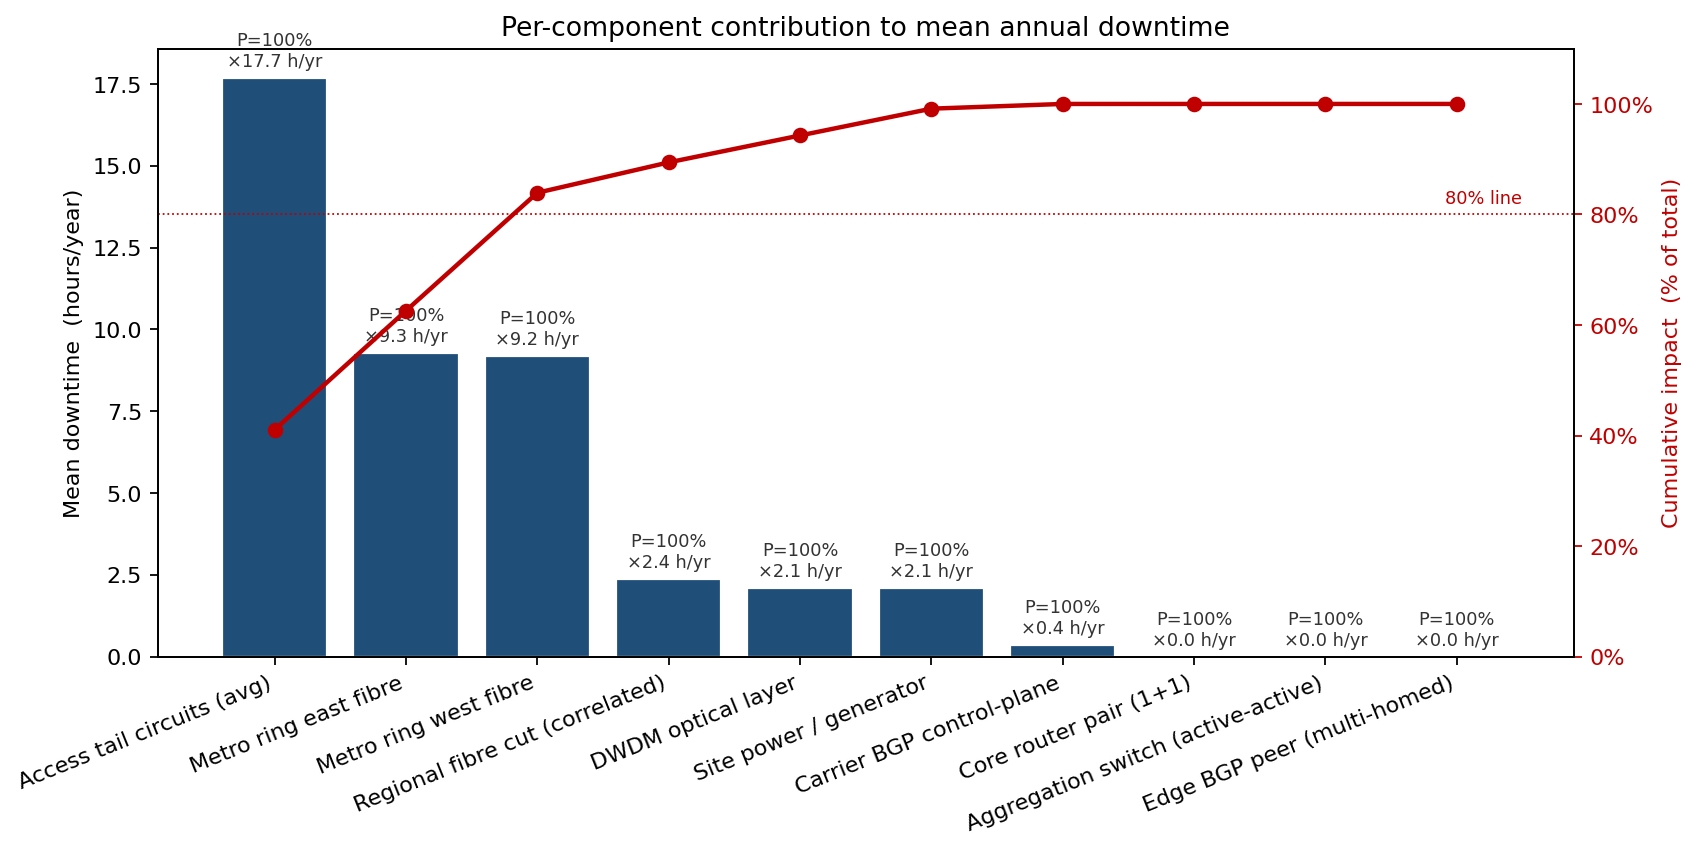
Three lines together account for roughly 84% of mean downtime: access tail circuits (17.7 h/yr), metro ring east and west fibres (9.3 and 9.2 h/yr). The redundant router and switch pairs contribute essentially nothing — the redundancy is working — and the remaining common-cause and optical hazards add a steady but secondary 2–2.4 h/yr each. The PR pitch that the network is "fully redundant" is correct in the layers where it is true; it just happens to leave the two largest contributors single-pathed.
What moves the tail
Sensitivity ranking on P99 annual downtime — the figure that determines whether the carrier hits the upper-tail SLA penalty — tells the team which dollar of investment buys the most tail compression.
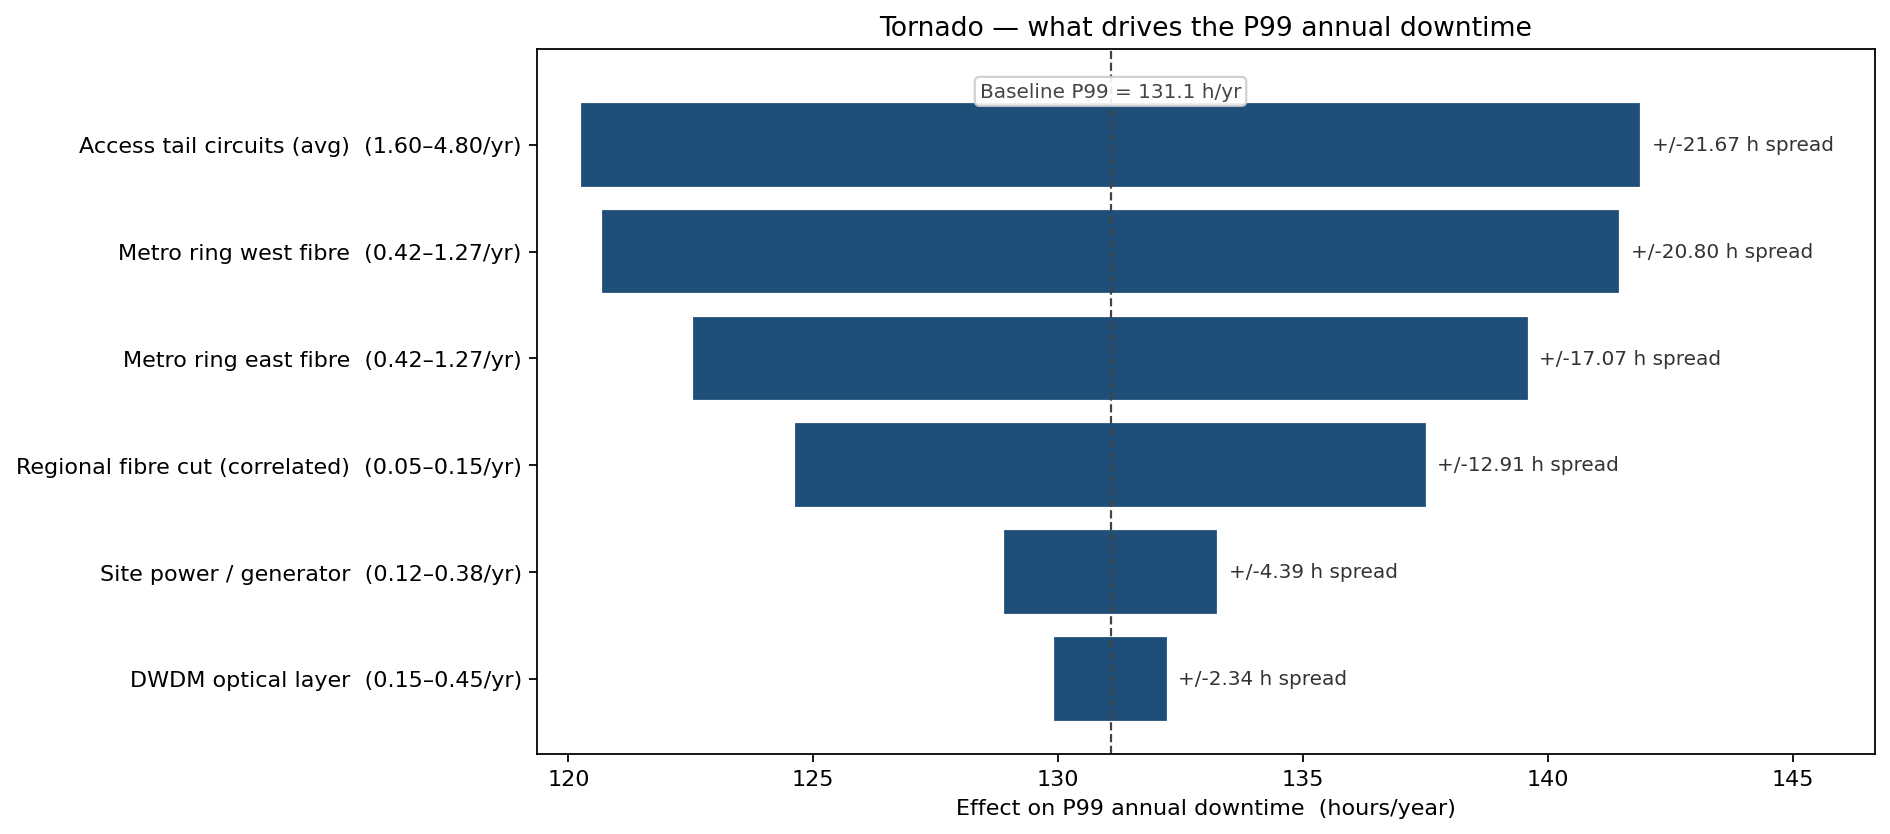
Access-tail failure rate dominates the P99 just as it dominates the mean. The two metro-ring fibres are the next-largest movers, and crucially they move together: a 50% reduction in either produces roughly the same gain. That is the calculation that supports the next architectural decision.
Three investments, one new distribution
Three investments were modeled head-to-head against the as-is fault tree:
- Preventive-maintenance programme for access tails. Targeted replacement of the oldest 18% of access circuits cuts the access-tail failure rate from 3.20 to 1.80 per year. Cost: $0.9M.
- Second metro ring. Adding a diversely-routed second fibre converts each ring from single-path to 2-of-2 redundant. Cost: $1.6M setup, $0.2M/yr ops.
- Dual-carrier BGP. A second IP transit provider with diverse fibre entry cuts the carrier BGP control-plane rate from 0.18 to 0.05 events/year. Cost: $0.4M setup, $0.3M/yr opex.
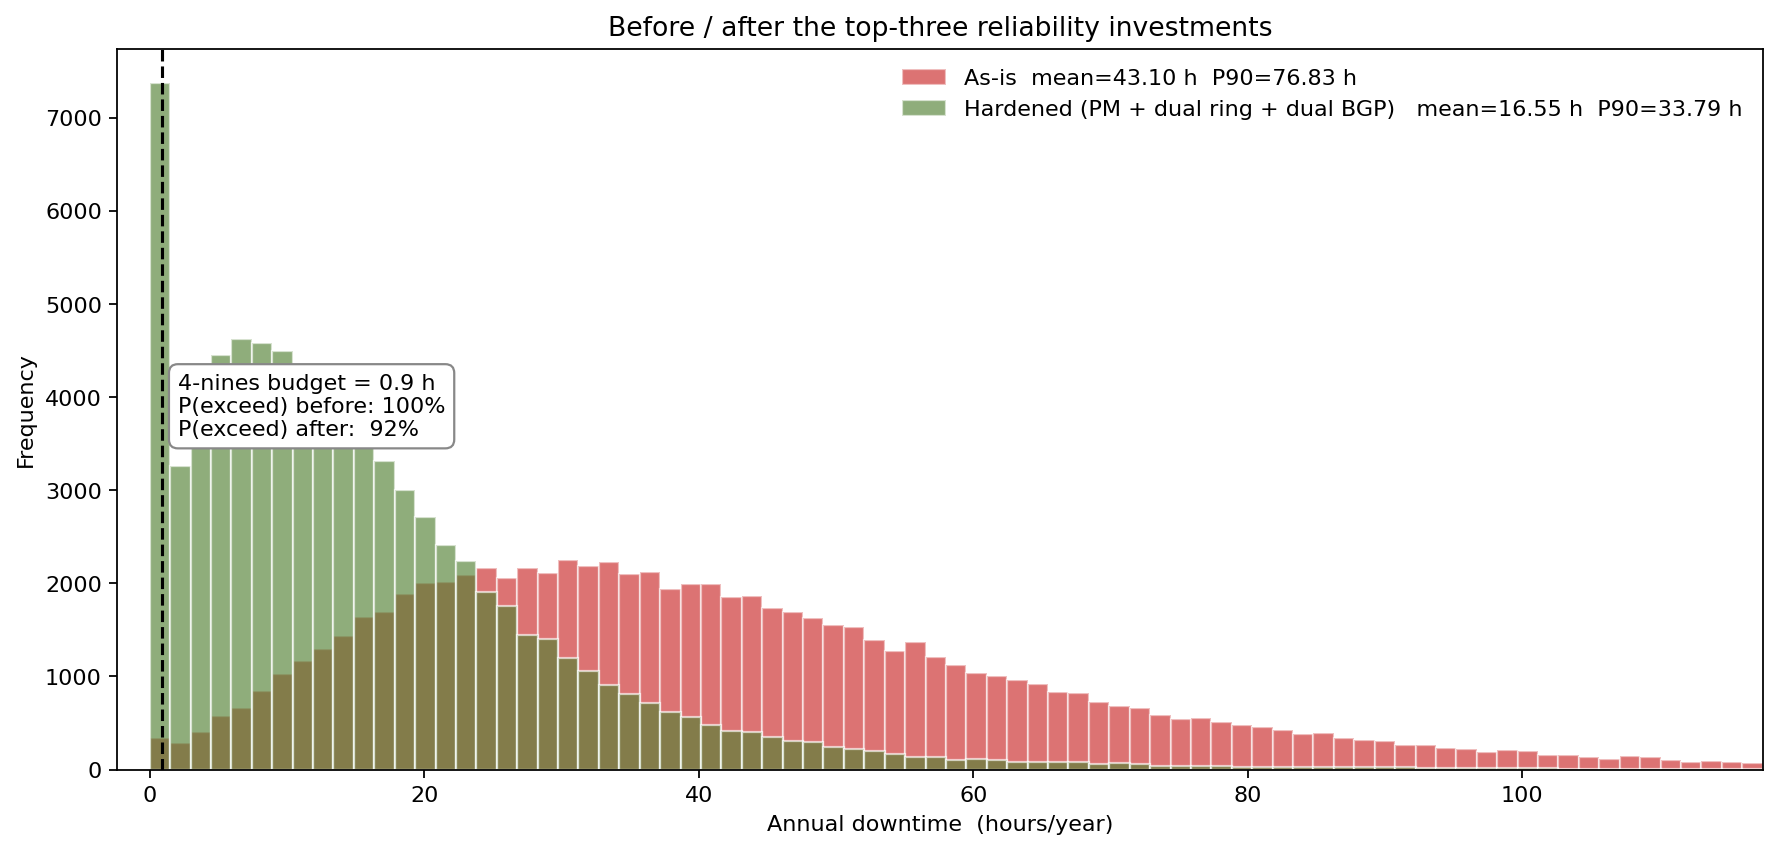
The combined package drops the mean annual downtime from 43.1 to 16.6 hours, the P99 from 130.9 to 76.1 hours, and lifts mean availability from 99.51% to 99.81% — from 2.4 nines to 2.7 nines. The four-nines SLA is still not achievable in the absolute sense, but the SLA-credit exposure (priced at the carrier's standard $4,800 per excess downtime hour to the enterprise base) falls from roughly $13.5M/yr expected to $5.2M/yr expected, with the P95 collapsing in proportion. The $2.9M of investment pays back in expected terms inside two months.
ModelRisk functionality used
- Per-leaf compound-Poisson models stacking
VosePoissonevent counts withVoseLognormal2MTTR draws, summed across the fault tree. - Redundancy as a coincidence probability, computed inside the simulation rather than approximated by
(1 − p)², so repair-window overlap is properly priced. - Common-cause hazards as explicit leaves — fibre cut, power, BGP control-plane — preventing the redundancy-arithmetic trap that flattens correlated failures.
- Pareto of per-leaf contribution to mean downtime, which named the access-tail and metro-ring fibres as the next investment targets.
- Sensitivity ranking on P99 downtime (not mean), aligning the diagnostic with the SLA-penalty quantile.
Reliability is not the product of component MTBFs. It is the joint distribution of how every component fails, how long it takes to repair, and how often a single external event takes several of them out at once. Monte Carlo simulation in ModelRisk is what turns "we are nominally four-nines" into "we are mean two-and-a-half-nines, here are the three components that own the gap, and here is the $2.9M that closes most of it."