

Industry: Telecommunications and IT
Product: ModelRisk
Application: Network Optimization
Picking the routing policy when busy-hour traffic itself is a random variable
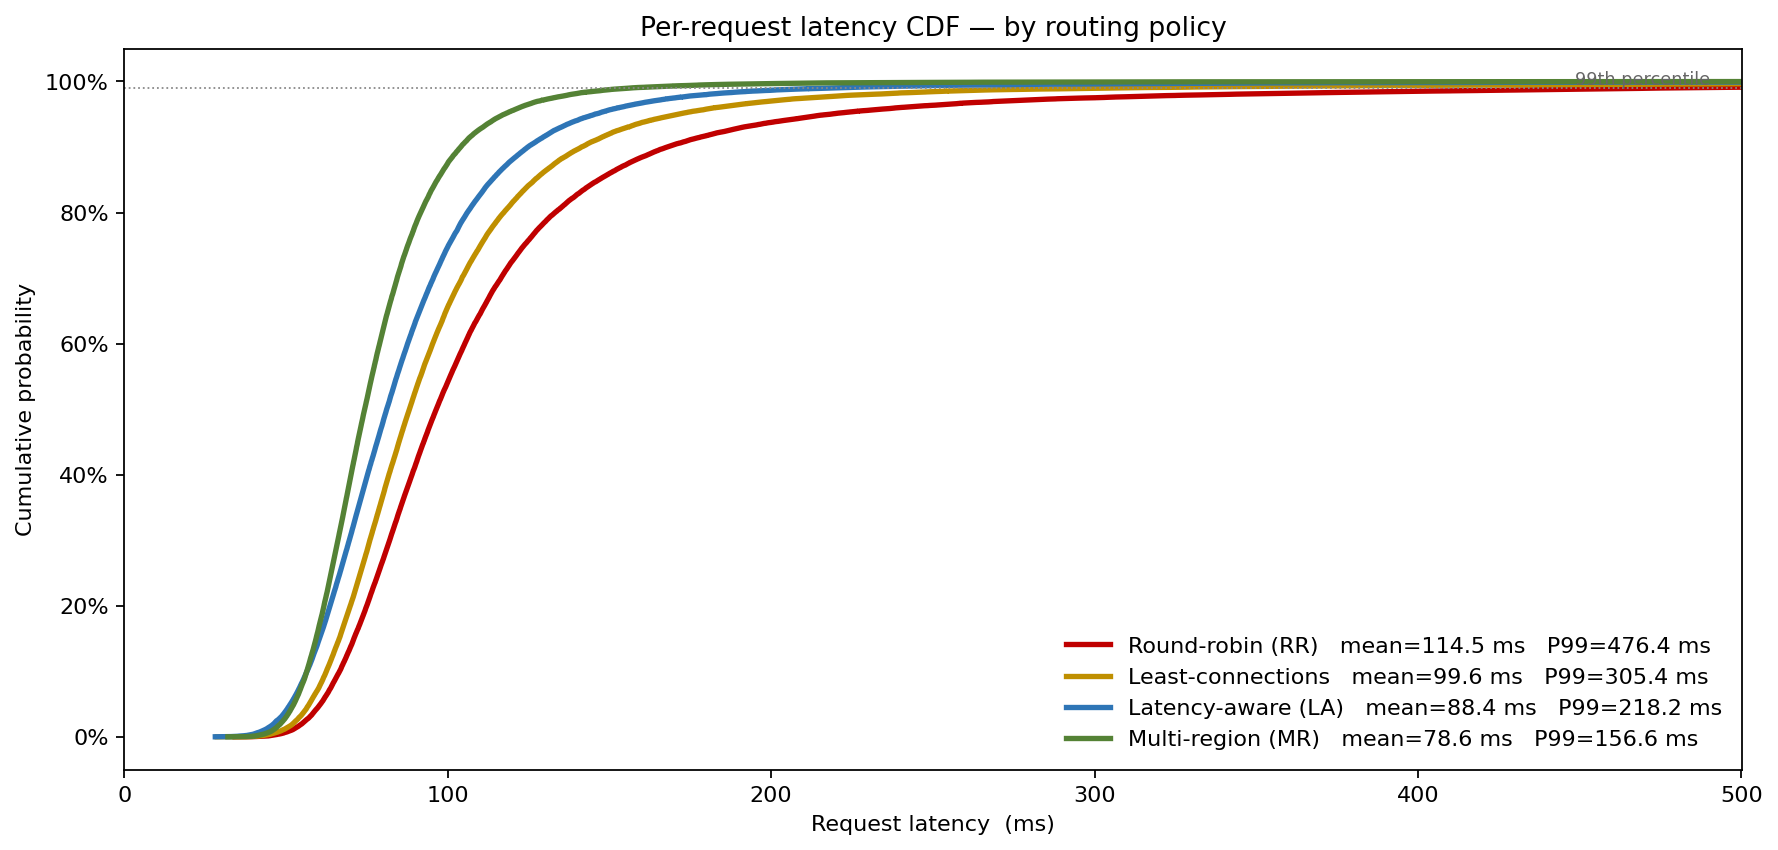
A SaaS platform's load-balancer fleet receives a busy-hour median of 140,000 requests per second, with a measured geometric standard deviation of 1.25 across 90 days of telemetry — meaning a typical busy hour can land anywhere between 105,000 and 195,000 rps before the rare-event tail. Four routing policies were on the table: round-robin, least-connections, latency-aware, and a more invasive multi-region eBGP scheme. The deterministic queuing-theory spreadsheet, plugging in the mean arrival rate against the mean per-server capacity, returned a P99 latency near 100 ms and pronounced all four comfortably inside the 500 ms P99 SLO. The Monte Carlo run, integrating across the full arrival distribution, told a different story at the tail: the as-is round-robin policy ran a P99 latency of 476 ms — right at the SLO edge — and breached the SLO in 0.9% of busy hours, while latency-aware held P99 at 218 ms and multi-region at 157 ms. Picking the right policy was a tail-management decision, not an average-utilisation one.
Arrival rate is the random variable, not the constant
Every queuing-theory textbook starts with ρ = λ / (cμ) and asks the reader to plug in a deterministic λ. In production the arrival rate is the thing most worth modeling stochastically. We fit a LogNormal arrival distribution with median 140,000 rps and σ = 0.22 to 90 days of 1-minute samples taken from the SaaS platform's busy-hour windows. That distribution implies a P99 busy hour of roughly 233,000 rps — 67% above the median — exactly the regime where the queue blows up.
Per-server capacity μ was treated as a constant (9,000 rps for the as-is server class) but the routing policy was modeled as a multiplier on effective fleet capacity:
- Round-robin (RR) — no uplift. Hot-shard collisions and uneven session affinity waste roughly 15% of theoretical capacity in practice.
- Least-connections (LC) — +8% effective capacity. Cheap to deploy on the existing load balancers.
- Latency-aware (LA) — +18% effective capacity, but +22% tail jitter because adaptive routing reacts late.
- Multi-region eBGP (MR) — +30% effective capacity, with narrower jitter because traffic shedding decouples regional contention.
Per-request latency was then composed as 42 ms / (1 − ρ_eff) × LogNormal(0, jitter) with ρ_eff capped at 0.92, plus a per-excess-utilisation overflow penalty when ρ > 1 — the structure that captures both ordinary queueing inflation and the catastrophic regime where requests simply time out.
What the average-rate plan hid
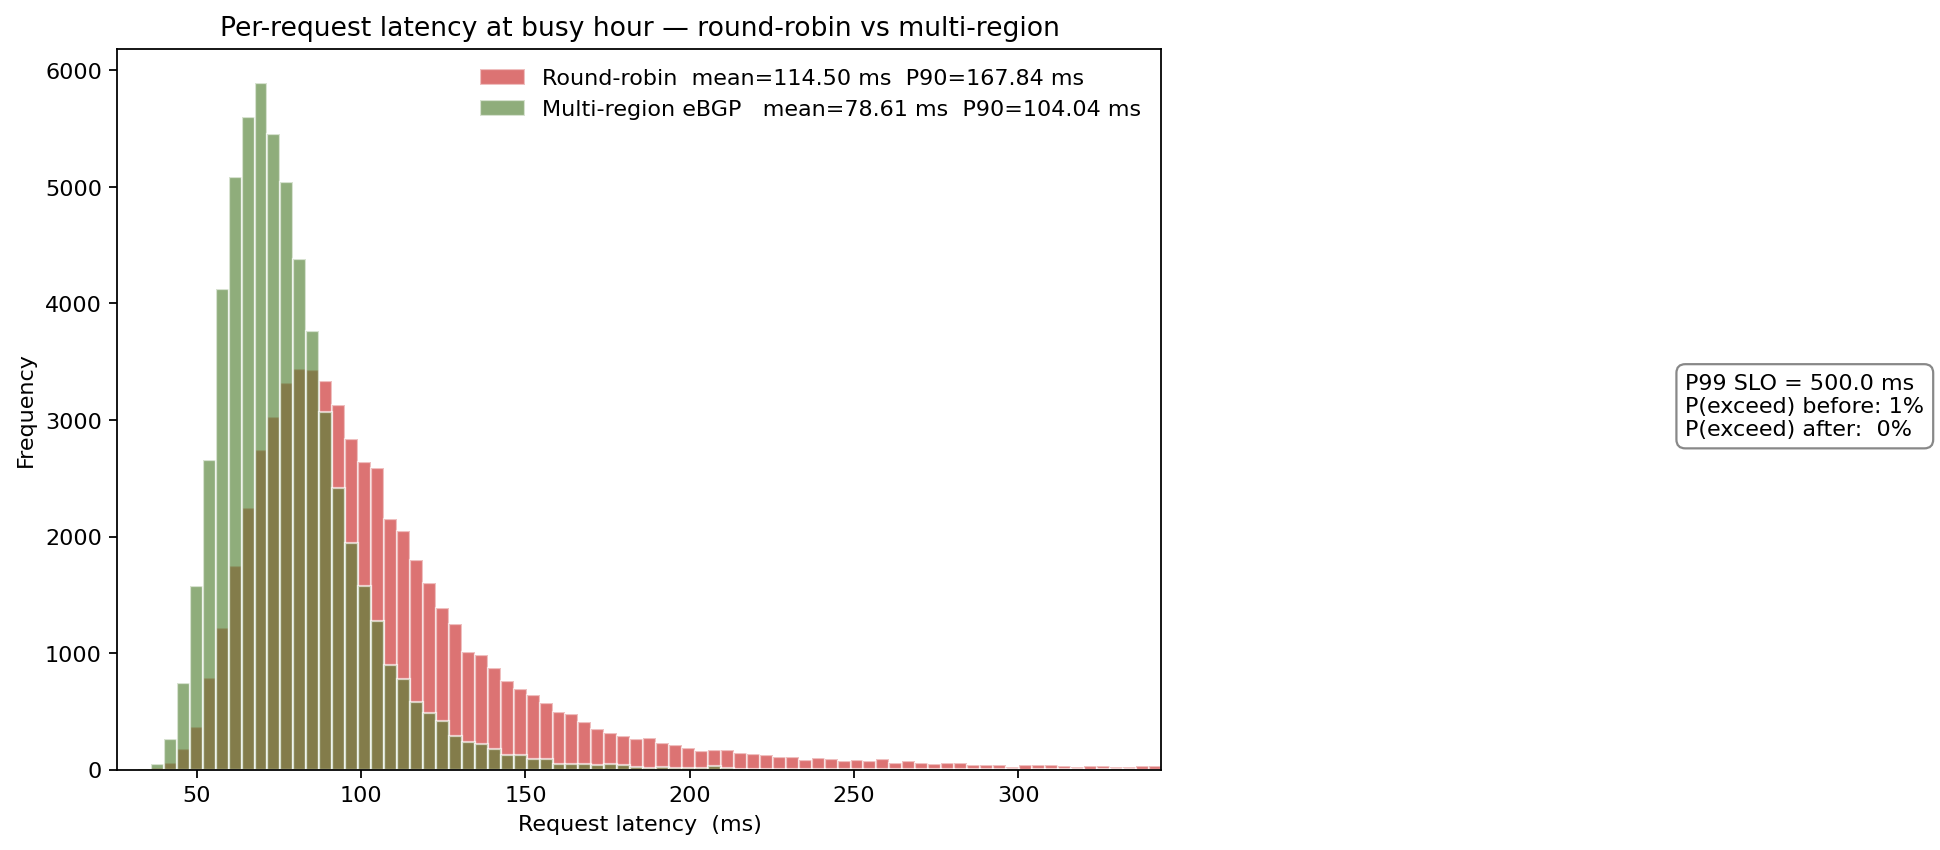
The deterministic plan used the mean arrival rate of about 143,000 rps. At that load, ρ = 0.57 for round-robin and the queue formula returns a latency of roughly 100 ms — well inside the 500 ms SLO. The simulation, integrating across the full LogNormal arrival distribution, returned a round-robin P99 of 476 ms — sitting right on the SLO edge — and a breach probability of 0.9%. The median latency (96 ms) is fine; the tail brushes the limit. A deterministic answer that hands back one number for one arrival rate hides exactly the regime where the SLO matters: the worst 1% of busy hours where round-robin runs out of headroom and the better policies still have room to spare.
Four CDFs, one decision
The four-policy CDF at the top of this article makes the trade-off direct. The least-connections policy gives most of round-robin's gains for nearly free — pulling P99 from 476 ms down to 305 ms — but it is the latency-aware (P99 218 ms) and multi-region (P99 157 ms) policies that put real distance between the fleet and the 500 ms SLO. Beyond P99 — the very busy hours that drive the quarterly outage post-mortem — multi-region pulls clearly ahead because its lower jitter compounds with its higher effective capacity.
What actually drives the P99
Sensitivity ranking under the as-is round-robin policy tells the team which variable to attack first.
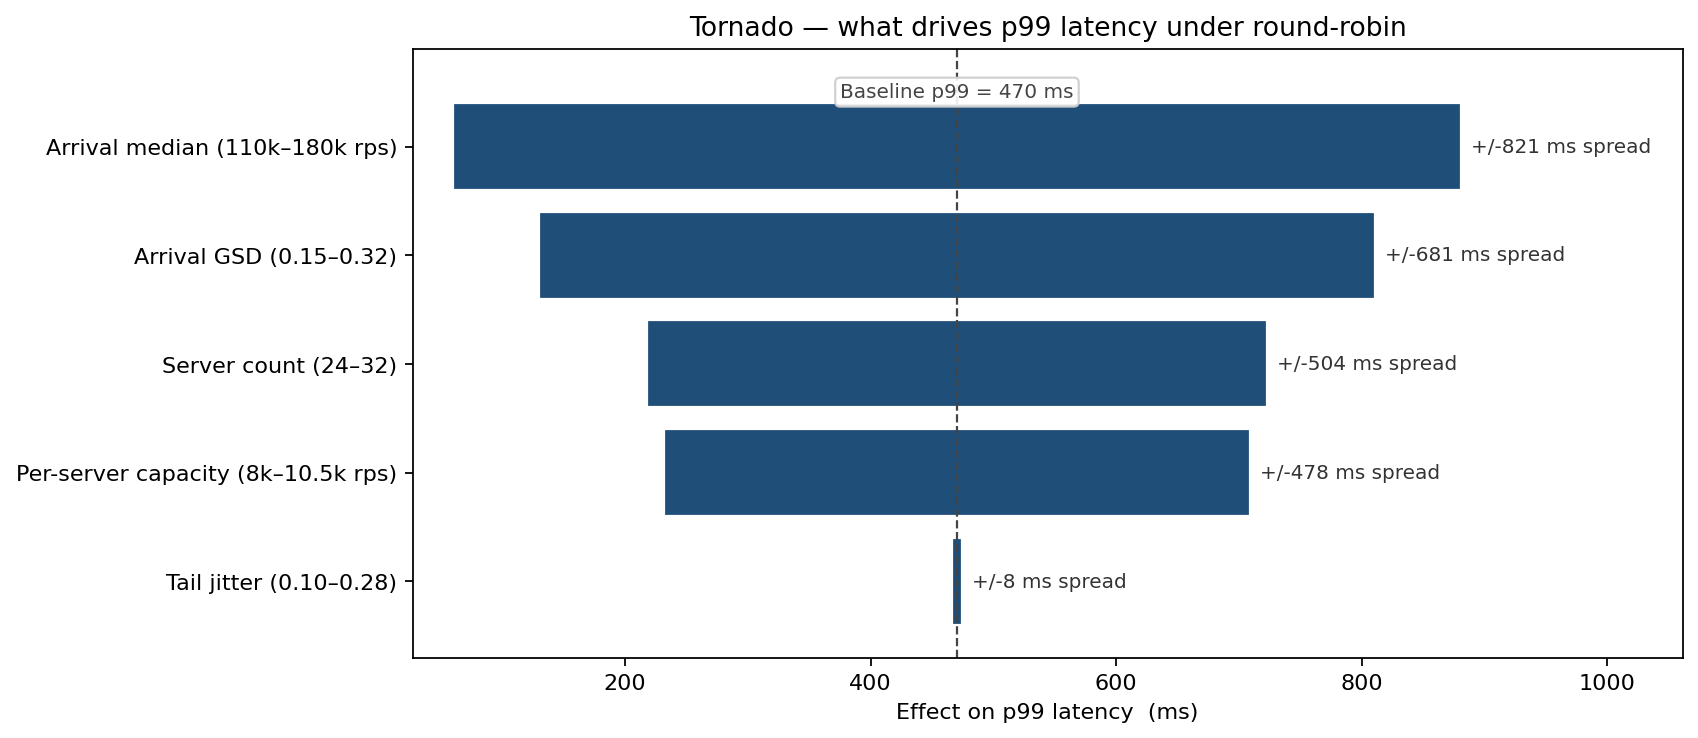
Arrival rate dominates — both its median (the largest bar, ~820 ms of P99 swing across the 110k–180k rps range) and its spread/GSD (~680 ms across the 0.15–0.32 range). The fleet's P99 latency depends far more on the traffic it receives than on how the fleet is provisioned: server count (~500 ms) and per-server capacity (~480 ms) trail both arrival drivers. That ranking says smoothing investments — rate limiting upstream of the load balancer, queue-pause-and-retry handshakes with the largest customers — are worth as much as, or more than, the equivalent dollars spent on server count. Tail jitter is a negligible mover (~8 ms): the platform is queue-bound on arrivals, not jitter-bound.
Cost-quality frontier
Cost was modeled as amortised CapEx (over three years) plus annual OpEx plus SLA-credit cost driven by simulated breach probability. Plotting each policy as a single (breach %, $M/yr) point makes the dominated options obvious.
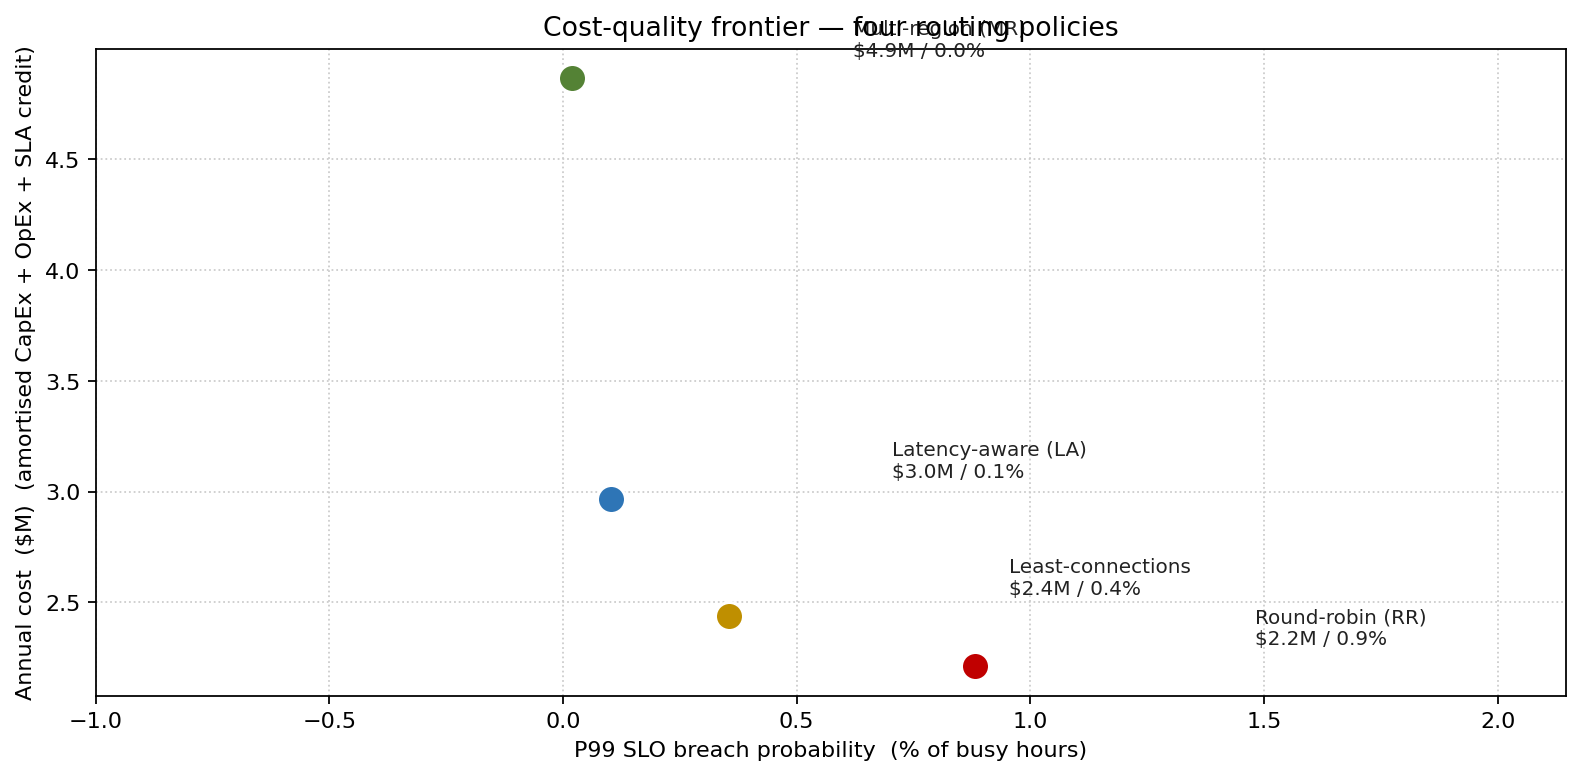
- Round-robin — $2.2M/yr, 0.9% breach. Cheapest, but its P99 sits on the SLO edge.
- Least-connections — $2.4M/yr, 0.4% breach. For one config push it roughly halves the breach probability.
- Latency-aware — $3.0M/yr, 0.1% breach. Lower breach, modestly higher cost.
- Multi-region — $4.9M/yr, 0.02% breach. The lowest-breach option and by far the most expensive.
Reading the chart: least-connections strictly dominates round-robin on the curve and should be deployed immediately — it lowers breach probability at near-zero marginal cost. Beyond that, the LA-versus-MR choice is a genuine trade, not a free lunch: multi-region buys the smallest absolute breach reduction (from 0.1% to 0.02%) at the steepest cost step (an extra $1.9M/yr over LA). At today's modelled SLA-credit exposure — which the simulation puts at under $0.01M/yr even for round-robin — that breach reduction does not pay for itself on credits alone; MR is justified only if the platform values the brand and contractual cost of a rare outage well above its direct SLA credits.
What changed
- Least-connections rolled out across the fleet within the same quarter — the simulation showed it as strictly Pareto-improving over round-robin at the cost of a single config push.
- Multi-region eBGP funded for the following year, sized off the P99 latency distribution rather than the mean.
- Arrival smoothing programme initiated — token-bucket rate limits negotiated with the three customers contributing most to busy-hour arrival volume and GSD. The tornado said attacking arrival rate would buy at least as much P99 reduction as another 20% of fleet.
ModelRisk functionality used
- LogNormal arrival-rate fit (
VoseLognormalFit) on 90 days of busy-hour telemetry so the simulation matches measured variance, not assumed variance. - Policy-as-multiplier model, letting four candidate routing policies share one queueing skeleton and differ only in effective-capacity uplift and jitter — a clean way to compare without rebuilding the model four times.
- Overflow penalty for ρ > 1 to capture the catastrophic regime; ordinary M/M/c formulas misbehave in exactly this region.
- Sensitivity ranking on P99 latency rather than mean latency, so the diagnostic matches the SLO the platform is measured on.
- Cost-quality scatter of (breach %, $M/yr) for each policy, making the dominated options visually obvious to the steering committee.
Network optimisation is not picking the policy that minimises mean latency; it is picking the policy whose distribution of latencies sits inside the SLO at the quantile the business cares about. Monte Carlo simulation in ModelRisk is what turns "all four policies meet the SLO on average" into "round-robin's P99 sits right on the 500 ms line and tips over it one busy hour in a hundred — and here is exactly how much tail headroom each upgrade buys."