

Industry: Telecommunications and IT
Product: ModelRisk
Application: IT System Upgrades
A $14M ERP cut-over that runs $16.5M before the rollback risk is priced
The Standish Group's CHAOS database has been saying the same thing for thirty years: large enterprise IT upgrades run 40–100% over their original cost baseline and slip by a comparable margin on schedule. A deterministic plan that hands back "$14M, eighteen months" is not so much wrong as silent — it cannot say whether the team is looking at a $16M outcome with a 10% chance of $23M, or a $23M outcome with a 10% chance of $32M. Those are wildly different conversations to have with the board.
A mid-size enterprise rebuilding its on-premise ERP onto a cloud platform priced the programme in Vose Software's ModelRisk before committing the contract. The deterministic baseline said $14.0M, 18 months. The Monte Carlo run produced a mean cost of $16.5M, a P90 of $22.8M, and a P99 of $31.8M, with a 66% probability of breaching the $14M budget — numbers large enough to reframe the migration-strategy decision before any code was written.
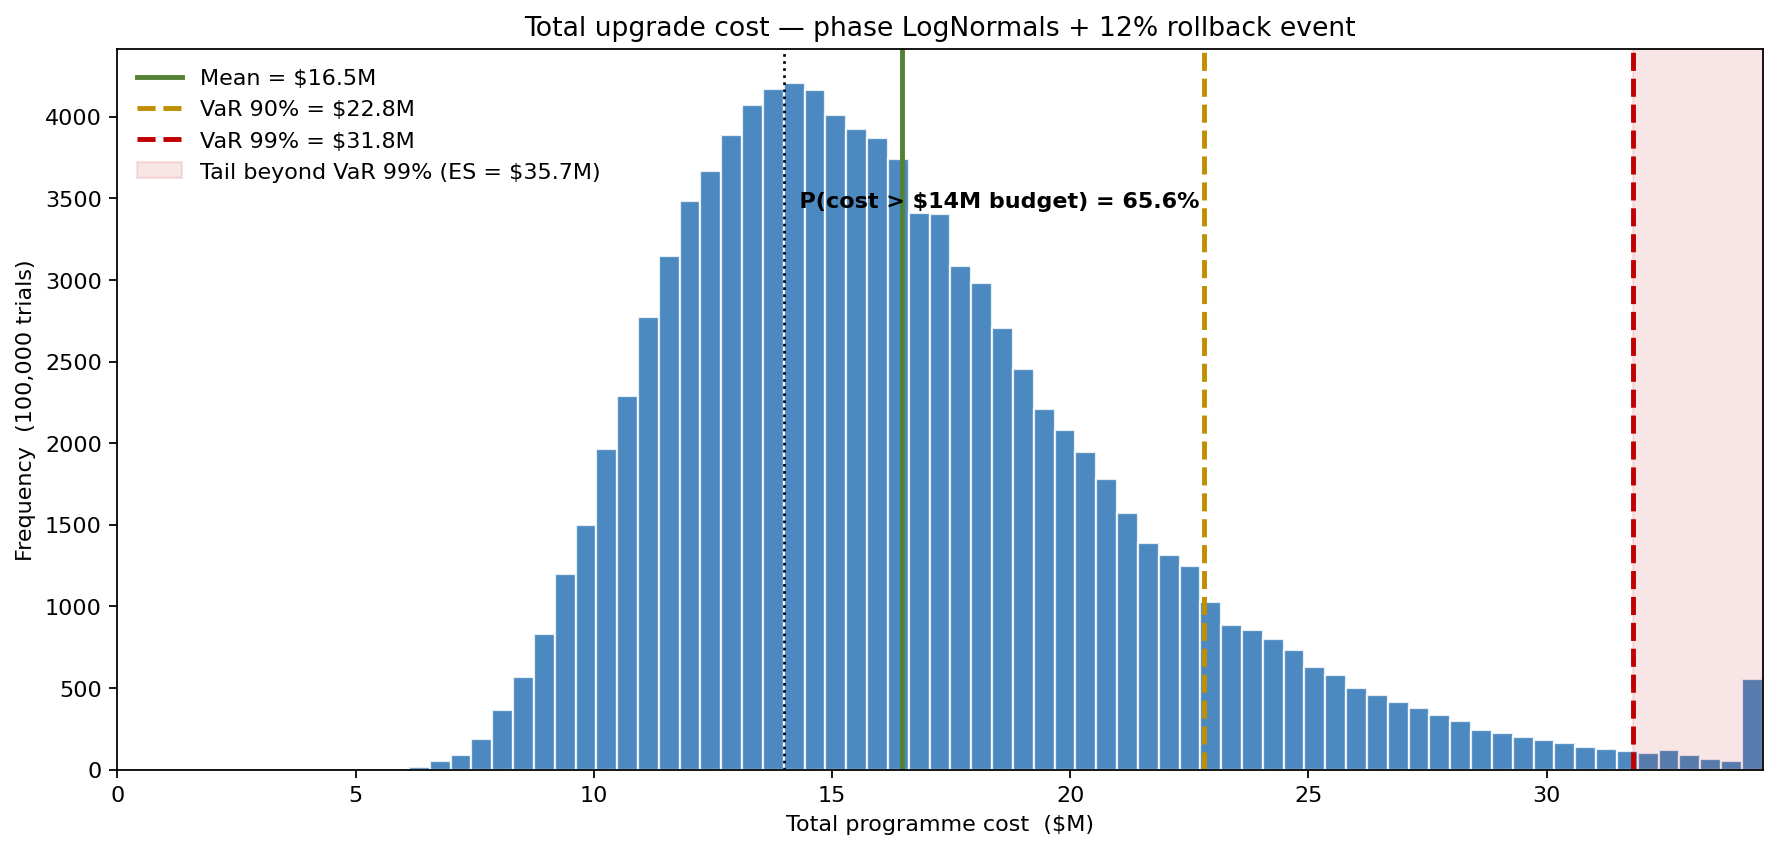
The deterministic plan returns a single point near the optimistic edge of that distribution. The simulation returns the whole shape — the long right tail driven by the phases that go wrong, the budget-breach probability, and the strategy choice that controls the tail.
Phase LogNormals, not phase point estimates
The programme decomposes into six phases — discovery and design, data migration, application refactor and integration, testing and UAT, cut-over and hypercare, and decommissioning. Each phase is modeled as LogNormal in dollars, parameterised by its median and a geometric standard deviation:
- Discovery & design — median $1.3M, GSD 1.30. Narrow, because the scope is known.
- Data migration — median $3.4M, GSD 1.85. The widest of the six, because what is in the legacy database is what bites.
- App refactor & integration — median $4.6M, GSD 1.70. The largest single phase; integration points to seven downstream systems each carry their own LogNormal.
- Testing & UAT — median $1.8M, GSD 1.55.
- Cut-over & hypercare — median $2.1M, GSD 1.95. Heavy tail because the things that break in the first 30 days post-go-live are the things nobody tested.
- Decommissioning — median $0.6M, GSD 1.40.
LogNormal is the right shape because IT phases have a floor (you cannot deliver in negative weeks for negative dollars) and a long upper tail driven by discoveries-during-execution — a pattern Normal cannot represent. The sum of LogNormal phase costs is not LogNormal, but the simulation does not care: ModelRisk convolves them numerically.
On top of the six phases sits a rollback event: a 12% probability that cut-over fails badly enough to require either a full rollback or a parallel re-run, costing an additional LogNormal(median $3.5M, GSD 1.6). This is a Bernoulli flag multiplying a severity distribution — exactly the structure a Normal cost-contingency line item flattens out of existence.
What the deterministic plan literally cannot show
The deterministic plan sums medians: $1.3 + $3.4 + $4.6 + $1.8 + $2.1 + $0.6 = $13.8M, rounded to $14M, with rollback risk handled as a "10% contingency" line. The Monte Carlo says the mean is $16.5M because every LogNormal phase has a mean that exceeds its median by 15–40% (mean = median × exp(σ²/2)) and the rollback event adds its own expected cost. The P90 is $22.8M and the P99 is $31.8M. Both numbers are inside the range Standish predicts and outside anything the spreadsheet could surface. 66% of simulated runs breach the $14M budget; 20% breach $20M.
What actually moves the cost
Sensitivity on the mean programme cost shows the team where to invest the next dollar of de-risking.
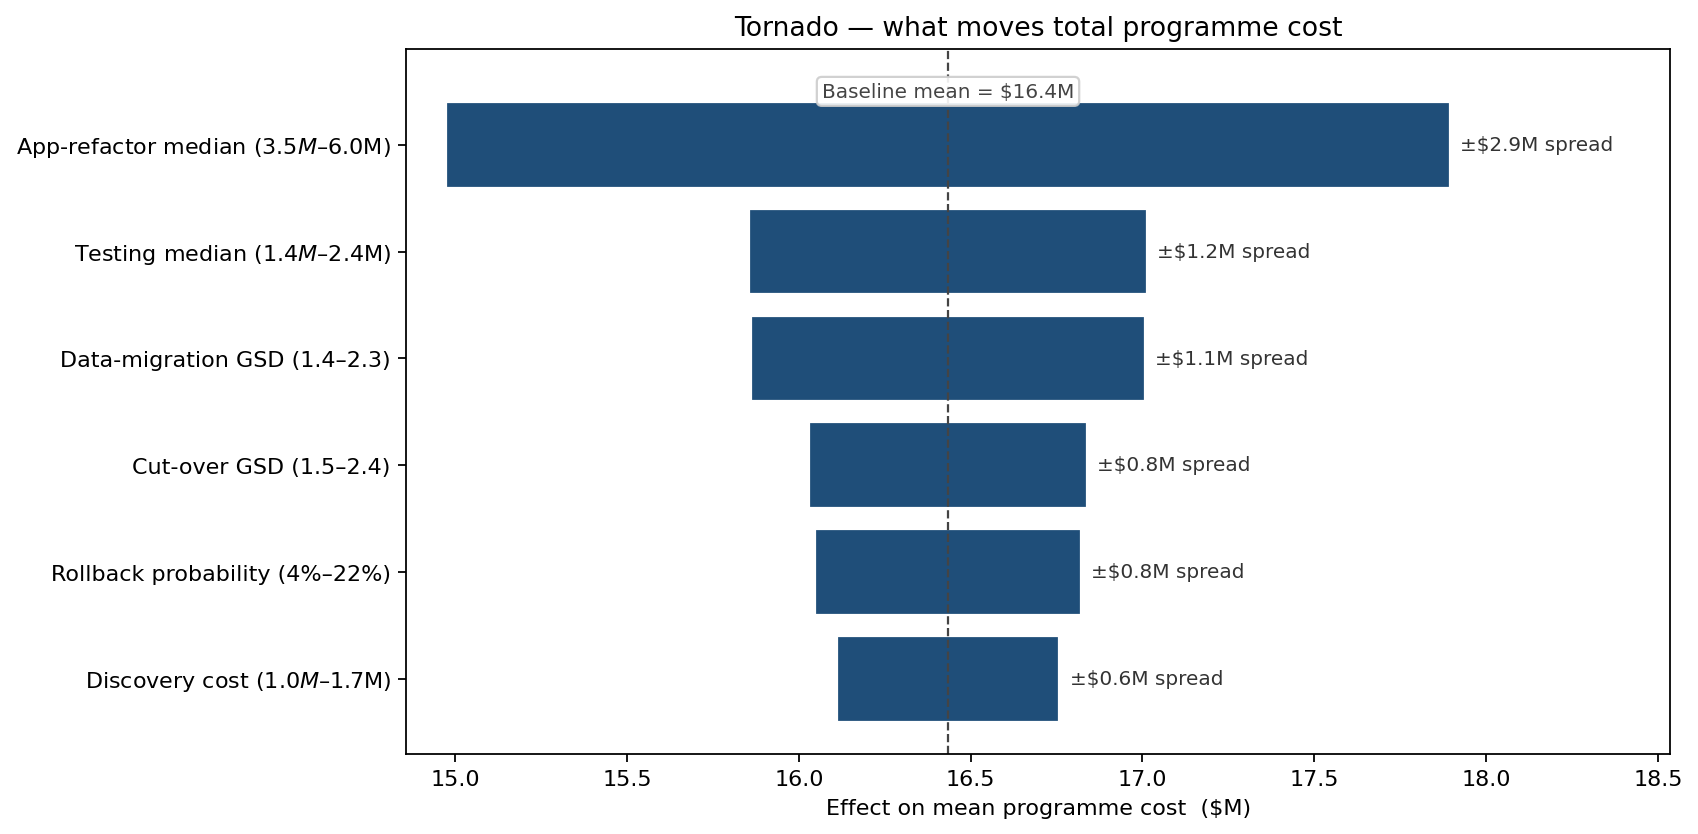
The application-refactor median dominates — its $3.5M-to-$6.0M range moves the mean programme cost by almost $3M, more than any other input. Testing median and data-migration GSD come next. Rollback probability ranks lower in raw dollar spread, but unlike the phase medians it is the variable the migration-strategy decision actually controls: reducing it from 12% to 5% (the realistic figure for a phased migration with backout tested at each stage) is a lever the team can pull, where the phase medians are largely fixed by scope.
Big-bang, phased, or strangler
Three migration strategies were modeled with the same phase structure but different rollback profiles and base-cost multipliers:
- Big-bang cut-over — the as-is model. Mean cost $16.5M, P90 $22.8M, P(breach $14M) 66%.
- Phased migration — six waves over 22 months, 15% higher base cost from running parallel platforms, but rollback probability drops from 12% to 5% and per-phase GSDs tighten by 30%. Mean cost $17.4M, P90 $22.2M — slightly higher mean than big-bang, but the tightest P90 of the three.
- Strangler-fig refactor — incremental swap behind an API facade over 28 months. 35% higher base cost, rollback probability collapses to 2%, GSDs tighten further. Mean cost $19.7M, P90 $24.1M — the rollback and GSD gains are real, but the parallel-running base-cost premium swamps them: the safest cut-over is also the most expensive programme.
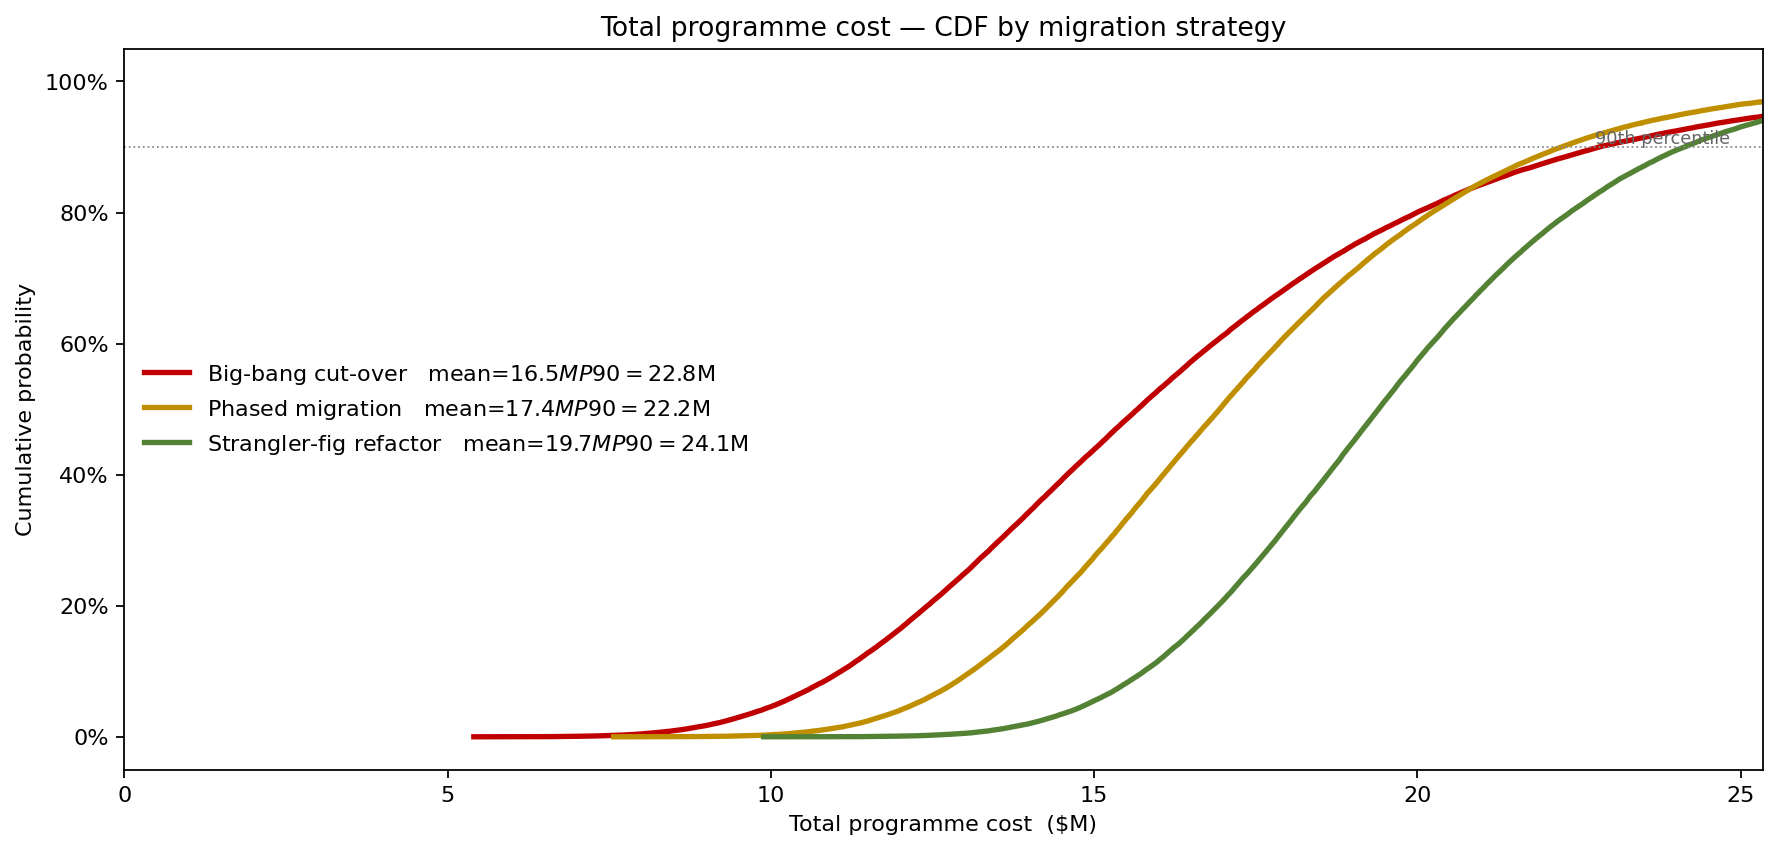
This is the trade-off the deterministic comparison hides. Big-bang is cheapest on the mean but carries the fattest tail. Phased shaves about $0.6M off the P90 for roughly $0.9M of extra expected cost — buying tail protection without the full strangler premium. Strangler buys the lowest rollback risk but pays for it with the highest mean and the widest P90 once the parallel-running cost is counted. Ranking the three by mean alone — as a single-point comparison would — would have picked big-bang and missed that its tail is the one the board was told to avoid.
The schedule has the same shape
The schedule was modeled with the same six-phase LogNormal structure in months. Sum of phase modes gives 17.9 months — comfortably inside the 18-month plan. The simulation says the mean duration is 19.6 months, the P90 is 24.5 months, and the plan is late in 63% of runs.
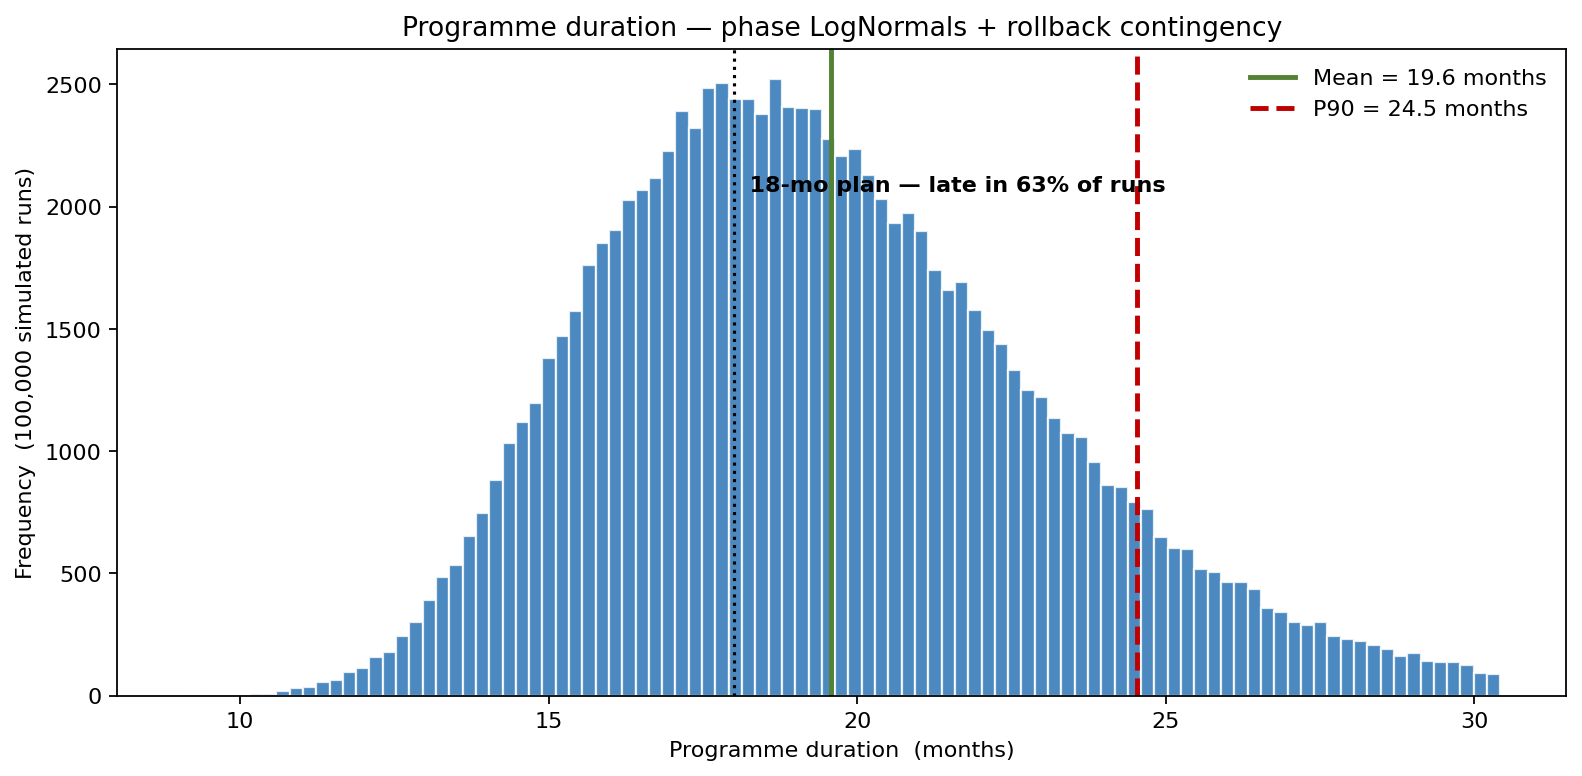
The cost and schedule distributions are not independent — the cut-over phase that overruns its dollars usually overruns its weeks too — and ModelRisk lets the team layer a copula between the two if the steering committee wants to see the joint distribution. For the cost-and-schedule headline, the marginal view was sufficient to settle the strategy.
What changed before the contract was signed
- Budget reset to $17M with a $23M not-to-exceed, matching the simulated mean and P90 rather than the deterministic median.
- Migration strategy switched to phased, accepting a ~$0.9M higher mean to take the P90 to the tightest of the three options without paying the full strangler-fig parallel-running premium.
- Rollback drill added to every phase gate, targeting the 12%-to-5% rollback-probability move that the tornado ranked third-most-impactful.
- Schedule contingency budgeted at 5 months (the P90-to-mean gap, ~24.5 vs 19.6) rather than the original 2-month buffer.
ModelRisk functionality used
- LogNormal phase costs and durations parameterised by median and GSD (
VoseLognormal2), so finance-controller intuition about "the typical case and how wide it can get" maps directly onto distribution parameters. - Bernoulli × LogNormal rollback compound for the discrete-then-continuous structure of a failed cut-over.
- Migration-strategy comparison via overlaid cost CDFs, so the trade-off between mean and P90 was a single chart rather than a table of point estimates.
- Sensitivity ranking on the mean cost to identify rollback-probability as a high-leverage variable that strategy choice can actually move.
- Joint-distribution copula option between cost and duration, available when the steering committee needed to see whether the two tails collided.
The CHAOS database does not say IT upgrades are bad investments. It says deterministic IT-upgrade plans are bad forecasts. Monte Carlo simulation in ModelRisk is what lets the team price the migration decision against the distribution it will actually live inside — and pick the strategy whose tail it can afford.