

Industry: Telecommunications and IT
Product: ModelRisk
Application: IT System Performance Analysis
End-to-end response-time risk for a 12-million-subscriber billing stack
A Tier-1 carrier's billing and self-service stack serves 12 million subscribers; a single second added to median response time during peak hour translates to roughly a 0.4-point drop in NPS and an extra 18,000 calls into the contact centre. The internal SLO is P95 end-to-end response time ≤ 2,000 ms during the busy hour. The deterministic capacity-planning spreadsheet — sum of mean server, network and database times — said ~870 ms and declared a 2× headroom. The Monte Carlo model said the request-level P95 sits right on the 2,000 ms line, and that the busy-hour P95 actually crosses it in 41% of busy hours.
This is the gap that motivated the team to rebuild the performance model in Vose Software's ModelRisk.
Where the latency budget actually lives
End-to-end request latency is a sum of four right-skewed components, each with its own driver:
- Application tier (T_app): lognormal, median 180 ms, geometric standard deviation 1.7. GC pauses and JIT warm-up create the long tail.
- Database tier (T_db): lognormal, median 268 ms, GSD 2.38. Query-plan regressions during peak read-load fatten the right tail.
- Network round-trip (T_net): Gamma, shape 4, scale 18 ms — a tighter, more symmetric distribution.
- Third-party auth/payment callout (T_ext): mixture: ~89% chance lognormal(median 90 ms, GSD 1.5); ~11% chance the partner is throttled and the call follows lognormal(median 930 ms, GSD 1.8).
End-to-end latency is T_total = T_app + T_db + T_net + T_ext. Summing four skewed distributions is not addition of medians — the mean of a lognormal with median 180 ms and GSD 1.7 is 207 ms, not 180 ms, and the convolution stretches further than any closed-form approximation suggests.
Why a point estimate hides the SLO breach
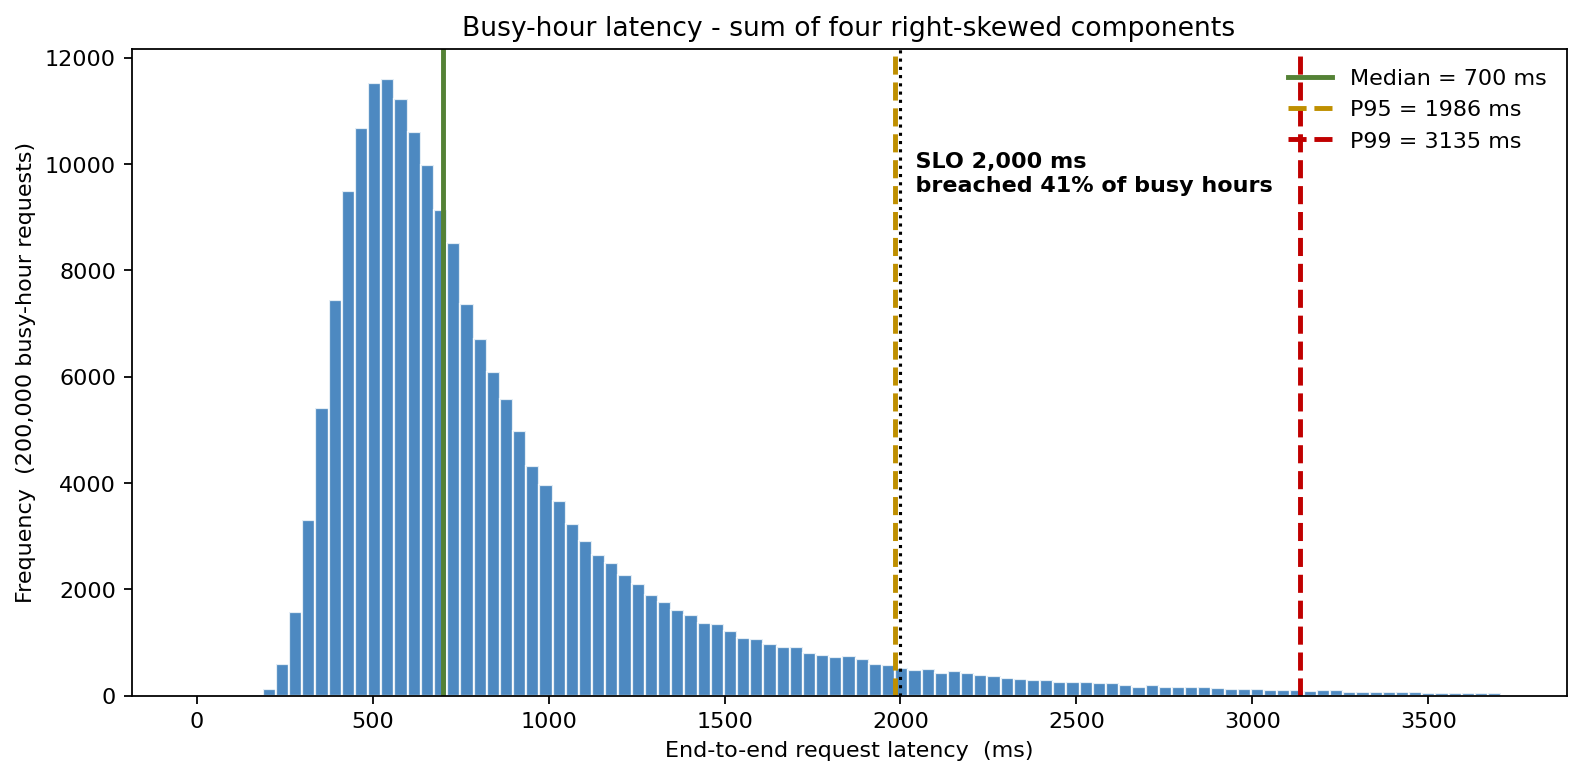
The deterministic plan added mean component times — roughly 207 + 391 + 72 + 204 = 874 ms — and concluded the SLO had better than 2× headroom. The Monte Carlo run over 200,000 busy-hour requests reported a median of 700 ms, a request-level P95 of 1,986 ms, and a P99 of 3,135 ms. The request P95 sits right on the 2,000 ms SLO — which means the busy-hour P95, the figure the SLO is actually measured on, crosses the line in 41% of busy hours. Looking only at the median would have shipped a system that fails its contract two busy hours in five.
What actually moves P95
ModelRisk's contribution-to-variance ranking told the team which lever to pull first.
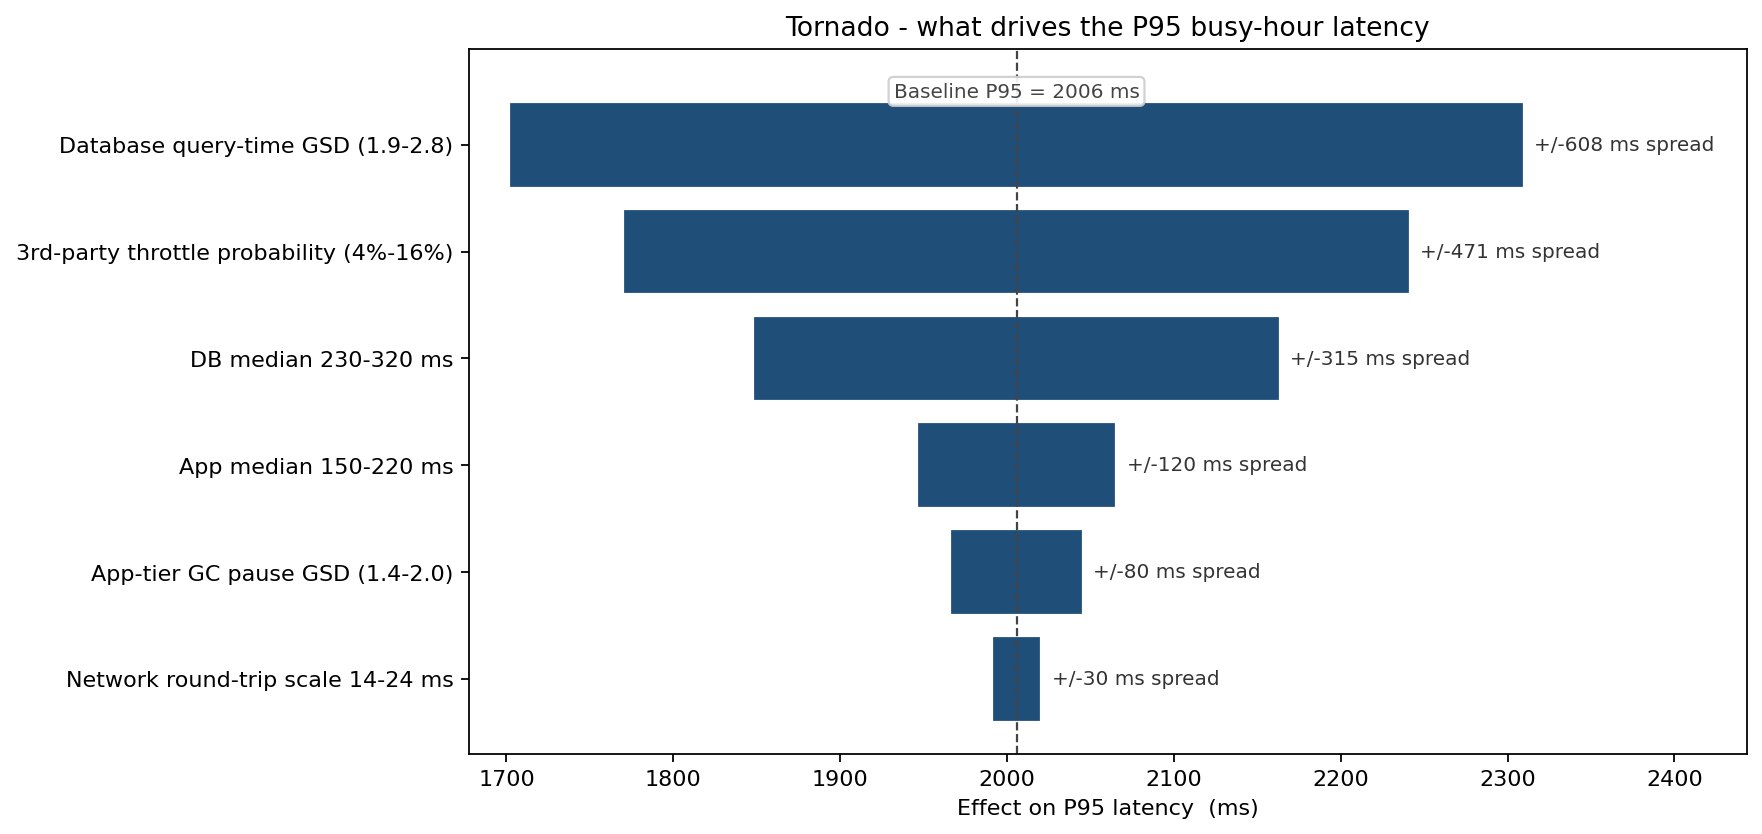
Database query-time variance dominates: cutting the database GSD from 2.38 to 1.6 (the figure achievable with a query-plan-stabilisation patch already on the backlog) was projected to drop P95 by roughly 430 ms — more than any horizontal scale-out of the application tier would deliver.
Three remediation paths, one cost-quality frontier
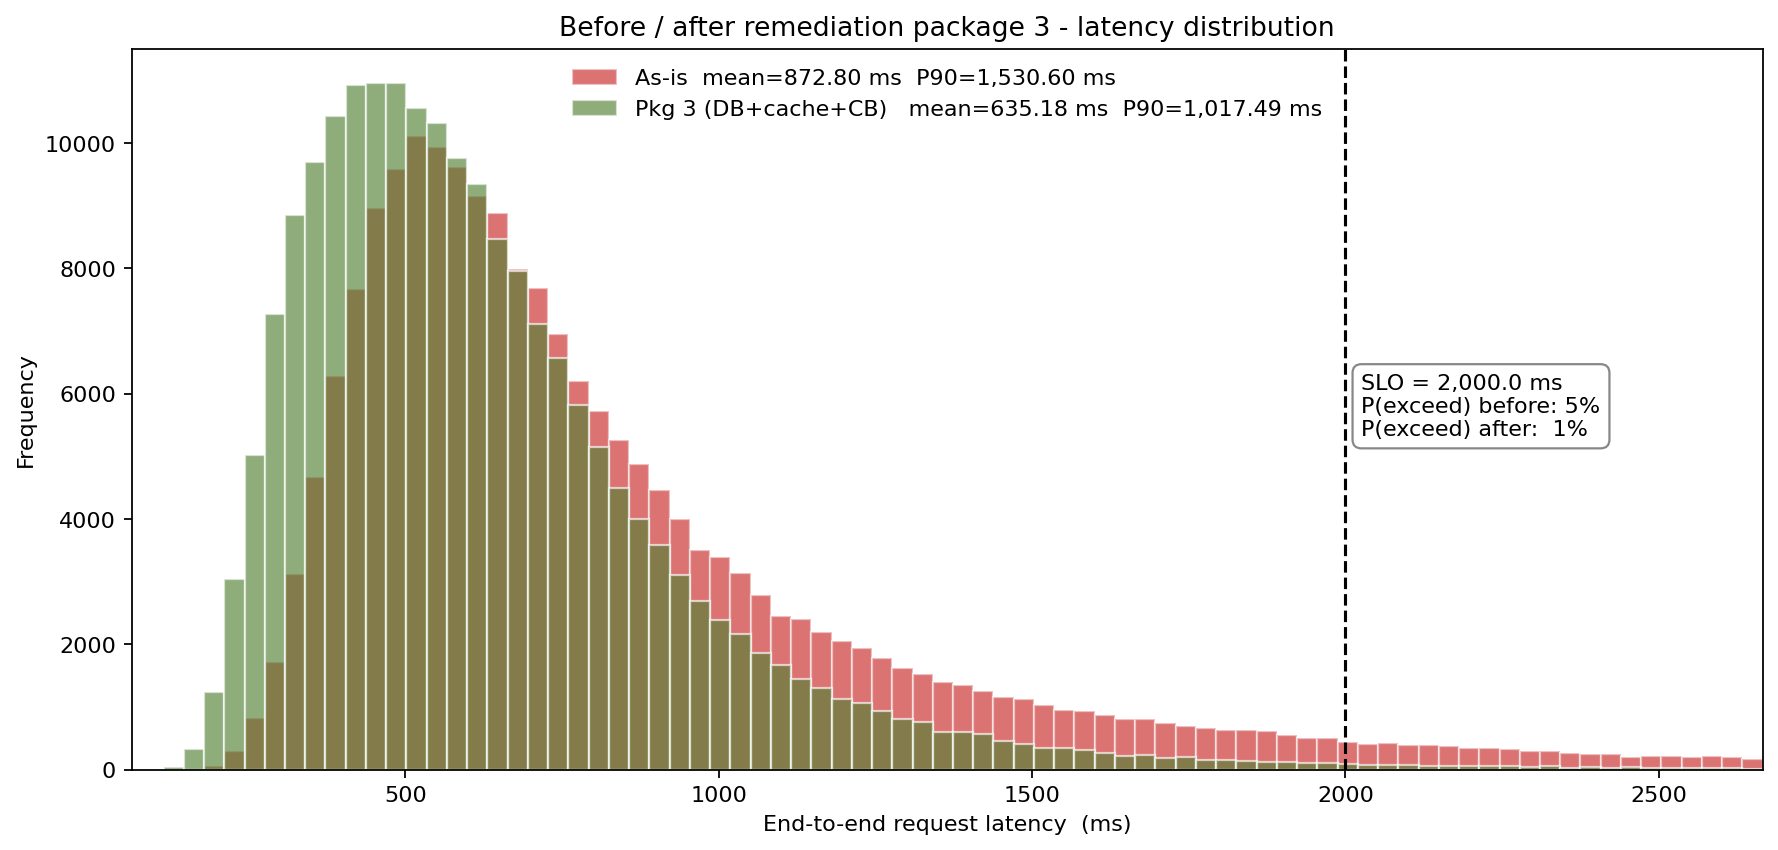
The team simulated three remediation packages against the as-is baseline:
- DB stabilisation only — query-plan pinning + read-replica routing (GSD 2.38 → 2.0). Cost: $0.9M one-off. P95 drops to 1,750 ms; busy-hour SLO-breach probability drops from 41% to ~2%.
- Add caching tier — Redis layer for the 30% of requests that are reads-of-recent-writes. Cost: $1.4M + $0.3M/yr ops. P95 drops to 1,650 ms; SLO-breach probability drops to under 1%.
- DB stabilisation + caching + auth-callout circuit breaker (throttle 10.5% → 2%). Cost: $1.9M + $0.4M/yr. P95 drops to 1,220 ms; SLO-breach probability is effectively zero.
Tying latency back to revenue
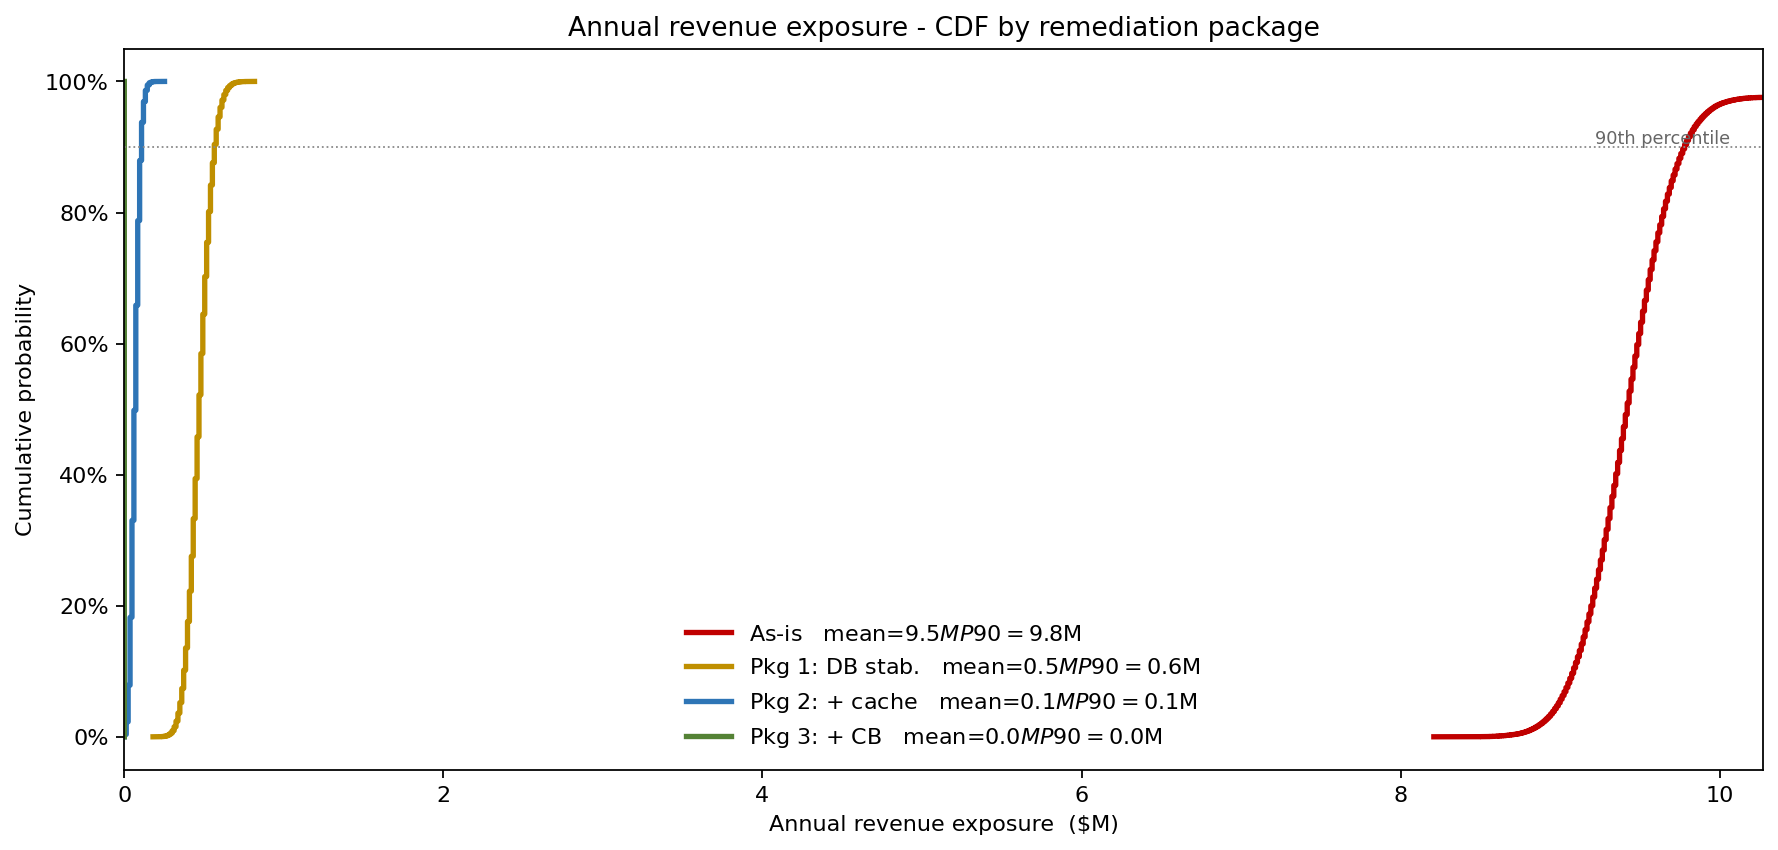
Lost contribution margin from contact-centre overflow and churn was modelled per busy-hour: each of the ~480 monitored busy-hours per quarter whose P95 breaches the 2,000 ms SLO drives ~$0.012M of overflow cost, and any year that contains a severe busy-hour (P95 ≥ 2,600 ms) takes a $4.2M churn annuity. Running this through the simulation produced an expected annual revenue exposure of $9.5M for the as-is system, $0.5M with package 1, $0.1M with package 2, and effectively $0 with package 3 — making the $1.9M capex on package 3 well under a one-year payback in expected terms.
ModelRisk functionality used
- Lognormal and gamma convolutions with
VoseLognormal2andVoseGammato compose the four-component end-to-end latency. - Mixture distribution for the third-party callout (~89% normal-mode / ~11% throttled-mode) using
VoseDiscreteto switch between two lognormal regimes. - Variance contribution ranking (rank correlation) to identify the database tier as the dominant P95 driver and rule out application-tier scale-out as the cheapest fix.
- Scenario comparison via overlaid CDFs to read off SLO-breach probability for each remediation package directly from the simulation output.
- Probability-weighted financial exposure linking each breached busy-hour to a per-hour overflow cost plus a churn annuity, so the latency distribution converts directly into an annual revenue-exposure figure.
A point-estimate model would have shipped a system that meets its mean-response SLO and breaches its P95 SLO 41% of busy hours; the Monte Carlo model told the team exactly which $1.9M of work would close that gap.