

Industry: Telecommunications and IT
Product: ModelRisk
Application: Optimizing IT Infrastructure Investment Under Uncertainty
18-25% of Revenue: Sizing CapEx Risk When Demand Forecasts Are Distributions, Not Numbers
Telecom and large IT-services operators invest 18-25% of revenue in CapEx every year — fibre rollouts, data-centre additions, RAN upgrades, edge nodes, transport refreshes. For a $9B-revenue carrier that is $1.6-$2.3B of capital deployed annually against demand forecasts whose realised growth rate has historically missed the planning number by ±40%. A deterministic NPV calculation on a single-point demand forecast hands back a single-point number; the real question is the distribution of NPV given the realised demand and adoption curves, and which of three competing build strategies is least exposed when those curves disappoint.
A multinational carrier rebuilt its 7-year infrastructure-investment model in ModelRisk for the next 5G + edge-compute capex cycle. The deterministic plan reported NPV +$340M. The simulation: mean NPV +$260M, P10 = -$13M, P90 = +$543M, P(NPV < 0) = 11%. The single +$340M figure sat near the optimistic end of a distribution that crosses zero roughly one run in nine — a fact the deterministic NPV could not see.
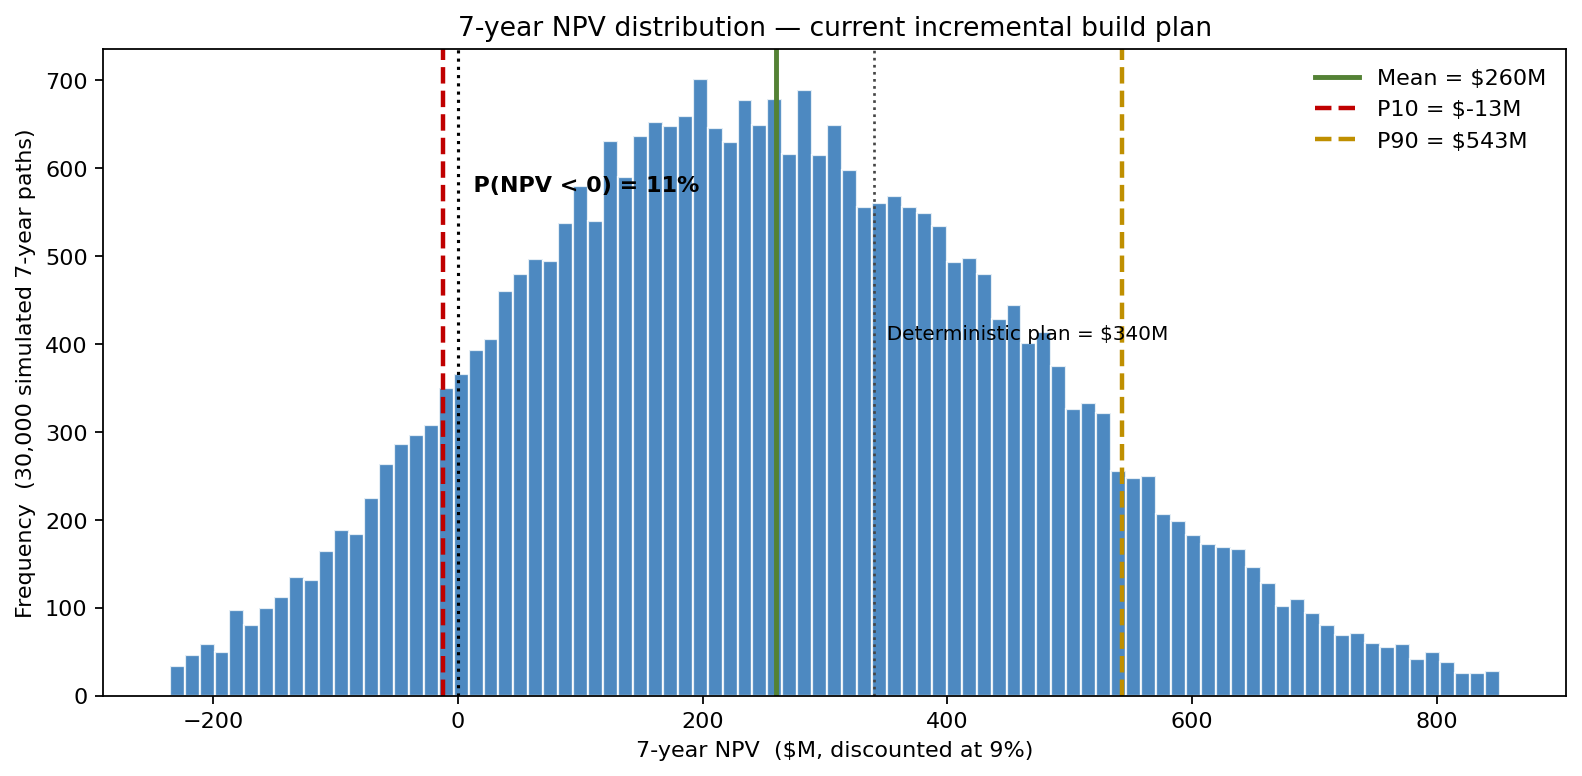
The deterministic NPV is one point on a curve that, for the current incremental plan, runs from a loss in the worst tenth of futures to better than +$543M in the best — and the shape of that curve, not the single number, is what tells the board which build strategy to authorise.
Demand: triangular per year, not flat CAGR
Customer count growth was modelled as a per-year Triangular(min 1%, mode 4%, max 9%) drawing fresh each year — not a single fixed CAGR — to allow the realistic possibility of a flat year followed by a rebound, or two-back-to-back weak years that compound badly. Bandwidth-per-customer was LogNormal(median 24 GB/mo, σ_log = 0.7) reflecting the long-tail of heavy users that dominate aggregate consumption.
Aggregate addressable load per year:
L_t = N_0 × Π(1+g_i for i<=t) × B_tproducing a P10/P90 spread on year-7 load of roughly 6× — the entire planning problem in one number.
Technology-adoption: Bass diffusion with stochastic parameters
5G-edge adoption is modelled with a Bass diffusion curve, not a triangular. Innovation coefficient p ~ Beta(6, 40) (mean 0.13), imitation coefficient q ~ Beta(30, 30) (mean 0.50), market potential m ~ Triangular(0.55, 0.70, 0.82) of addressable customer base. Drawing the three parameters jointly per simulation trial produces the spread of adoption-curve shapes that drive revenue:
- P10 year-5 adoption: 27% of addressable
- P50: 40%
- P90: 52%
A deterministic Bass curve hides this entirely. The simulation captures the joint event of slow innovation and slow imitation that depresses early-year revenue below the OpEx + interest-cost threshold — the source of the negative-NPV scenarios.
CapEx, OpEx and unit-economics
- CapEx per added Gbps of capacity: Triangular($45k, $75k, $130k) — cost-down learning curve but volatile silicon/optical-component pricing.
- OpEx: Beta on utilisation, scaled by fixed labour and energy. Energy modelled with a two-regime mean-reverting price (see "Data center optimization" article) — pure GBM systematically under-states the 7-year cost variance.
- ARPU uplift from 5G/edge services: Truncated Normal(mean $12/mo, σ $4, clipped to [$3, $25]) above the legacy mobile/broadband baseline. Bounded because regulators cap upside and competition floors downside; the incremental uplift is what the new CapEx is funded against, not the gross ARPU.
Three build strategies
The same demand/adoption distributions feed three CapEx programmes:
- Front-loaded (proactive). Build to year-7 P75 demand by year 2. Highest expected NPV when growth is realised; worst stranded-capacity profile when it isn't. CapEx $1.8B.
- Incremental (current plan). Modular adds annually triggered by realised demand. CapEx $1.3B but exposed to emergency-procurement premiums when realised growth exceeds plan. CapEx $1.3B.
- Flex-contract hybrid. Smaller in-house build + pre-purchased capacity options that activate above a demand threshold (transport on wholesale; compute on hyperscaler). CapEx $1.1B + $42M of option premium across 7 years.
What the deterministic plan got wrong
Deterministic NPV +$340M; simulation mean +$260M; P10 -$13M, P50 +$250M, P90 +$543M, P(NPV<0) ~11%. The asymmetry is real: the upside tail (high adoption + ARPU above plan) is bigger than the downside tail (because OpEx + amortised CapEx put a floor on losses), but the existence of an 11% probability of NPV-negative outcomes — and a downside P10 that grazes zero — is the new fact the board needed.
Which uncertainty hurts most
Sensitivity on P10 NPV (downside tail) rather than mean NPV:
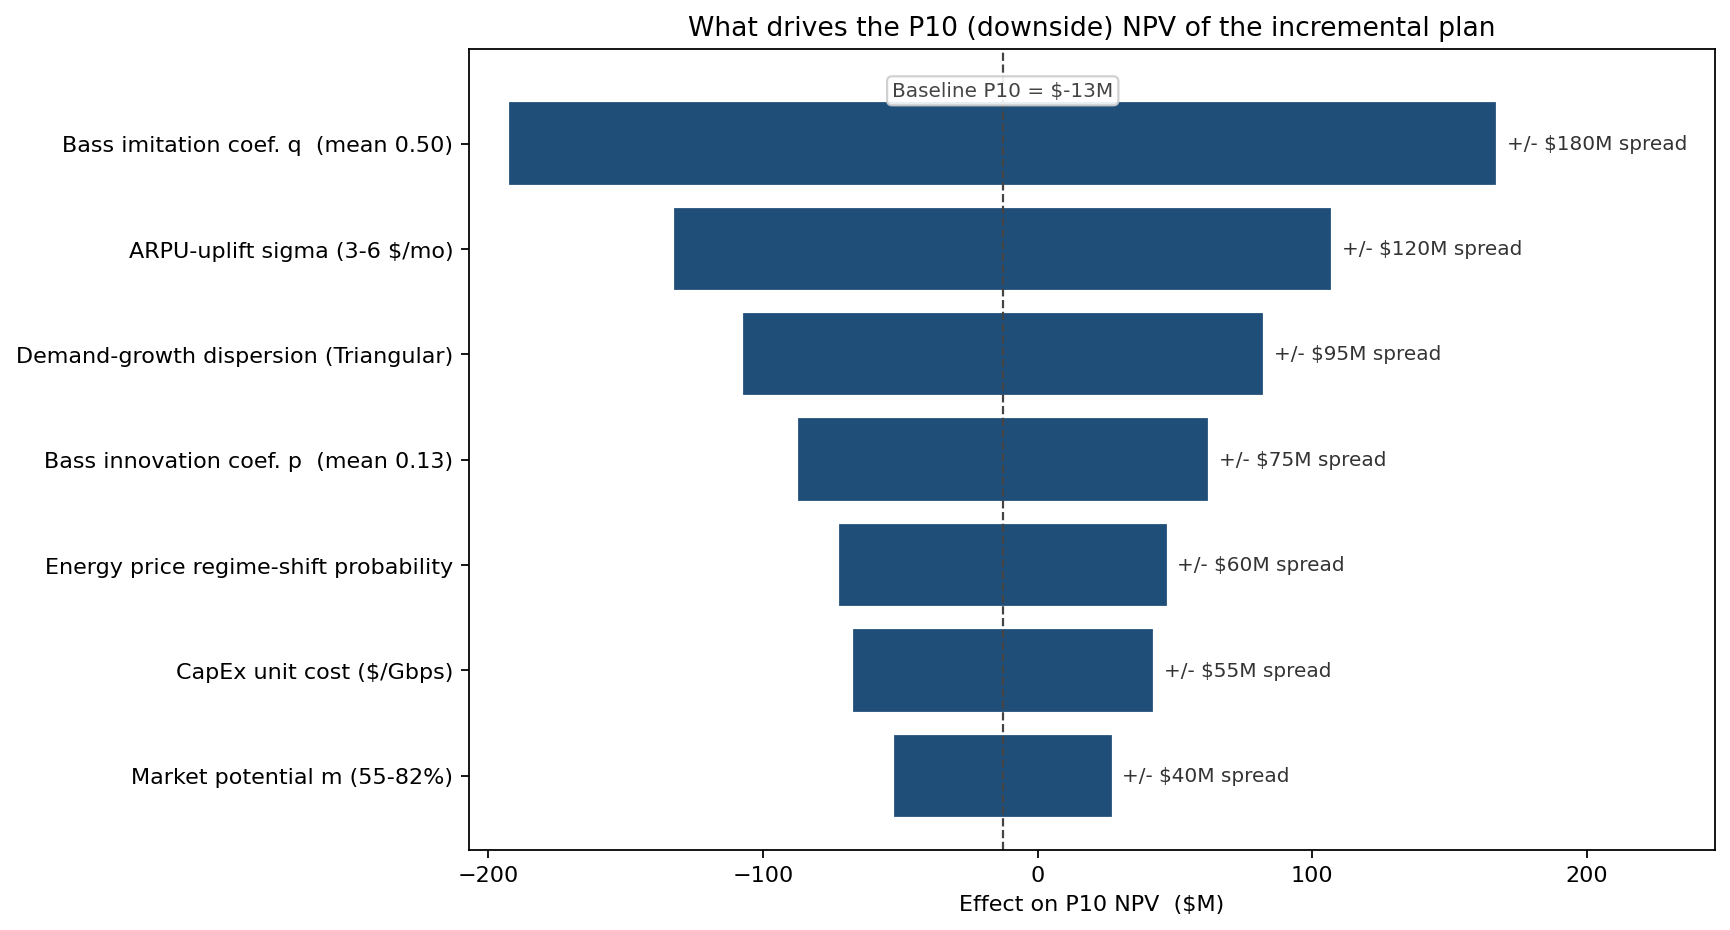
5G-adoption imitation coefficient q dominates the downside — slow word-of-mouth diffusion means revenue lags amortised CapEx for longer than the model allows. ARPU-uplift σ is second; demand-growth dispersion third. CapEx unit cost matters but ranks sixth — buying servers cheaper does not fix slow customer adoption, which is the most under-appreciated dependency in many in-house plans.
Three-strategy NPV CDF comparison
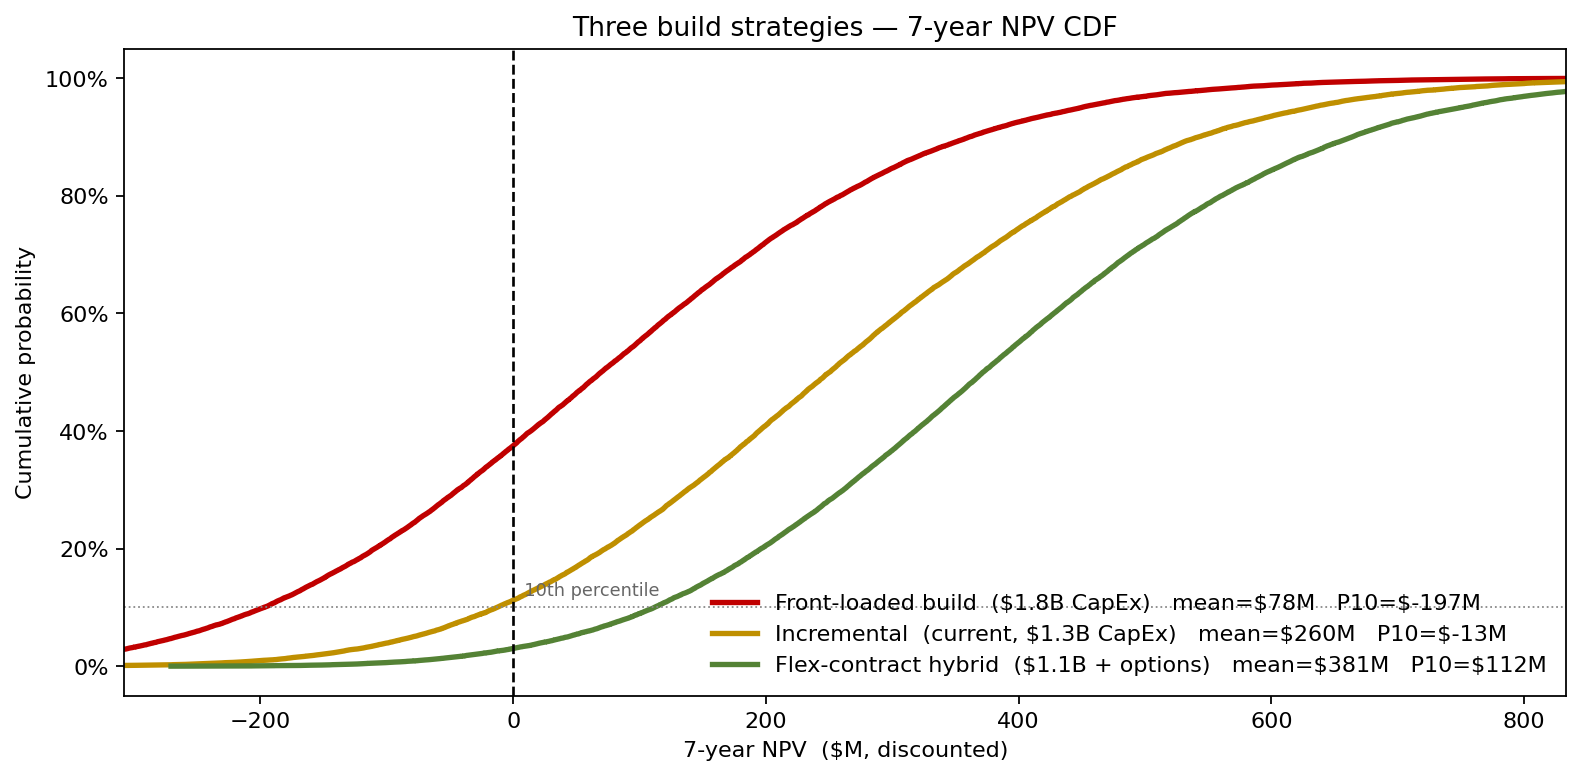
- Front-loaded: mean NPV +$78M, P10 -$197M, P90 +$361M — heaviest CapEx up front against demand that may not arrive, so both the worst downside and the lowest mean.
- Incremental (current): mean +$260M, P10 -$13M, P90 +$543M.
- Hybrid: mean +$381M, P10 +$112M, P90 +$664M — pre-purchased capacity options avoid both over-building and emergency procurement, lifting the mean and clearing the downside above zero.
The flex-contract hybrid dominates the other two strategies outright on this run — higher expected NPV and a P10 that stays positive. Trading $1.1B of committed CapEx plus $42M of option premium for the right (not obligation) to scale capacity is exactly the structure a deterministic NPV cannot price.
What changed
- Build plan switched to the flex-contract hybrid for the 5G-edge cycle. Capacity options pre-purchased from two transport wholesalers and a hyperscaler partner.
- 5G adoption modelling becomes the primary KPI. Quarterly p and q estimates against actual adoption replace the static CAGR target in the planning dashboard.
- CapEx authorisation reframed. The board paper now requires P10 NPV alongside expected NPV; programmes with P(NPV<0) > 20% require explicit risk-appetite sign-off.
- Hedging programme initiated on electricity and on silicon-component baskets, sized off the simulated P75 OpEx exposure not the deterministic plan.
ModelRisk Functionality Used
- Bass diffusion with Beta-distributed p and q parameters drawn jointly per trial — the right way to capture adoption-curve risk when the historical fit of p and q has high posterior uncertainty.
- Triangular per-year demand growth rather than a flat CAGR — preserves the joint probability of two consecutive bad years that compound badly into year-7 capacity.
- LogNormal bandwidth-per-user capturing the long-tail user distribution that drives the difference between mean and P90 aggregate load.
- Two-regime mean-reverting electricity price in the OpEx leg — corrects the GBM-on-trending-commodity error that suppresses 7-year cost variance.
- Truncated Normal on ARPU preventing draws outside the regulator-capped / competition-floored range that an unbounded Normal allows.
- Three-strategy NPV CDF overlay with P10 reporting that surfaced the flex-contract hybrid as the dominant choice on the (mean, downside) plane, not on the single-point NPV alone.
The deterministic NPV is one number on a curve that runs from -$197M to +$664M depending on which strategy and which realisation. Monte Carlo turns the curve into the artefact the board actually needs — and the artefact, not the single number, is what gets the build-strategy and hedging decisions right.