

Industry: Telecommunications and IT
Product: ModelRisk
Application: Quantifying IT downtime and its financial impact
The 99.9% SLA Gives You 8.76 Hours. Mean Downtime Is 6.7. What's the Probability of Breaching?
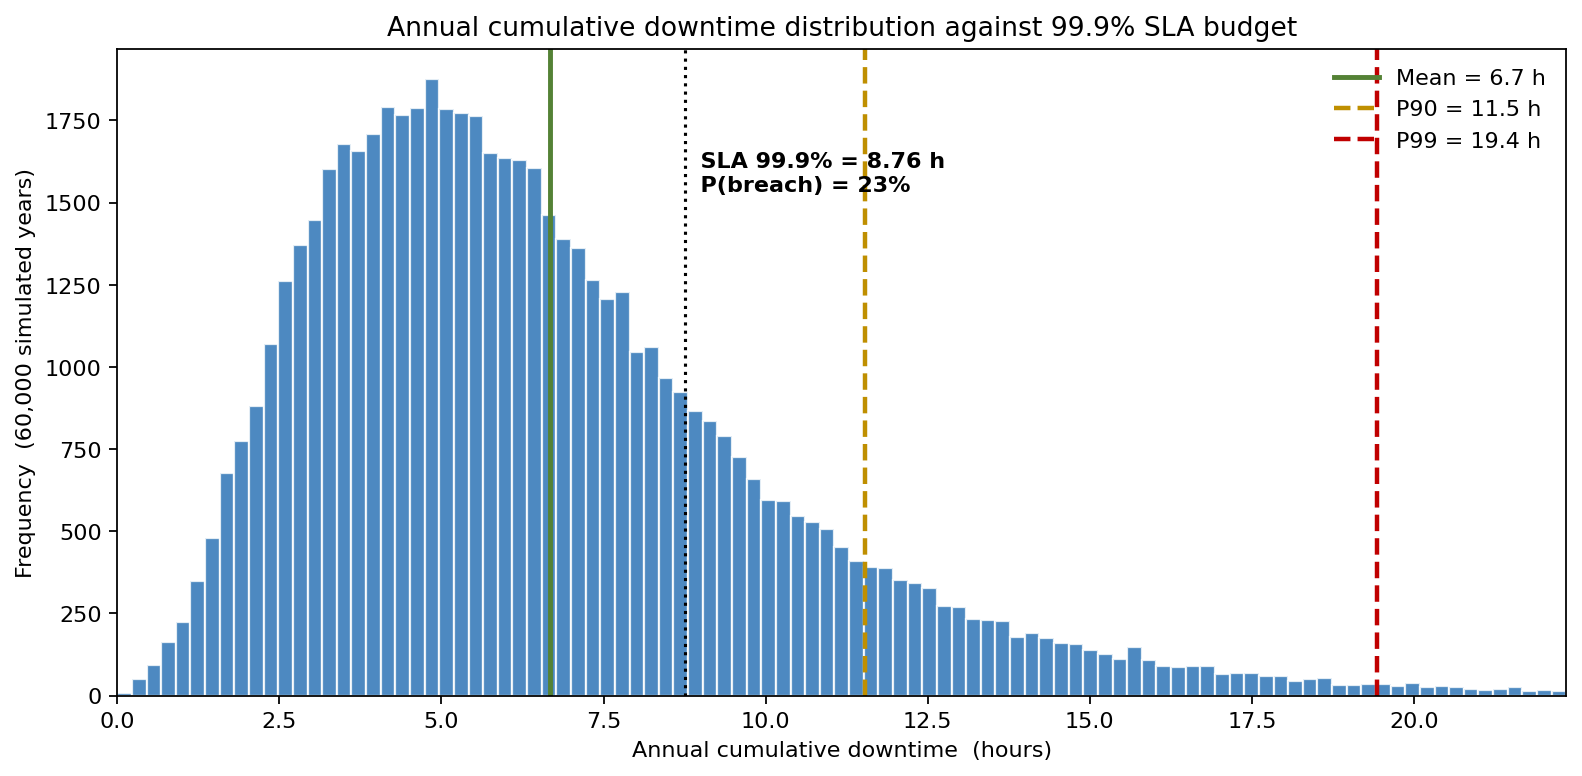
A three-nines (99.9%) availability SLA permits exactly 8.76 hours of downtime per year. The legacy planning spreadsheet at a multinational carrier reported an expected annual downtime of ~6.7 hours and the operations director declared the SLA "comfortably met". The simulation, built on the same incident-history data, said something the spreadsheet could not: P(annual downtime > 8.76 h) = 23% — roughly one year in four the SLA-credit clauses trigger. The mean sat just below the budget; the tail was the contractual exposure.
The chart below is the whole argument in one picture. The 8.76-hour SLA line falls between the mean and the P90: the regime where a deterministic plan declares the SLA "met" while nearly a quarter of simulated years cross the line.
A multinational carrier with $4.2B of enterprise managed-service contracts rebuilt its downtime model in ModelRisk: compound Poisson arrivals on five fault families, LogNormal duration per family, summed into an annual downtime distribution and priced against the SLA-credit schedule.
Five fault families, summed per year
Operations splits incidents into five categories with materially different rate and duration profiles. Each is a Poisson process whose annual count, summed across families, drives a per-event LogNormal MTTR:
- Hardware failure. λ = 4/yr, MTTR LogNormal median 18 min, σ_log = 0.6
- Software / deploy fault. λ = 2/yr, MTTR LogNormal median 55 min, σ_log = 0.95 — heaviest right tail
- Network / WAN. λ = 2.5/yr, MTTR LogNormal median 20 min, σ_log = 0.75
- Power / facility. λ = 0.4/yr, MTTR LogNormal median 80 min, σ_log = 0.7
- External (DDoS, BGP hijack, upstream): λ = 0.7/yr, MTTR LogNormal median 30 min, σ_log = 1.0
LogNormal is correct for MTTR — incidents are resolved by a multiplicative chain (paging → diagnosis → mitigation → verification), each step compounding the previous. A Normal fit on incident-log data systematically under-predicts the right tail because it misses the rare 6-hour incident that drives the entire SLA-breach probability.
Total annual downtime per year is T = Σ over all events of D_i.
Why the mean tells you nothing about the breach
The mean annual downtime under these distributions is ~6.7 hours; the median is ~5.9 hours; the P90 is ~11.5 hours; the P99 is ~19.4 hours.
The 99.9% SLA budget (8.76 h) sits between the mean and P90 — exactly the regime where deterministic plans falsely declare the SLA "met". The simulation says P(annual downtime > 8.76 h) = ~23% — roughly one year in four the SLA-credit clauses trigger. The right-skew is owned by the software-incident family: the rare multi-hour rollback is what eats the budget, not the routine 25-minute hardware blip.
What downtime actually costs
The carrier's enterprise SLA schedule:
- No credit below 8.76 h cumulative annual downtime
- 5% of monthly service charge per breach point between 8.76 h and 17.5 h
- 20% between 17.5 h and 43.8 h (99.5%)
- 50% credit + termination right above 43.8 h
For the $4.2B contract book, the total cost = SLA credits + customer-attributable revenue loss (averaged $14k/min of incident-affecting customer time). The simulation:
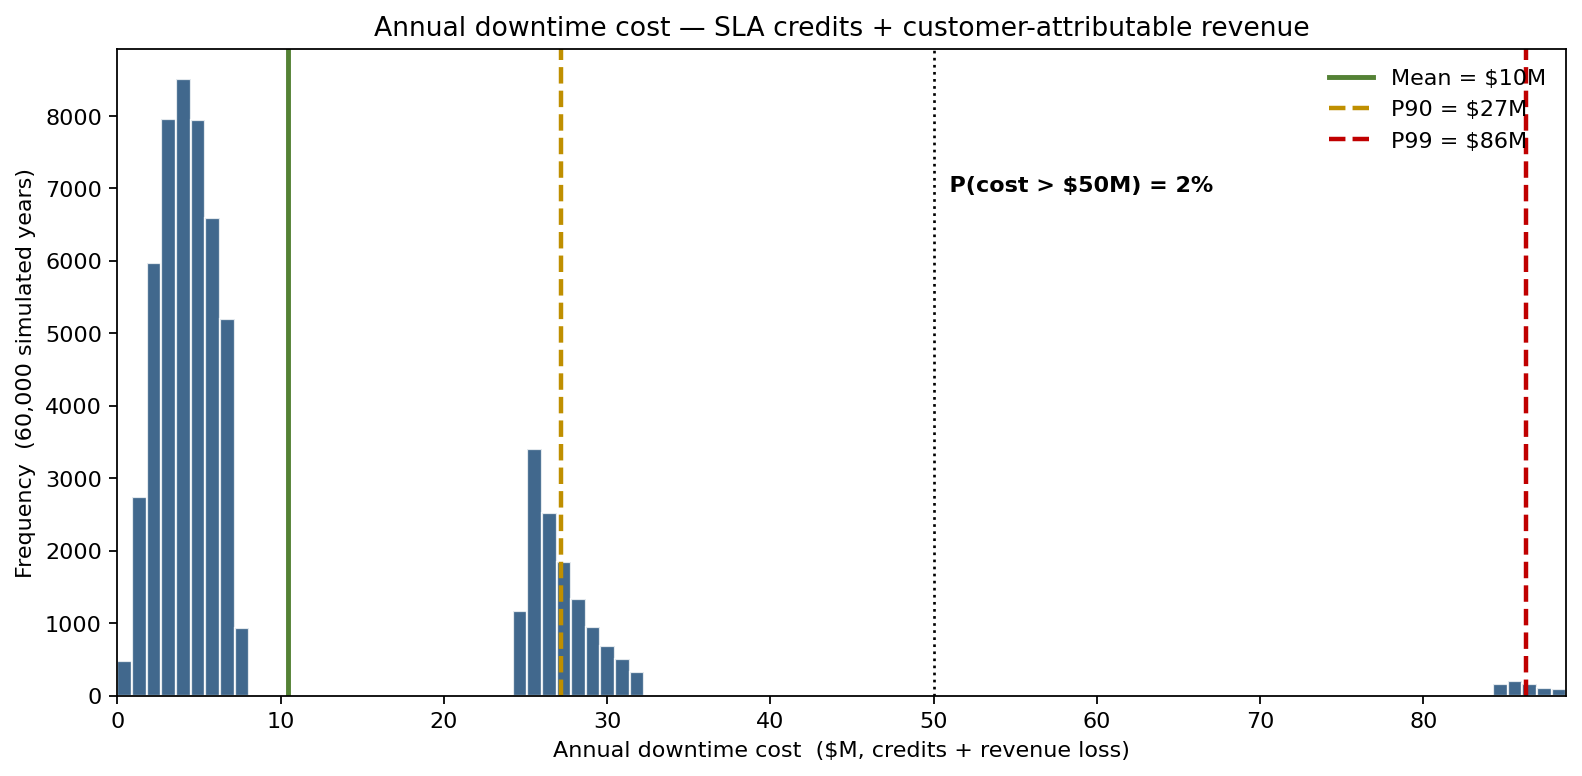
- Mean annual cost: $10M
- P90: $27M
- P99: $86M — driven by the 99.5%-breach tier with its 20% credit on the whole monthly charge
- P(cost > $50M) = ~2%
These are not noise: a P99 of $86M against a P50 of ~$5M means the tail is the contract risk, not the body.
What drives the tail
Sensitivity on P99 downtime ranks the five families by tail leverage:
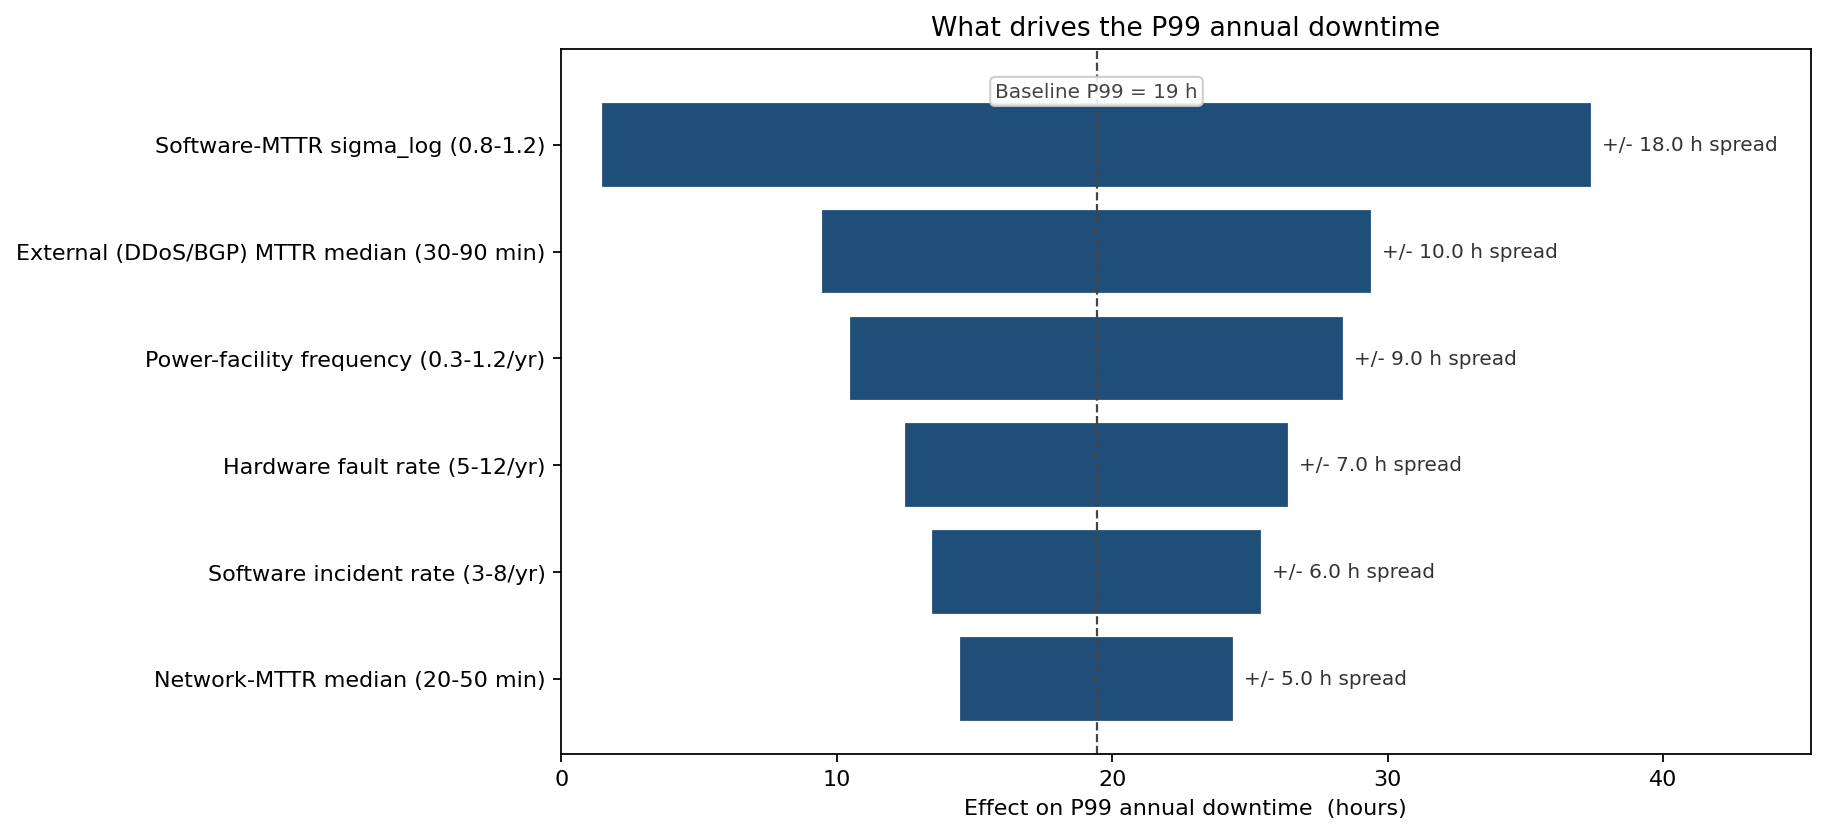
Software-incident MTTR σ dominates: tightening the σ_log of software-MTTR (e.g. through enforced rollback automation, capped change-windows, mandatory canary intervals) is the single largest lever on P99. External (DDoS/BGP) MTTR is second — driving the always-on scrubbing investment. Power/facility frequency is fourth despite being the longest-duration family, because λ is low; if it were higher it would dominate.
Investment decision: secondary site failover
A $42M, three-year capital programme to add a secondary site with sub-15-minute automated failover was evaluated against the same downtime distribution. Incidents still arrive at the same rate, but the entire MTTR distribution shifts from full-system rebuild times to fail-over times — so the per-event durations collapse while frequencies are unchanged.
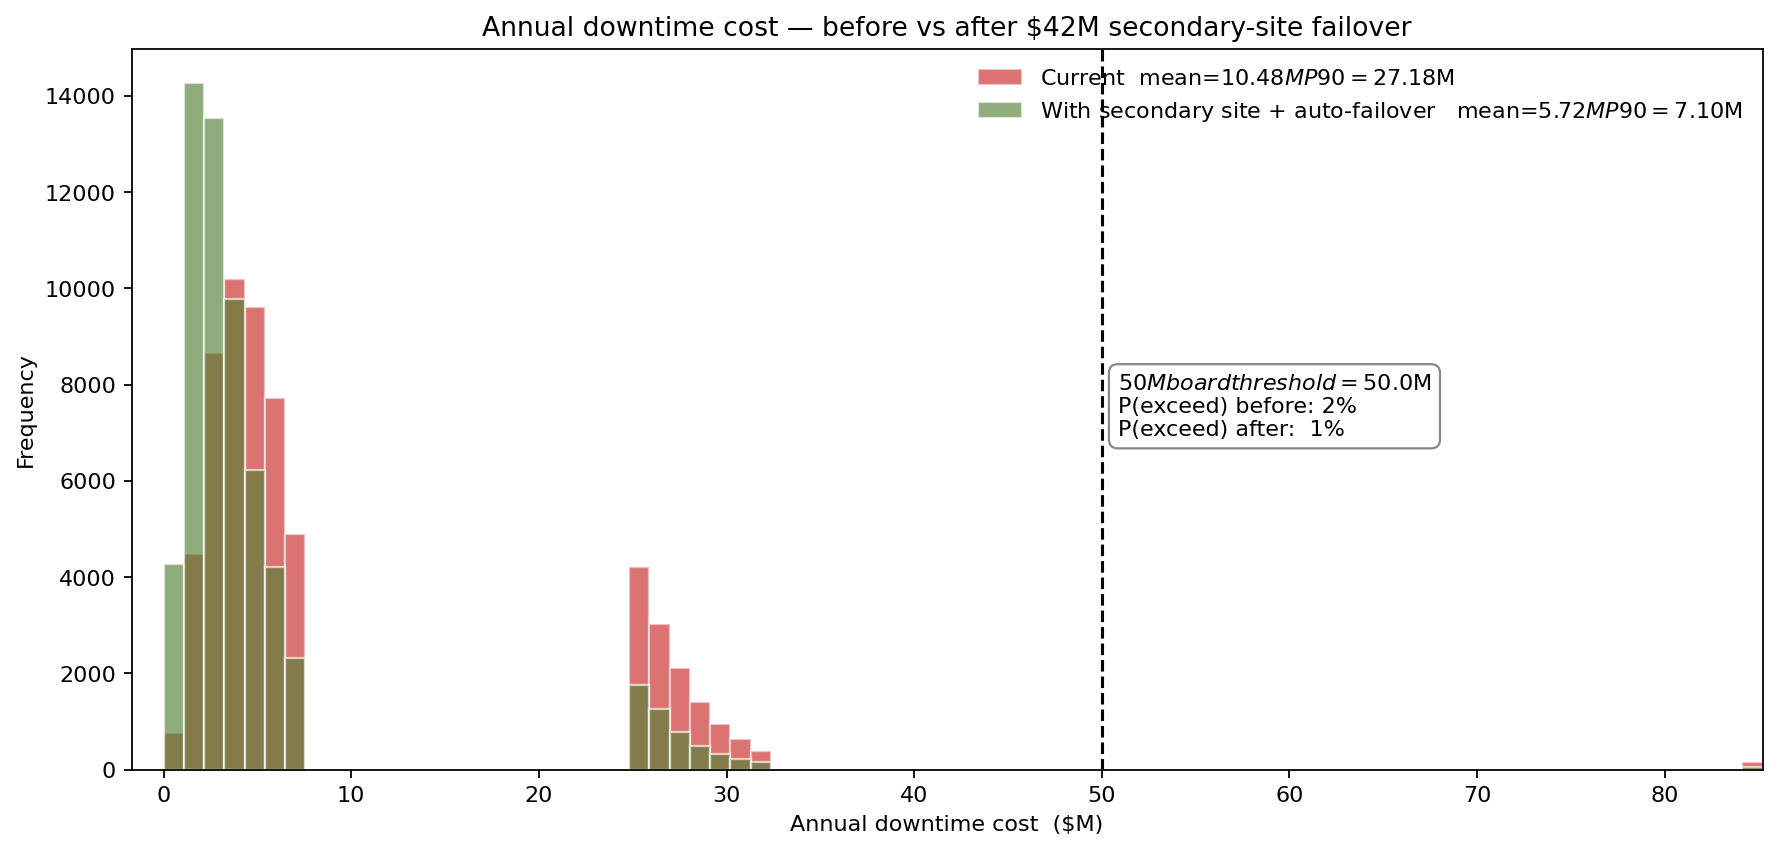
After the programme, mean annual cost falls from $10M to $6M, P99 falls from $86M to $31M. That ~$55M of P99 cost-reduction over the contract book is what cleared the capital review — the deterministic IRR alone fell short of the hurdle rate, but the explicit tail-clipping argument changed the framing.
SLA renegotiation
The same model output let the customer-success team re-tier the SLA portfolio:
- 8 customers had been quoted 99.99% on infrastructure incapable of delivering it (P(meet 99.99%) <40% in the simulation). Renegotiated to 99.95% with credit-schedule tweaks neither side felt was a concession.
- 12 customers were paying for 99.5% but the simulation showed 99.9% was being routinely delivered (P(meet 99.9%) >90%). They were upsold to the higher tier at a margin.
The simulation made an explicit pricing exercise possible where the deterministic plan only allowed an after-the-fact accounting of credits.
What changed
- Secondary site programme approved on the explicit P99 cost-tail reduction, not the IRR. Capex authorised within the quarter.
- SLA portfolio re-tiered based on per-customer simulated delivery probability, recovering ~$11M/yr in net margin.
- Quarterly downtime reporting reformatted to P50/P90/P99 + SLA-breach probability, replacing the mean-only dashboard that had hidden a 23% annual breach probability for three reporting cycles.
ModelRisk Functionality Used
- Compound Poisson + LogNormal stacks per fault family summed into a single annual downtime — the natural construction for cumulative downtime under heterogeneous fault classes, not derivable from
MTBF / (MTBF + MTTR). - LogNormal MTTR fitted to incident postmortems (specifying the median, which postmortems naturally report, rather than the mean which they do not).
- Probability-of-threshold output explicitly returning
P(annual T > 8.76 h)— the metric the SLA contract is denominated in. - Step-function SLA credit schedule evaluated per simulated year (not per simulated event) — captures the non-linearity that turns a 16-hour year into a ~$30M cost and an 18-hour year (which crosses the 17.5 h tier into a 20% credit) into a ~$85M cost.
- Before/after histogram overlay that priced the $42M secondary-site programme on its tail-clipping effect rather than its mean-MTTR improvement.
- Sensitivity ranking on P99 annual downtime surfacing software-incident MTTR σ ahead of hardware fault rate — re-prioritising the engineering backlog.
The mean annual downtime is the wrong question when the contract is denominated in tail-percentile breaches. The right question is the probability of crossing the 8.76-hour line — and Monte Carlo is what makes the answer a single defensible number rather than an after-the-fact credit reconciliation.