

Industry: Telecommunications and IT
Product: ModelRisk
Application: Data Security Risk Assessment
$40M a Year, a $260M Tail: Sizing the Breach-Cost Distribution
The IBM/Ponemon "Cost of a Data Breach" study reports a global average of $4.45M per breach, with telecom-and-IT industry averages running 15–25% higher. But the average is, again, the wrong question: GDPR fines alone are up to 4% of global annual turnover or €20M, whichever is greater, and the per-record cost spans three orders of magnitude depending on data type (basic contact info: $150; payment + auth credentials: $500+). For a multinational IT services group holding hundreds of millions of customer records, the right question is the full breach-cost distribution against regulatory and contractual thresholds, not a single point estimate.
A multinational IT services group holding ~480M customer records across 14 jurisdictions rebuilt its data-security exposure model in ModelRisk. The legacy register multiplied a $4.45M average breach cost by 5.2 incidents a year and booked $23.1M of expected annual exposure. The simulation — frequency-severity per breach class, composed across external, insider, and supply-chain sources over 60,000 simulated years — puts the mean nearer $40M and the P99 at $264M, almost an order of magnitude above the deterministic figure.
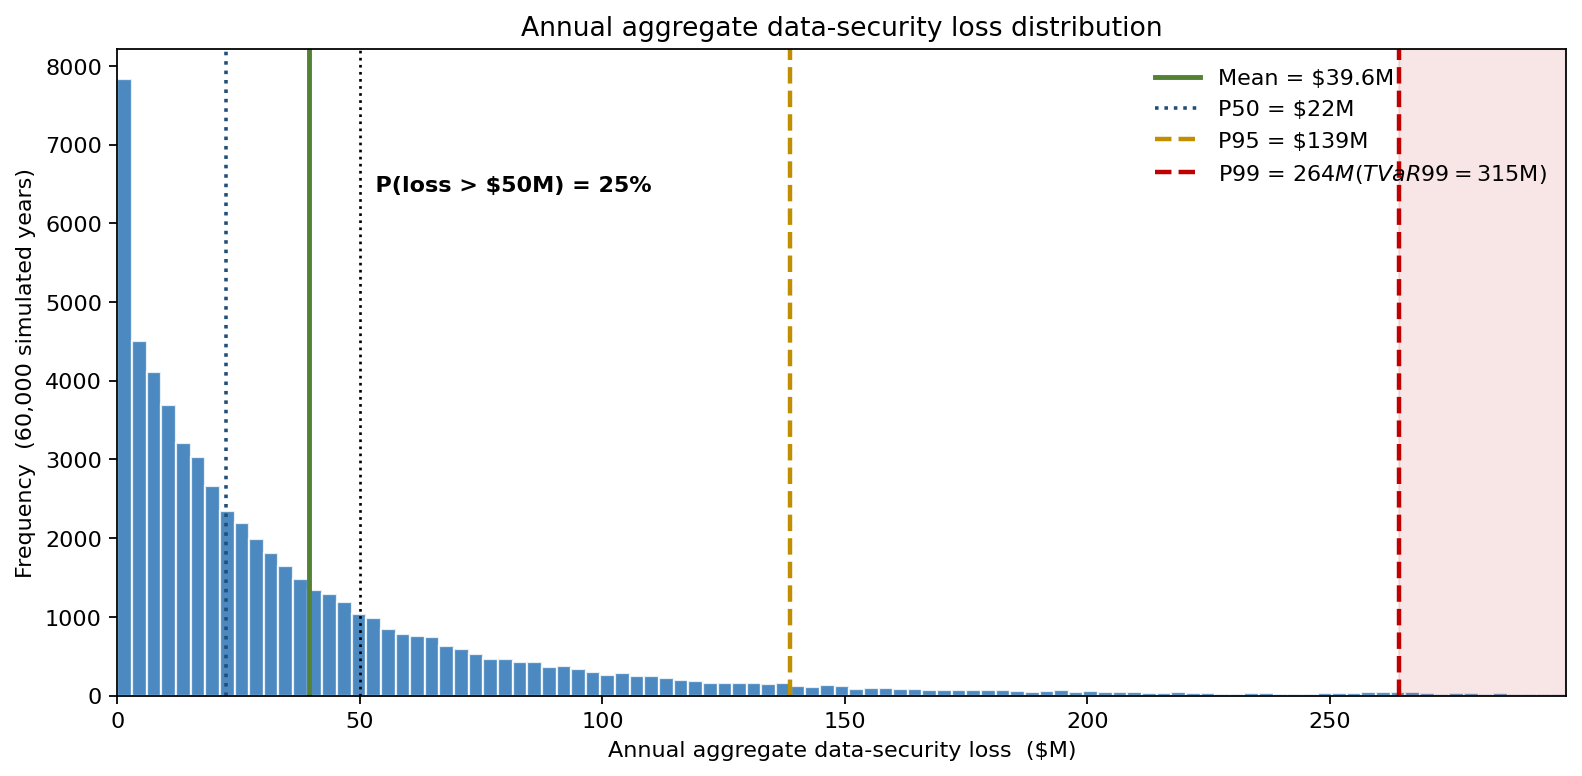
The average is the wrong question. The right one is the full breach-cost distribution against regulatory and contractual thresholds — which is what the rest of this build delivers.
Per-incident severity: records × per-record cost
A single breach event has two compounding stochastic dimensions: how many records are exposed and what those records cost to remediate per unit.
- Records exposed per incident. Heavy-tailed in the published breach record. Modelled as LogNormal(median = 8,000 records, σ_log = 1.6) — the 99th percentile reaches into the hundreds of thousands of records per incident, consistent with the Verizon DBIR breach-size distribution.
- Per-record cost. Conditional on data class:
- Basic identity (~70% of breaches): Triangular($90, $150, $230)
- Identity + payment (~22%): Triangular($180, $310, $520)
- Identity + authentication credentials (~8%): Triangular($350, $560, $980)
- Incident class mix drawn per simulated event with the above proportions.
Per-incident direct cost = records × per-record × class-specific multiplier, capped at the operational ceiling of $250M per incident (above which the cost mechanism shifts entirely to fines and litigation).
Regulatory fines: GDPR-style, not Normal
GDPR fines are not normally distributed. They are bounded below by zero, capped at 4% of global turnover (~$370M for this company), and the conditional distribution given an enforcement action is highly skewed. The model uses:
- P(enforcement action | reported breach) = Beta(2, 8) — mean 20%
- Fine | action: LogNormal median $2.0M, σ_log = 1.4, capped at 4% of turnover.
The cap matters: the unconditional LogNormal puts non-trivial mass above the cap, but the cap is binding and the regulator does not exceed it. A Normal or unbounded LogNormal would systematically overstate fine variance and understate the 4%-of-turnover mass point.
Annual frequency: thinned Poisson by class
Three sources of breach events, each modelled as a thinned Poisson (attempts × per-attempt success probability):
- External (cyber): attempt rate ~12,000/yr, per-attempt success Beta(2, 5998) (mean 0.033%, fat upper tail) → thinned λ ≈ 4 successful breaches/yr
- Insider (negligent + malicious): NegBin(mean 0.8, dispersion 1.6) → over-dispersed because insider events cluster around restructurings
- Third-party / supply chain: Poisson λ = 0.5/yr (rare but high-impact)
Total reported breach incidents per year: typically 4–8, with a 1-in-50 year producing 12+.
What the deterministic model said
The legacy register used $4.45M × 5.2 incidents/year = $23.1M expected annual exposure. The simulation, charted above:
- Mean annual exposure: $40M (above the deterministic estimate, because the mean is pulled up by the right tail)
- P50: $22M (the median year is materially below the mean — the distribution is right-skewed)
- P95: $139M
- P99: $264M — almost an order of magnitude above the deterministic figure
- P(annual exposure > $50M) = ~25%
The right tail is driven by the joint event of a large external breach (multi-million records, identity + auth-credential class) plus a regulator-friendly jurisdiction triggering the 4%-of-turnover fine cap. The deterministic register makes no provision for this event because it has no concept of joint distributions.
Tail-leverage ranking
Sensitivity on P95 annual loss ranks the inputs by tail effect, not mean effect.
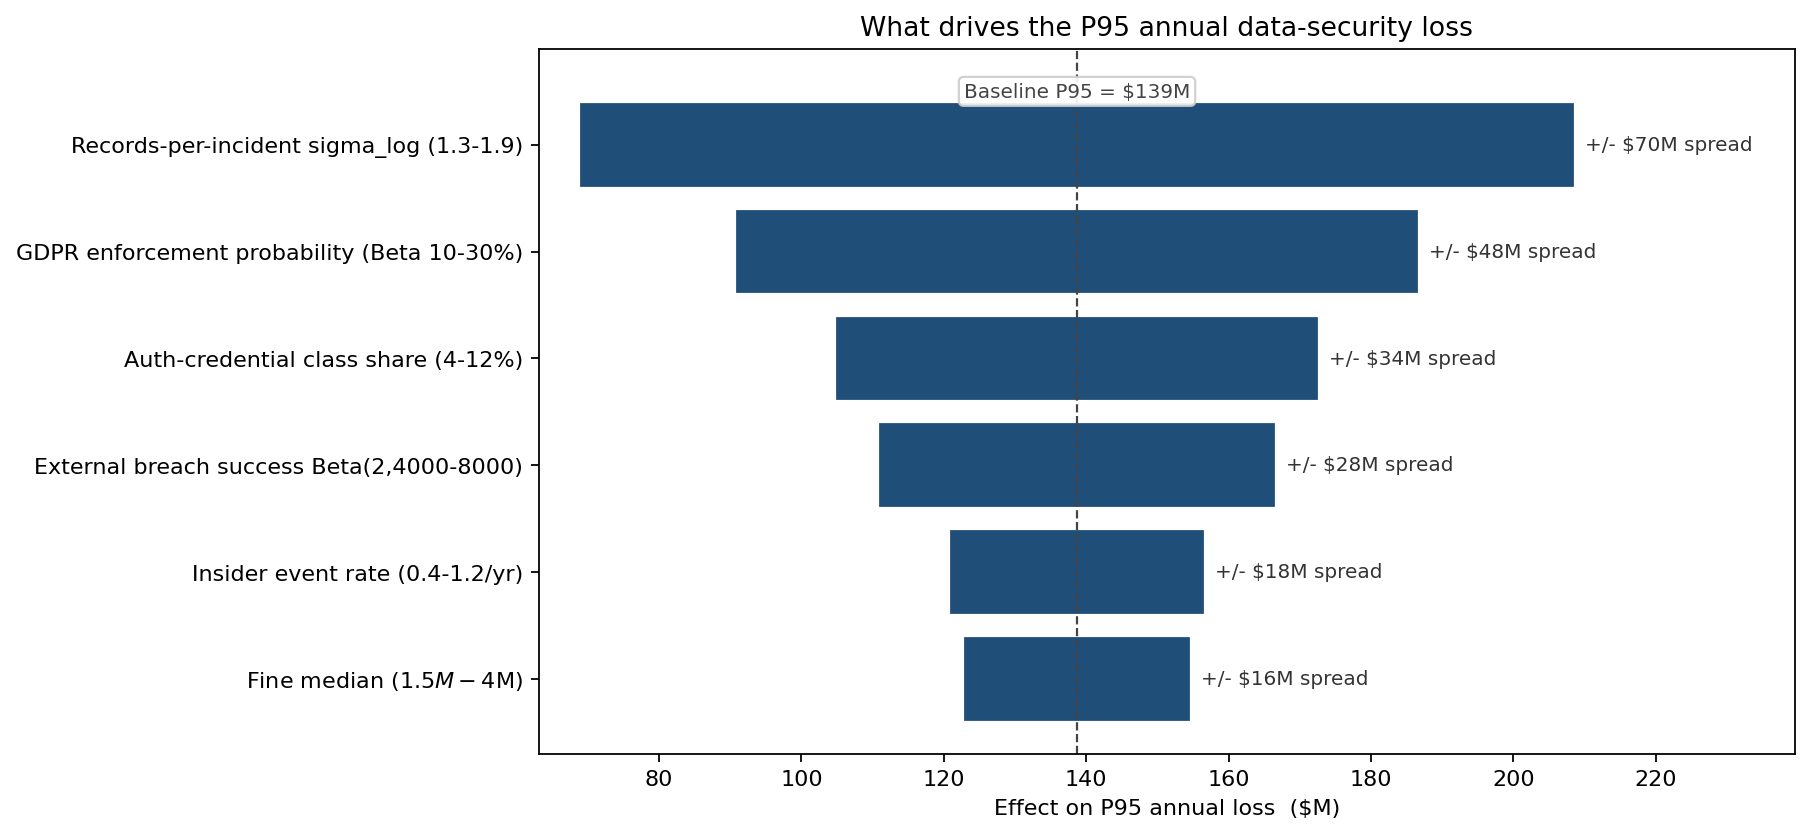
Records-per-incident σ_log dominates: tightening the upper tail of "how many records per breach" by improving segmentation and data-minimisation moves P95 by ~$35M across the tested range. GDPR enforcement probability and the auth-credential class mix follow. External breach success rate is fourth. Insider event rate — the headline number in many internal risk dashboards — is fifth, because insider events tend to be smaller per-event.
Control investments — three competing programmes
Three packages were simulated against the same threat distributions:
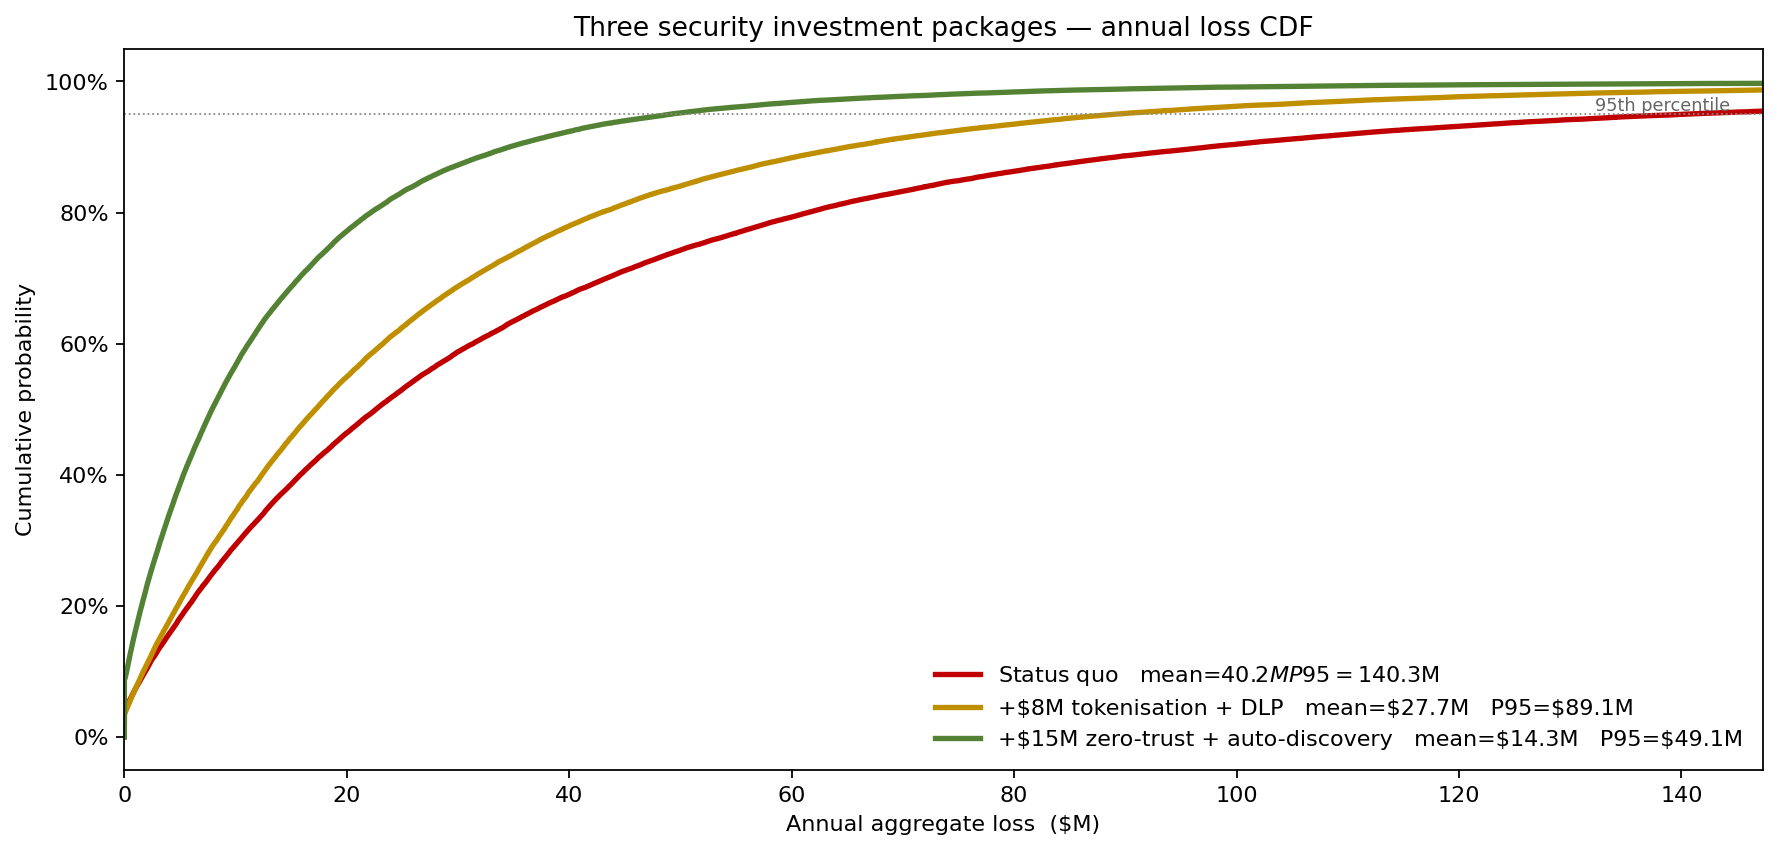
- Status quo. Mean $40M; P95 $140M.
- +$8M tokenisation + DLP. Cuts per-record cost on the payment and auth-credential classes by ~40% and reduces the records-per-incident upper tail. Mean falls to $28M; P95 to $89M.
- +$15M zero-trust segmentation + automated discovery. Cuts external breach success Beta from (2, 5998) to (2, 13000) and tightens records-per-incident σ_log further. Mean $14M; P95 $49M.
The full $15M programme returns expected loss savings of ~$26M/yr against the $15M annual cost — already justified on expected value alone — and clips the P95 by ~$90M. That tail-clip is what made it the unanimous board decision.
Per-incident breach severity, conditional
For operational planning (the IR runbook), the conditional severity distribution given a breach occurred is the relevant artefact:
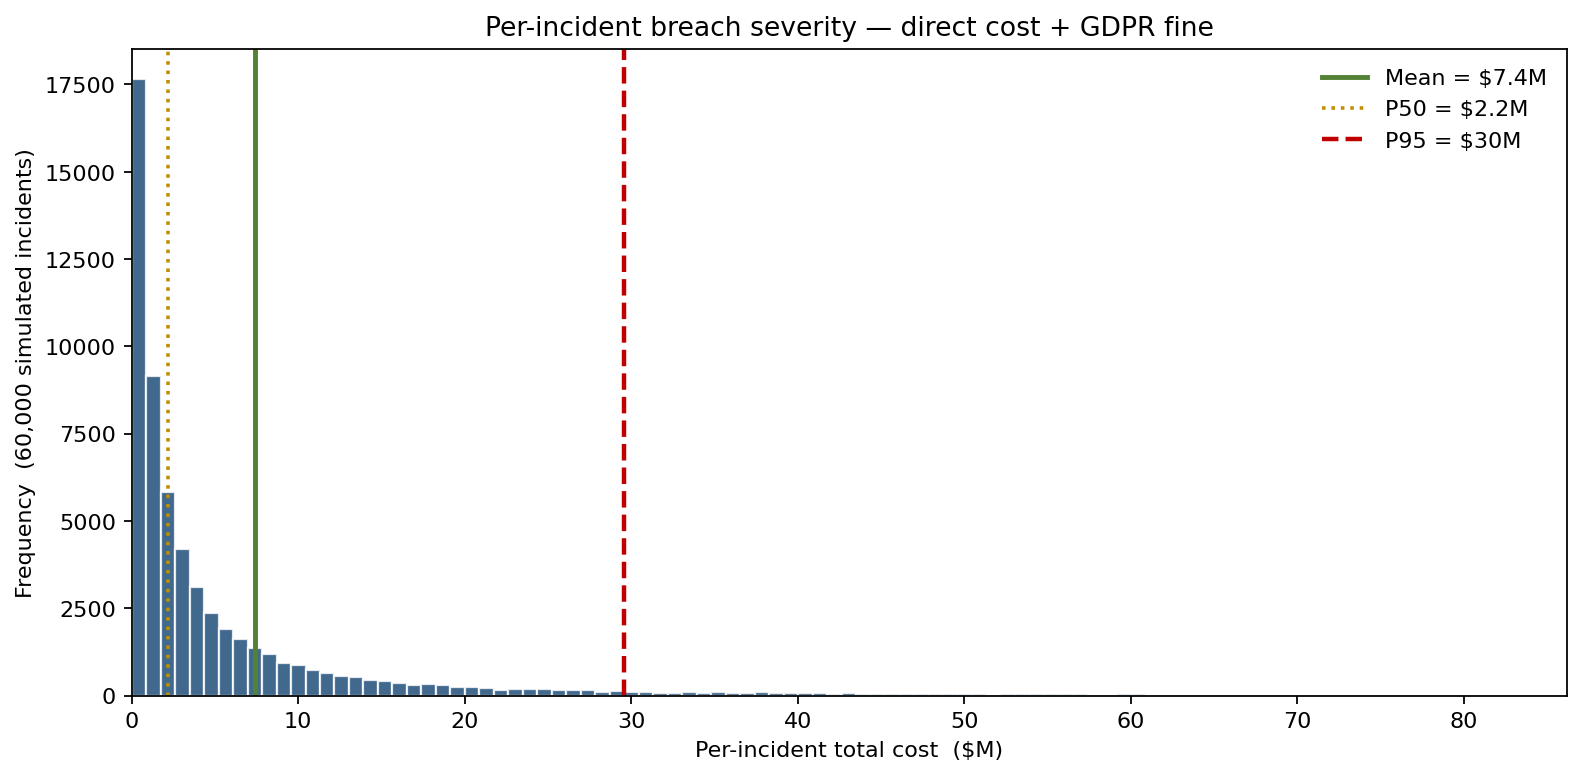
Median per-incident total cost is ~$2.2M, the mean is ~$7.4M (pulled up by the tail), P95 is ~$30M, and the rare "auth-credential class × multi-million record plus 4%-of-turnover fine" combination produces incidents well above $150M. The IR team budgets staffing and outside counsel from these percentiles, not from the mean.
What changed
- Cyber-insurance retention raised from $8M to $25M after the simulation showed expected premium savings exceeded the increase in retained loss with P99 still inside risk appetite.
- Tokenisation programme accelerated. Approved for the payment + auth-credential records first, cutting the upper-tail per-record cost on the riskiest data class.
- Board reporting metric changed from "annual expected loss" to "P95 annual loss" — the metric that actually moves with control investment.
- Two M&A targets repriced. Acquired companies' record counts were folded into the simulation and produced expected synergy adjustments of ~$8M/yr in security spend savings net of integration cost.
ModelRisk Functionality Used
- LogNormal records-per-incident with class-conditional per-record cost — captures the order-of-magnitude spread that a single point estimate cannot.
- Beta-distributed GDPR enforcement probability and capped LogNormal fine | action — the bounded-at-zero, capped-at-4%-turnover regulator behaviour cannot be modelled as a Normal.
- Thinned Poisson construction for external breaches (attempt rate × success Beta) — the same correction applied to the cybersecurity-risk model: never multiply a Poisson rate by a probability without thinning it first.
- Negative Binomial insider frequency — over-dispersed Poisson reflecting the HR-cycle clustering observed in the company's own breach history.
- Tornado on P95 annual loss ranking records-per-incident σ_log first — surfacing data-minimisation and segmentation as the highest-leverage controls.
- Three-scenario CDF overlay that directly priced the $15M zero-trust programme on its tail-clipping effect, not its mean-loss reduction.
The breach-cost average is a fact about the past. The breach-cost distribution — with its right tail at $264M and its 25% probability of crossing the $50M board threshold — is the fact about the future that the security budget actually has to defend against, and Monte Carlo is what makes that future quantitatively visible.