

Industry: Telecommunications and IT
Product: ModelRisk
Application: Cybersecurity risk analysis
Pricing the Tail of a Ransomware Year: Cyber Risk in ModelRisk
A large-enterprise carrier or IT services group sees on the order of 8–15 successful cyber events per year — phishing-driven account compromises, ransomware deployments, DDoS extortions, insider exfiltrations. Most are absorbed quietly; a handful are reported; one or two reach the board. The financial range across event types spans four orders of magnitude: a contained phishing incident costs tens of thousands of dollars, a major ransomware event with downtime and ransom can pass $50 million. A single static risk register cannot price a distribution that wide. What the security and finance teams need is the annual aggregate loss curve — and where, on that curve, the next dollar of control investment shifts the needle.
A telecom-and-IT services group with ~120,000 employees and a $9.2B revenue base rebuilt its cyber loss view in ModelRisk: a frequency-severity stack per threat type, composed across four threat families, run over 60,000 simulated years. The old risk register stacked single-point estimates and reported an expected annual cyber loss of $36M. The simulation puts the mean at $51M, the P95 at $152M, the P99 at $260M, and a 1-in-50 year above $209M — and tells a far richer story about the shape of that curve.
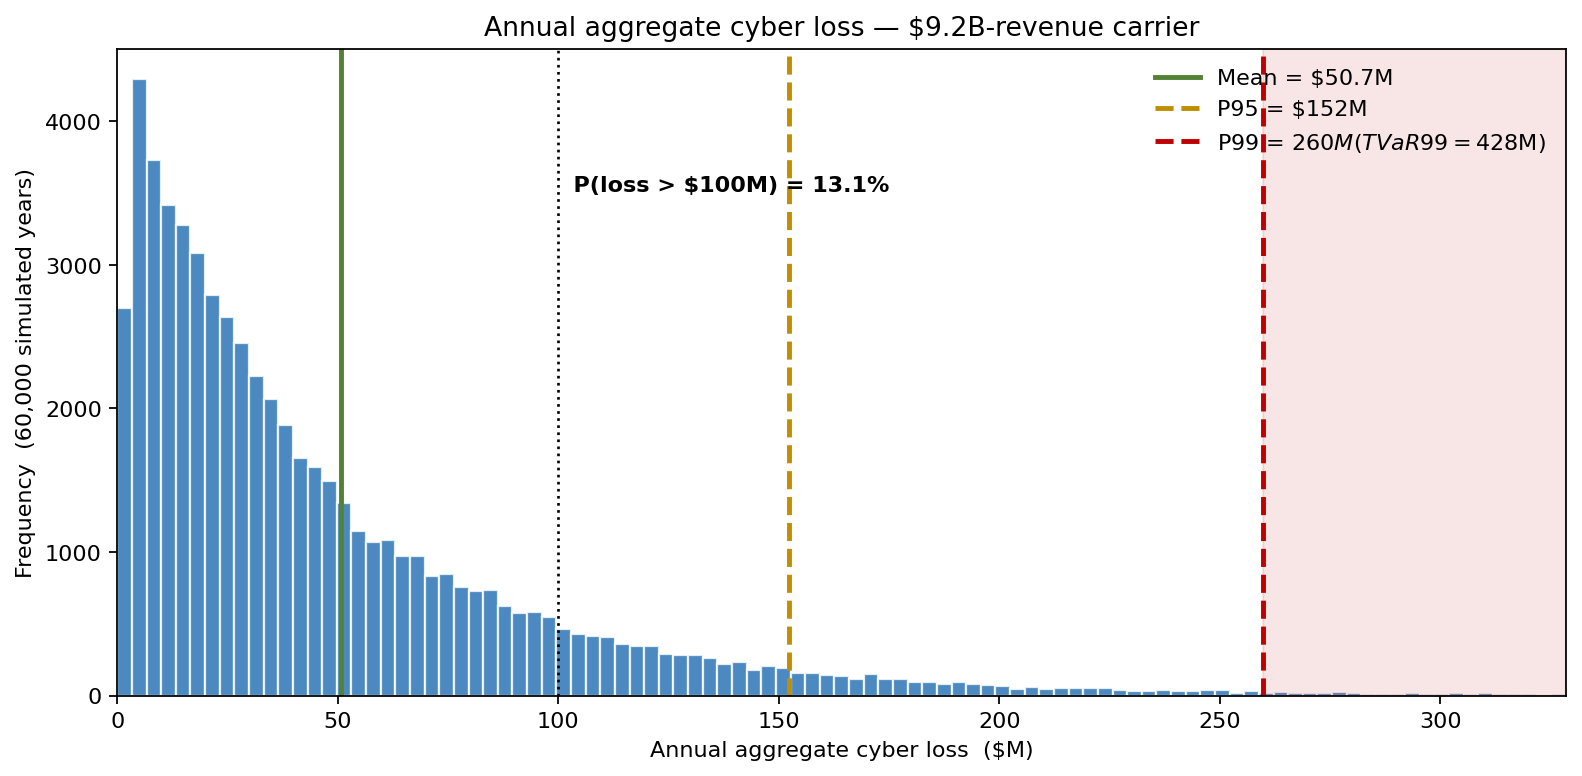
A reserve built on the deterministic mean is a reserve sized for a quiet year; the bad year empties it and then some. The rest of this build shows where, on that curve, the next dollar of control investment actually moves the needle.
Frequency, not "probability of attack"
The previous in-house model contained a familiar bug: an attack rate λ was treated as a probability and multiplied by (1 - control_effectiveness). That conflates a Poisson count with a Bernoulli probability — fine when λ is small, badly wrong when λ > 1 (which is the normal case for phishing and credential-stuffing). The rebuilt model treats each threat as a thinned Poisson process: attempted-event rate × probability-of-successful-event-per-attempt produces a Poisson rate of successful events, not a probability.
For each threat family:
- Phishing-driven compromise. Attempted rate ~10,000/yr (industry-typical for a 120k-employee carrier). Per-attempt success probability ~0.04% (one in 2,500), giving thinned λ ≈ 4 successful credential-theft events per year.
- Ransomware. Attempt rate ~80/yr (network intrusion attempts of varying sophistication). Per-attempt success probability is a Beta(2, 38) — mean 5%, mostly low but with a fat upper tail when controls degrade. Thinned λ ≈ 4/yr.
- Insider exfiltration. Negative-Binomial (mean 1.2/yr, dispersion 1.5) — over-dispersed because insider events cluster around HR cycles (restructurings, terminations).
- DDoS extortion. Poisson with λ = 2.5/yr (DDoS events large enough to materially impact a customer-facing service).
Total successful events per year is the sum across families — typically 8–15, occasionally 25+ in a bad year.
Severity per event
Each event family draws an independent severity:
- Phishing-compromise loss: LogNormal median $120k, σ = 1.4 (covers everything from "reset and forget" to one-off ACH fraud).
- Ransomware total loss: composite of ransom payment + business interruption + recovery cost. Ransom modelled LogNormal median $2.5M, σ = 1.3, of which only ~35% of victims pay; BI and recovery LogNormal median $4M, σ = 1.0. A rare 3% "extreme" mode draws BI from a Generalized Pareto tail above $50M — these are the SolarWinds-class events.
- Insider exfiltration: LogNormal median $800k, σ = 1.5.
- DDoS extortion: triangular($50k, $300k, $2M) for service-credit + mitigation costs.
LogNormal is the standard cyber-severity choice (Verizon DBIR, Advisen Cyber Loss data both fit log-skew); the GPD tail on ransomware captures the catastrophic-event regime that a single LogNormal undersells.
What the deterministic register said
The old register's $36M point estimate is below even the simulated mean. As the curve above shows, mean annual loss ≈ $51M, P95 ≈ $152M, P99 ≈ $260M (TVaR99 ≈ $428M), and a 1-in-50 year exceeds $209M. The probability the year exceeds $100M is ~13% — better than one year in eight. The deterministic figure understates both the central estimate and, far more importantly, the tail the reserve actually has to absorb.
What drives the tail
Sensitivity on P99 annual loss ranks the controls by tail-shift, not by point-estimate impact.
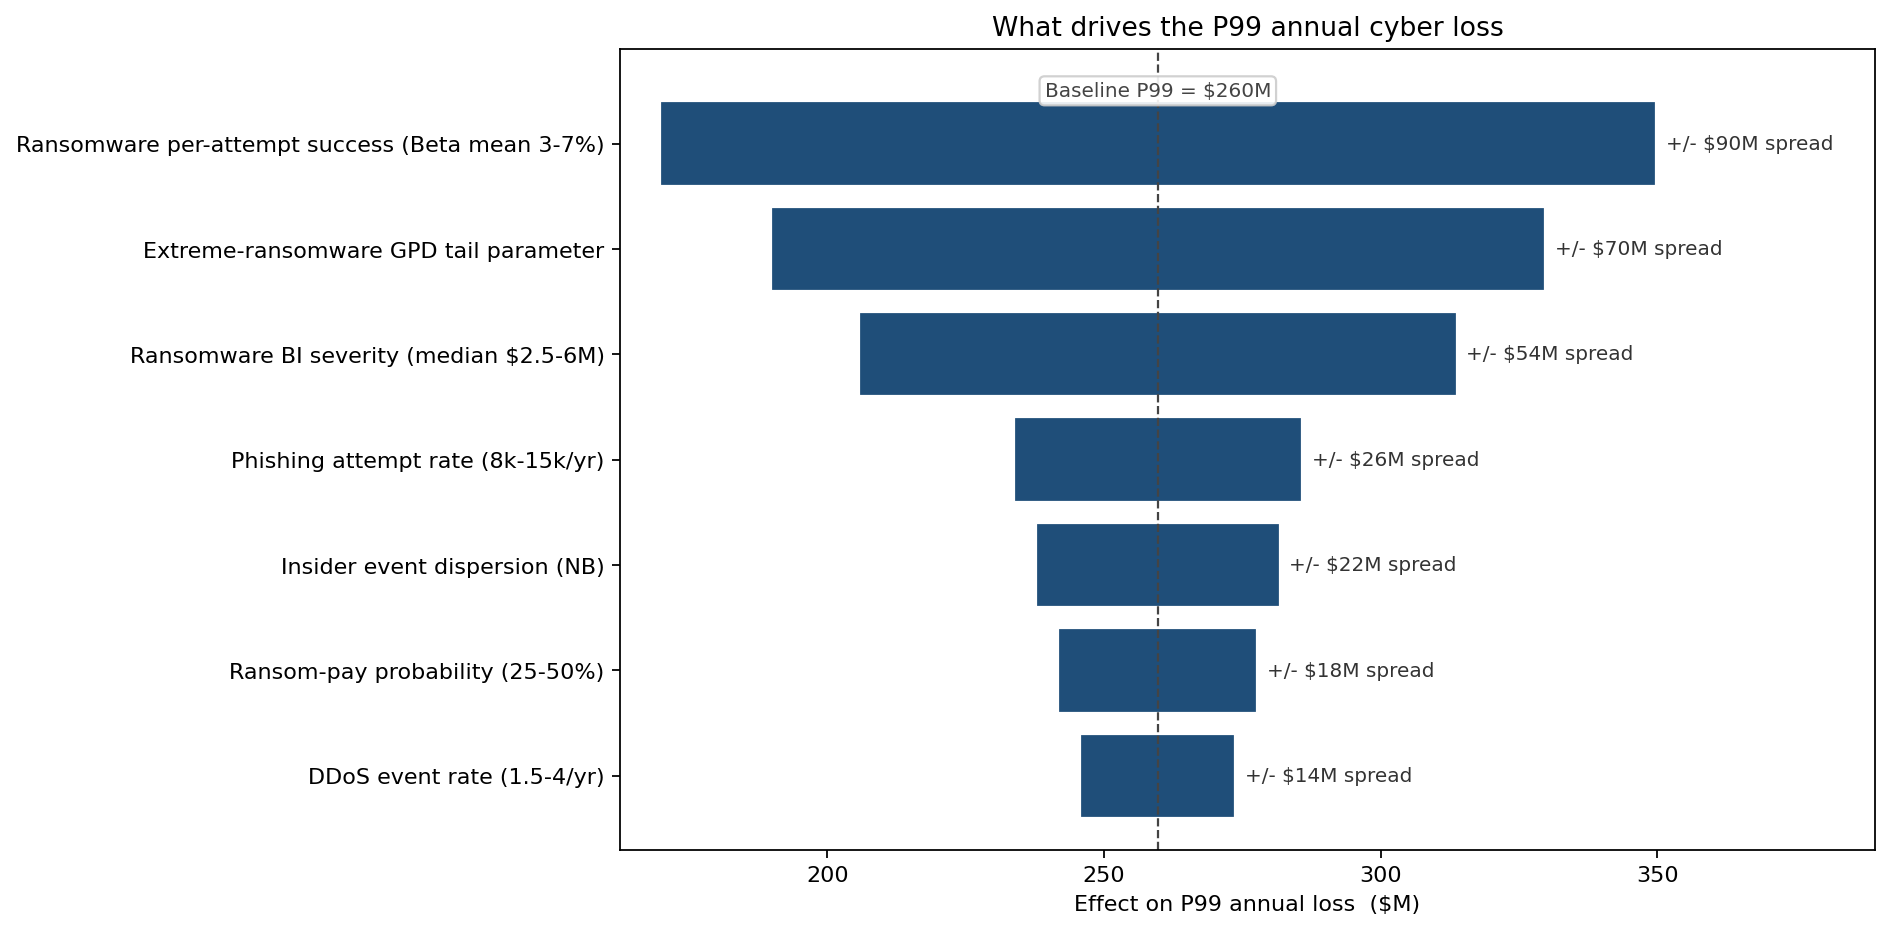
The ransomware-success Beta dominates — a shift of just two percentage points in per-attempt success probability (from a Beta(2,38) mean of 5% down to 3%) shaves tens of millions off P99. The GPD tail parameter on extreme ransomware is second. Phishing volume, which the deterministic register treated as the headline number, matters less for the tail because individual phishing losses are small. This is exactly the inversion that drove the security investment priorities.
Three control scenarios
Three investment packages were simulated against the same threat distributions:
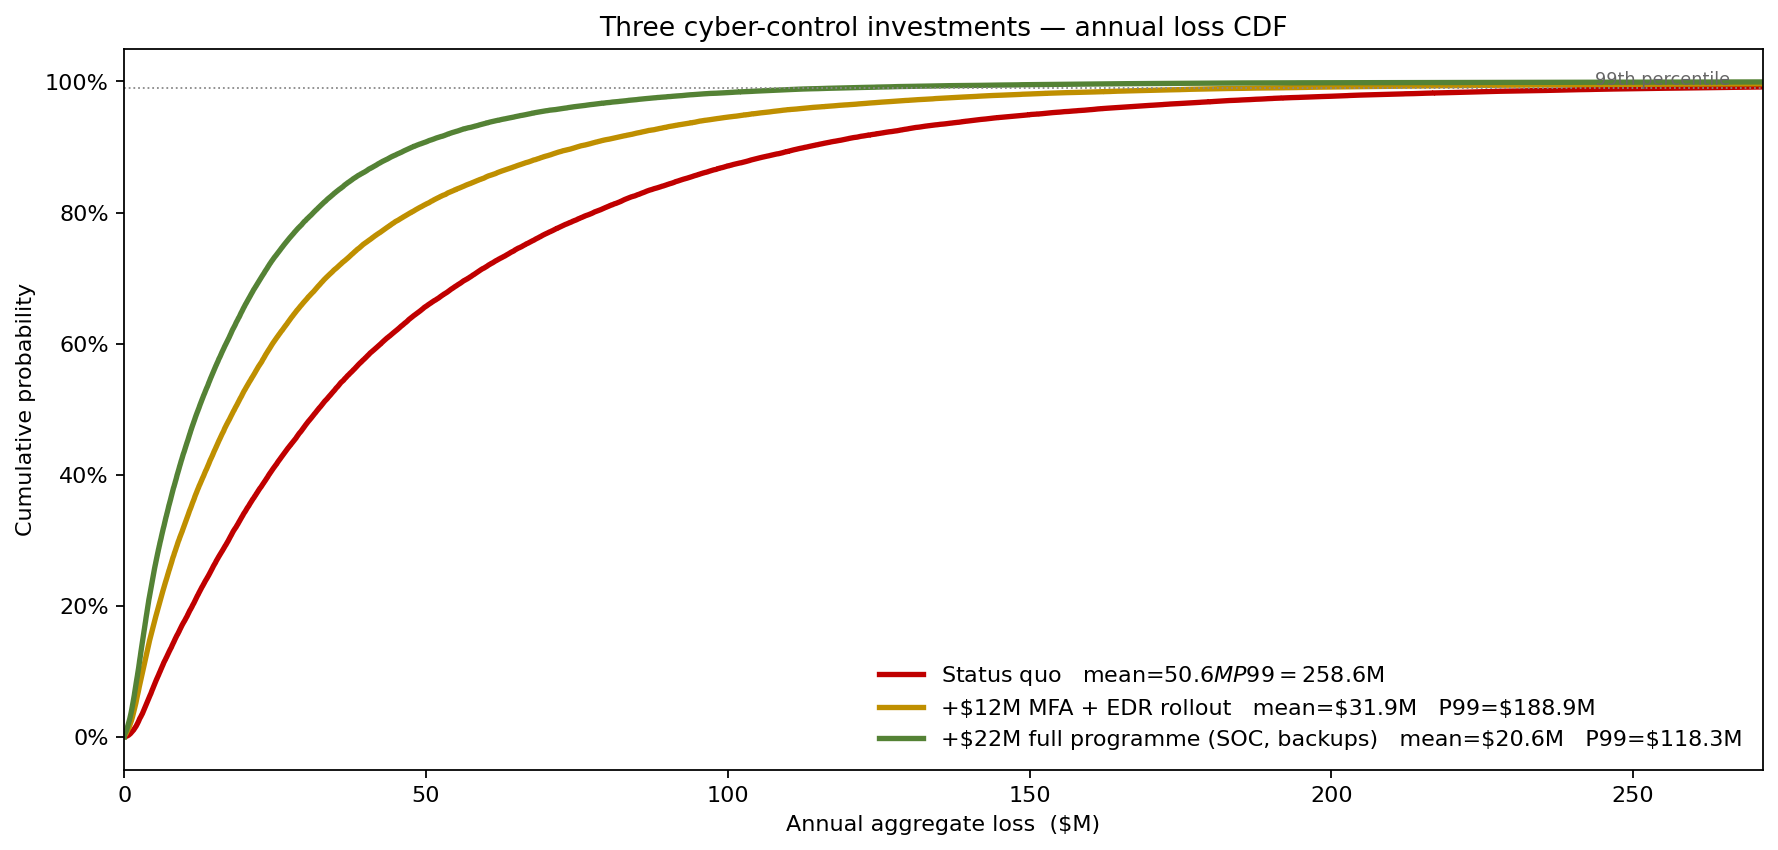
- Status quo. Mean $51M, P99 $259M.
- +$12M MFA + EDR rollout. Cuts phishing success probability 0.04% → 0.015% (factor of 2.6) and ransomware per-attempt success Beta from (2, 38) to (2, 65). Mean falls to $32M, P99 to $189M. Expected loss reduction ~$19M/yr against $12M annual spend.
- +$22M full programme. Adds 24×7 SOC, immutable backups, micro-segmentation. Ransomware success Beta to (2, 95); extreme-event probability 3% → 0.8%. Mean $21M, P99 $118M — the tail more than halved versus status quo.
The full programme costs an extra $10M/yr against the MFA+EDR baseline but reduces expected loss by another ~$11M and clips the catastrophic tail. The decision is the explicit trade between expected ROI and tail protection — exactly the trade-off a deterministic ALE number cannot frame.
Where the loss comes from
Splitting expected annual loss by source ranks the controls by what they actually defend against:
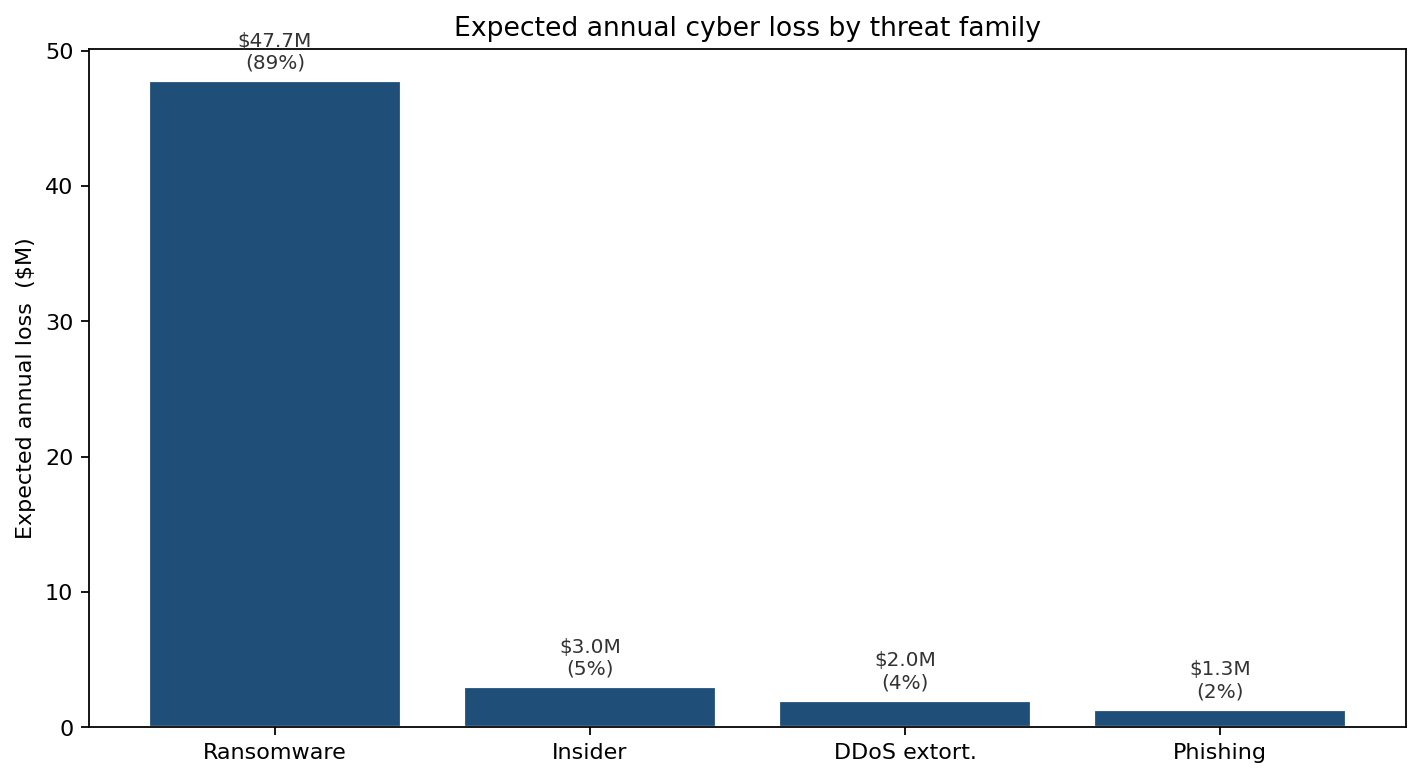
Ransomware contributes ~89% of expected loss despite being only ~34% of events — the classic low-frequency, high-severity profile, amplified here by the extreme-event GPD tail. Phishing is the opposite: many events, small per-event loss (~2% of expected loss). A security budget that allocates by event count systematically under-funds the things that actually break the year.
What changed
- Cyber insurance retention raised from $5M to $25M after the simulation showed the premium savings ($4.2M/yr) exceeded the increase in expected retained loss ($1.8M/yr), with P99 retained loss still under board-set risk appetite.
- Investment reprioritised toward ransomware-specific controls. The previous budget split was 50% phishing / 30% perimeter / 20% endpoint. Post-simulation: 25% / 20% / 55%.
- Board-level metric switched from ALE to P95 annual loss. "Expected loss" is the wrong KPI when the loss distribution is log-skewed; the tail percentile is what the regulator and the board actually need to monitor.
ModelRisk Functionality Used
- Thinned Poisson construction (attempt rate × per-attempt success probability) producing a successful-event rate — closes the rate-as-probability formulation error that distorted the legacy register.
- Beta-distributed control effectiveness for ransomware per-attempt success, fitted from internal red-team exercises and external benchmarks (Verizon DBIR control-class breakdowns).
- LogNormal severities with a Generalized Pareto extreme-event tail on ransomware — peaks-over-threshold is what separates "bad year" from "SolarWinds-class event".
- Negative Binomial frequency for insider events (over-dispersed Poisson), reflecting the HR-cycle clustering observed in the company's own incident history.
- Tornado on P99 loss, not the mean, surfacing ransomware success probability and the GPD tail parameter as the highest-leverage controls.
- Three-CDF scenario comparison against status quo, +$12M, +$22M packages, used directly in the board paper that approved the full programme.
Cyber risk is not the average year. It is the shape of the right tail, the conditional severity above the threshold, and the question of which control actually clips the tail — and Monte Carlo is what turns those three things into a single annual-loss curve a CFO and CISO can argue over with the same numbers.