

Industry: Retail
Product: ModelRisk
Application: Seasonal Promotions
A 20%-Off Weekend Has Only an 18% Chance of Adding Margin — Here Is Why
A category manager signs off a 20%-off weekend on a $50 product expecting the headline lift — roughly a 1.9x jump in units — to more than pay for the discount. Run the same event 80,000 times in ModelRisk and the picture inverts: the mean net incremental margin is -$87,000, and the probability the event is margin-accretive once the discount is netted out is just 18%. The lift is real. The margin is not.
The reason is arithmetic the spreadsheet hides. A 20% markdown on a 50%-margin item cuts unit margin from $25.00 to $15.00 — a 40% margin haircut on every promoted unit, including the baseline customers who would have paid full price anyway. To earn that back, the genuinely new units have to be both numerous and incremental. They are usually neither.
Why a single lift number is the wrong question
The deterministic plan asks "what is the lift?" and answers "1.9x." That framing quietly assumes three things that are each uncertain and, worse, correlated:
- Promo lift is right-skewed, not a point. We model it as a LogNormal multiplier (median 1.9x, the long upside tail that makes promotions tempting).
- Cannibalization / pull-forward is a bounded fraction — a Beta(3,5) on the gross incremental units — capturing the share that is merely future full-price demand dragged into the discount window. Those units cost the full $25 margin we would have earned later.
- Redemption — stock-outs, signage errors, staffing — is a Beta(20,3) near 0.87; not every intended discounted sale converts.
These are not independent. A single per-event "shopper-mood" common factor (a LogNormal, CV 18%) scales lift and cannibalization and baseline together: a hot weekend lifts traffic but also pulls more future sales forward. That shared factor is what stops the pieces averaging out to a tidy point estimate — and it is exactly the structure a deterministic model erases.
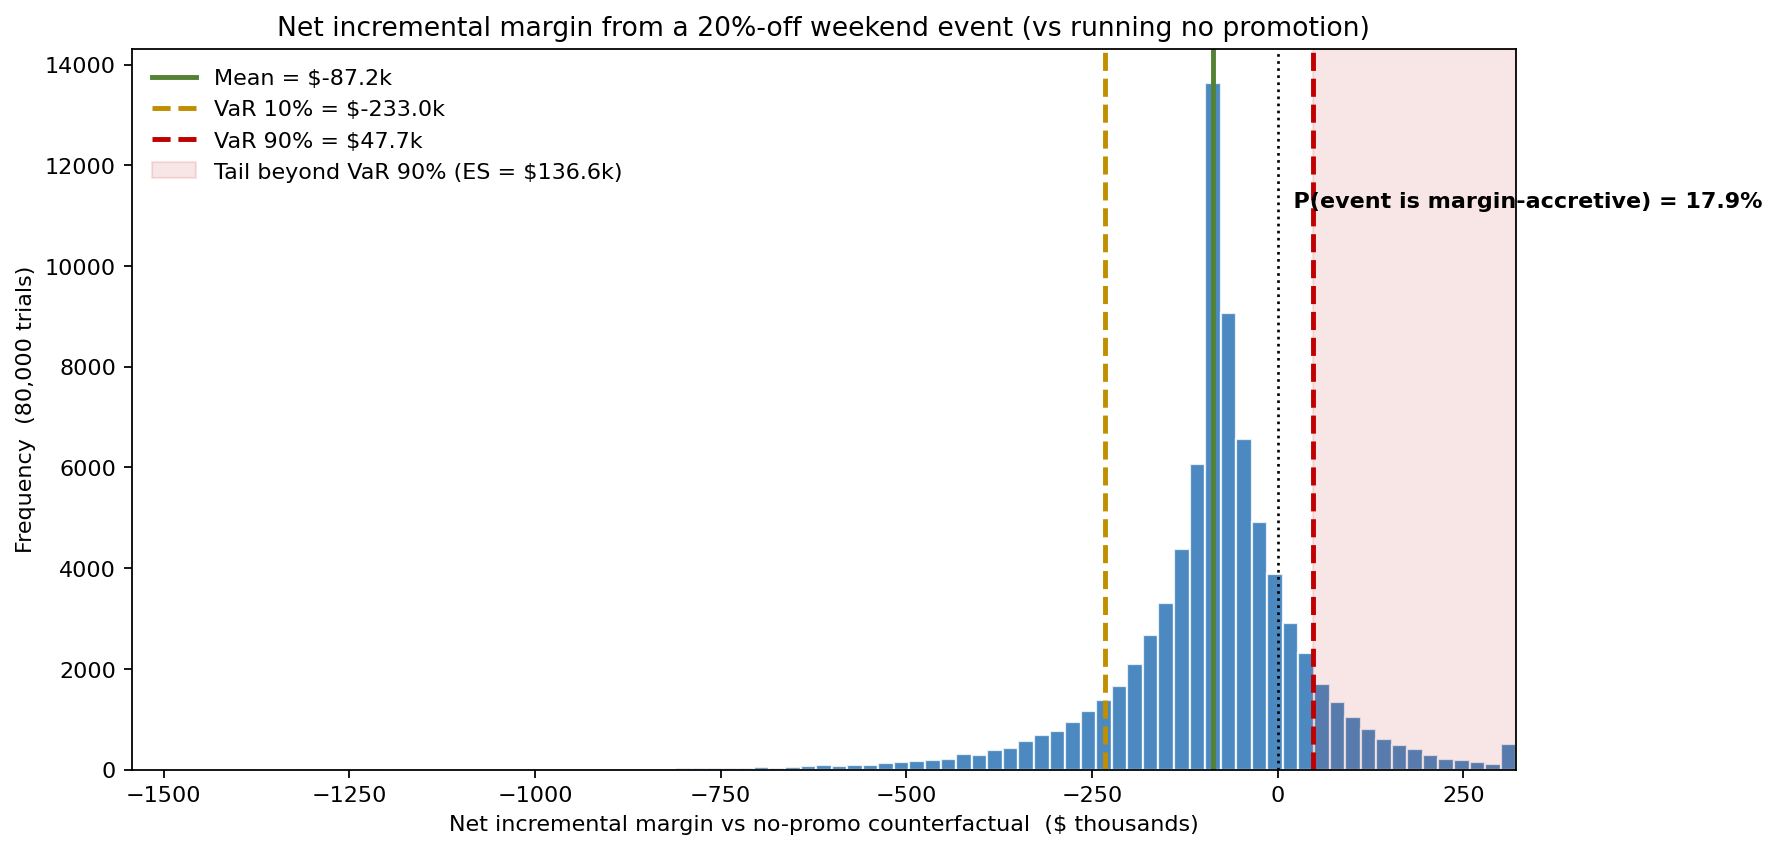
The distribution of net incremental margin runs from a P10 of -$233k to a P90 of +$48k, with a median of -$81k. The deterministic point estimate (-$81k) happens to land near the median — but it reports a single number where the real answer is "a 75% chance of losing at least $25k, and only an 18% chance of coming out ahead." The vertical zero line is the whole story: most of the mass sits to its left.
Where the lift actually goes
The headline "1.9x lift" sounds like 16,000 new units. It is not. Decomposing the gross incremental units (mean ~18,300) shows only one bucket actually carries margin.
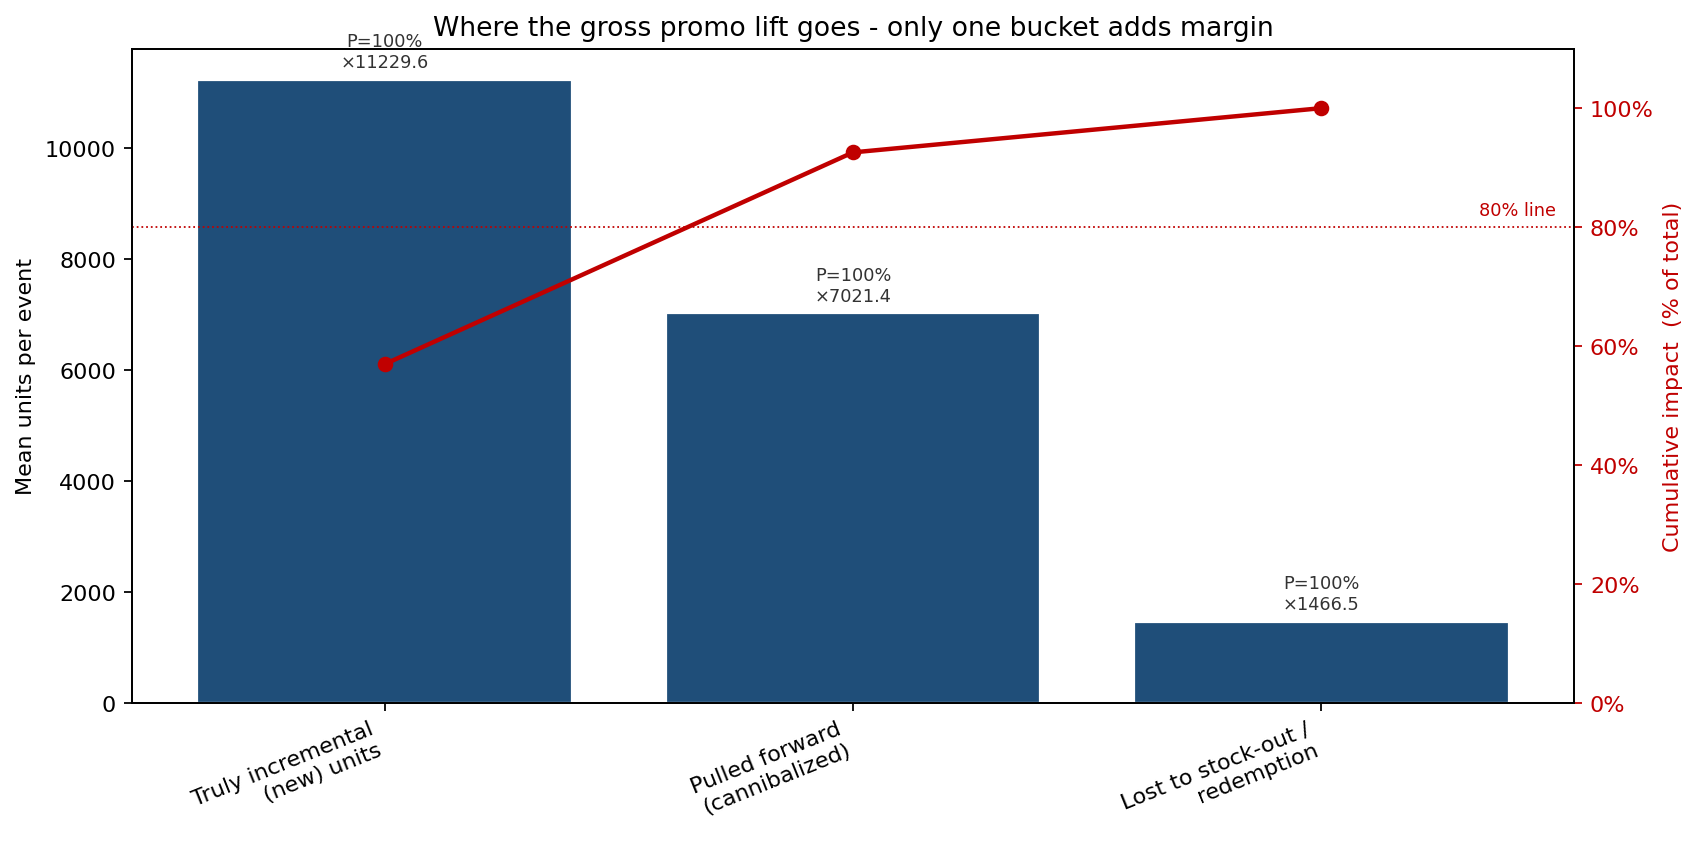
On average, 11,200 units are truly incremental, 7,000 are pulled forward from future full-price sales, and ~1,500 are lost to stock-outs and redemption friction. Meanwhile 8,100 deal-aware baseline buyers take a discount they did not need. The dollar bridge makes the trap explicit: promotion margin of $515k minus the no-promo counterfactual of $450k minus $153k of future full-price margin destroyed by pull-forward nets to -$87k. The pulled-forward units do double damage — they cost margin now and steal it from next month.
How deep is too deep?
Because lift scales sub-linearly with discount depth while the margin haircut scales linearly, deeper is almost always worse. Re-running the event across markdown depths shows where — if anywhere — the trade-off works.
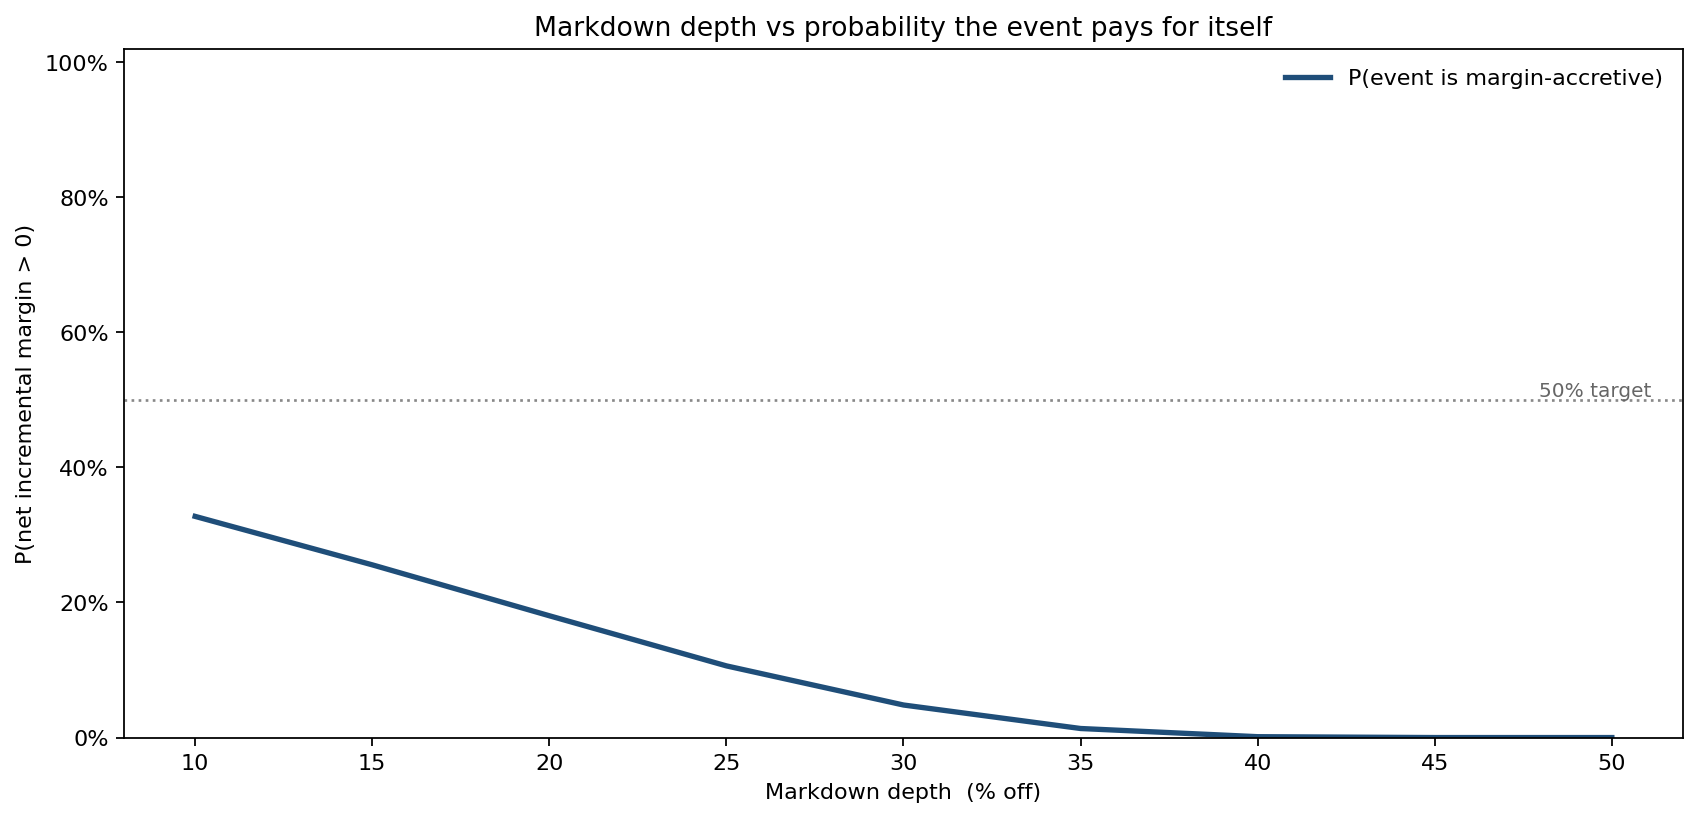
The probability the event pays for itself falls monotonically: 33% at a 10% markdown, 18% at 20%, 5% at 30%, and effectively 0% by 35%. No depth in the tested range crosses the 50% line. The best mean outcome (-$15k) is the shallowest 10% markdown — the model's verdict is "if you must run it, run it shallow, and expect to buy traffic, not margin."
What actually drives the spread
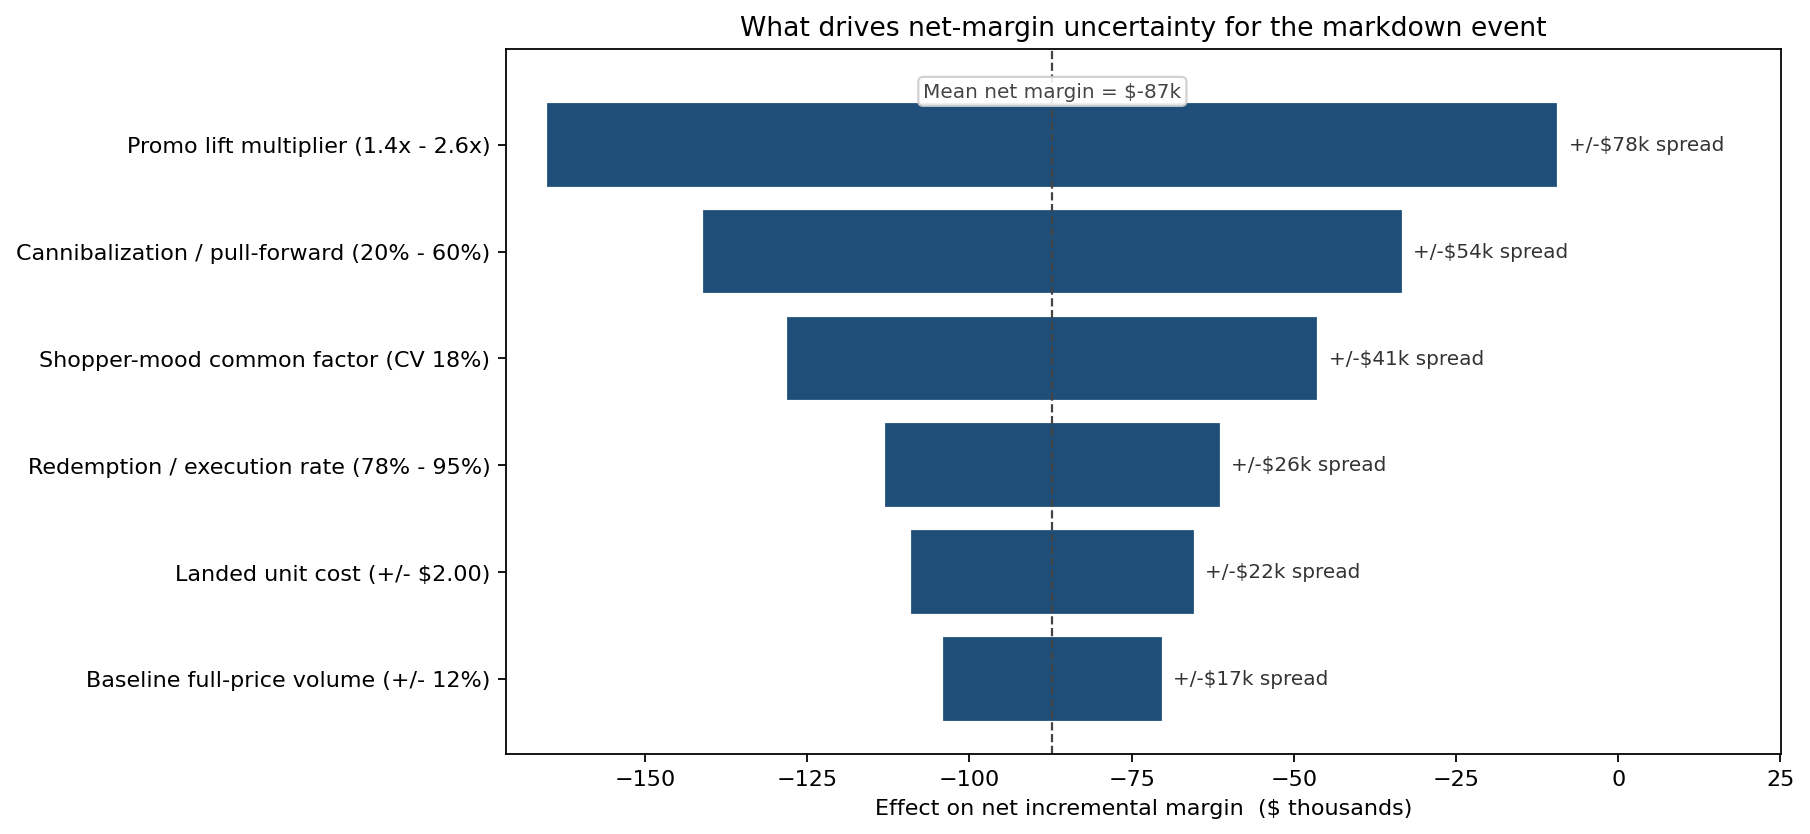
The promo-lift multiplier dominates the uncertainty budget (±$39k), but the cannibalization fraction is a close and underappreciated second (±$27k) — and unlike lift, it works entirely against you. The shopper-mood common factor ranks third precisely because it couples the others. Redemption and unit cost are minor. The practical reading: refining your estimate of how much future demand a promotion cannibalizes buys more decision quality than chasing a tighter lift forecast.
What the model changed
- Promotion calendar discipline. With P(accretive) quantified per depth, the merchandising team stopped treating "lift positive" as "promotion justified" and set a minimum-depth-for-minimum-genuine-lift rule.
- Cannibalization measurement. The tornado elevated pull-forward from a footnote to the second-largest driver, justifying a post-event holdout study to estimate it directly rather than assume it away.
- Shallower events. The depth sweep redirected several planned 30%-off events to 10–15%, where the expected margin loss is a fraction of the deep-discount version for a similar traffic bump.
ModelRisk Functionality Used
- Monte Carlo simulation over 80,000 trials to turn a single "1.9x lift" assumption into a full net-margin distribution spanning -$233k (P10) to +$48k (P90).
- LogNormal, Beta, and shared-factor modeling to represent right-skewed lift, bounded cannibalization, and a per-event shopper-mood common factor that correlates them (so the answer does not collapse to a point).
- Parameter sweep of markdown depth from 10% to 50%, showing P(accretive) falling from 33% to ~0% and never crossing 50%.
- Tornado analysis ranking lift (±$39k) above cannibalization (±$27k) and isolating the only driver — pull-forward — that moves the answer purely against the retailer.
A promotion's lift and its margin are two different questions, and the lift number answers the wrong one: the unit that walks in for the discount is rarely the unit that pays for it.