

Industry: Retail
Product: ModelRisk
Application: Sales Forecasting
The board signed off a $67.1M sales plan with a 50/50 chance of missing it
A retail chain's annual planning cycle ended where it always did: a single top-line number. The finance team rolled up next year's expected unit demand and average prices across six merchandise categories, applied the seasonal calendar, and arrived at a deterministic sales forecast of $67.1M. The board adopted that figure as the budget — the number every store target, marketing spend, and inventory commitment would be anchored to.
The Monte Carlo rebuild in ModelRisk delivered the same expected value and a far more uncomfortable message. Treating each category's demand and price as uncertain, and letting a shared consumer-spending climate move every category at once, annual sales come out with a mean of $67.1M but a standard deviation of $3.8M — a P10 of $62.4M and a P90 of $72.0M, a $9.7M spread. The budget sits dead in the middle of that range, which means the plan the board signed has a 50.3% chance of being missed. It is a coin-flip dressed up as a forecast.
Why a single sales number fails here
A point forecast hides two things that decide whether the year hits plan. The first is the macro climate: consumer spending drifts up or down over the year, and when it does it moves every category together. That shared factor is undiversifiable — it does not average out across the portfolio the way a naive sum-of-independent-categories model assumes — so it keeps the annual total genuinely wide rather than collapsing to a thin bell. The second is timing: the year is back-loaded into a November/December holiday peak, so most of the uncertainty about whether the plan is met is not resolved until the final two months. A single number reported in January says nothing about either. The honest forecast is not a figure; it is a widening cone with a probability attached to the budget line.
The year-end gap is wide: the cumulative-revenue fan
Building revenue month by month, the forecast is a cone that opens as the year runs:
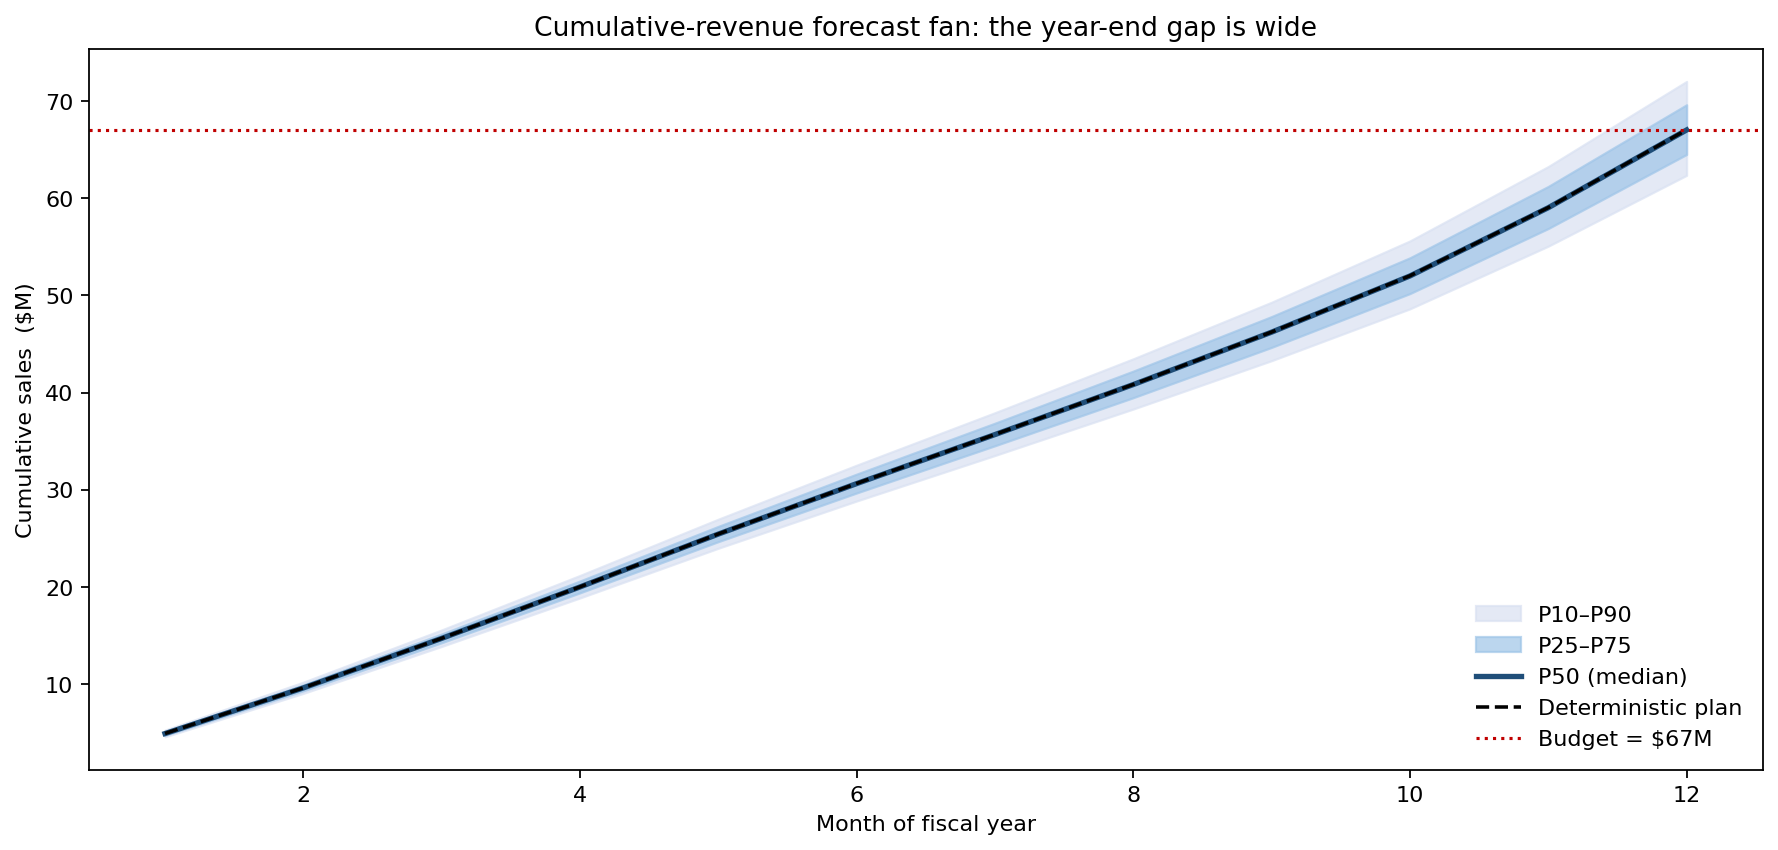
The P50 median path tracks the deterministic plan almost exactly — by design, the point forecast is the central case. But the P10-P90 band widens steadily: by June the cumulative spread is roughly $28.8M to $32.5M, and by December it has opened to a year-end P10 of $62.4M and P90 of $72.0M — a $9.7M gap, 14% of the median. The budget line at $67.1M is reached by the median path only in the final month, and the fan straddles it: a soft macro climate keeps the cumulative path in the lower half of the cone all year. The visual point is that the budget is not a floor the business comfortably clears — it runs straight through the centre of the year-end uncertainty.
A 50/50 plan: the annual sales distribution
Collapsing the year-end of the fan into a distribution makes the odds explicit:
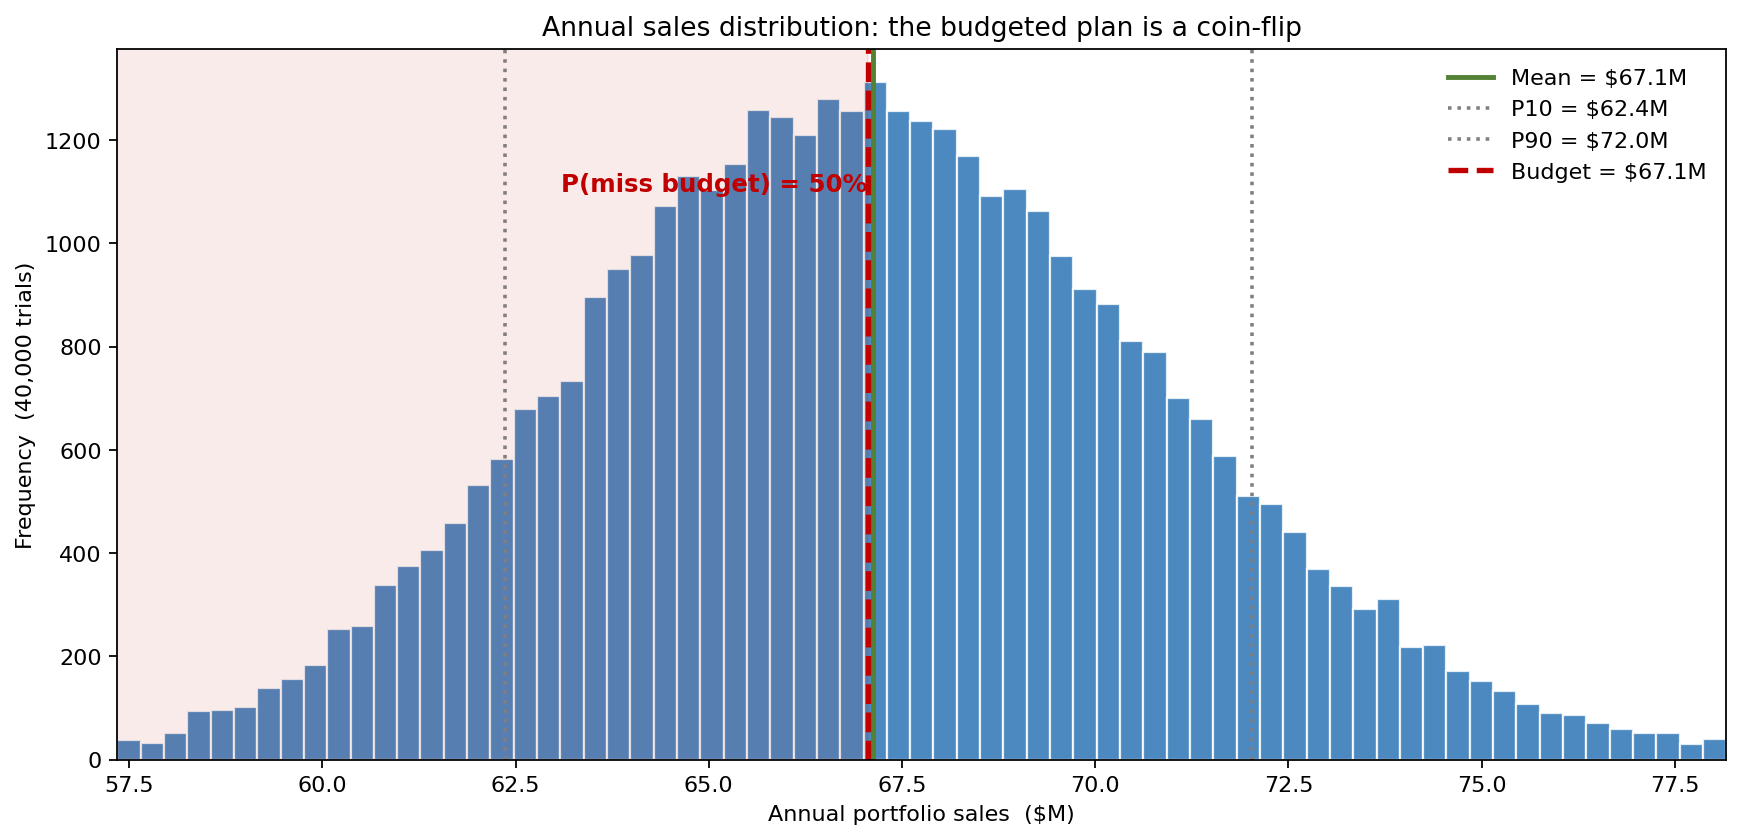
Annual sales have a mean of $67.1M, a P10 of $62.4M and a P90 of $72.0M. The budget of $67.1M — the deterministic point forecast the board adopted — sits essentially on the mean, so the probability of missing the budget is 50.3%. That is the number the point estimate could never show: the plan is not "we expect $67.1M and should comfortably hit it," it is "we expect $67.1M and have a coin-flip chance of falling short." A finance team that knows the miss probability is 50% manages it very differently from one that believes the budget is a forecast — it sets contingency, phases discretionary spend behind the holiday read, and stops treating a 49% shortfall as a failure of execution.
Why the shared macro factor matters
The most consequential modelling choice is whether the categories move independently or share a common climate:
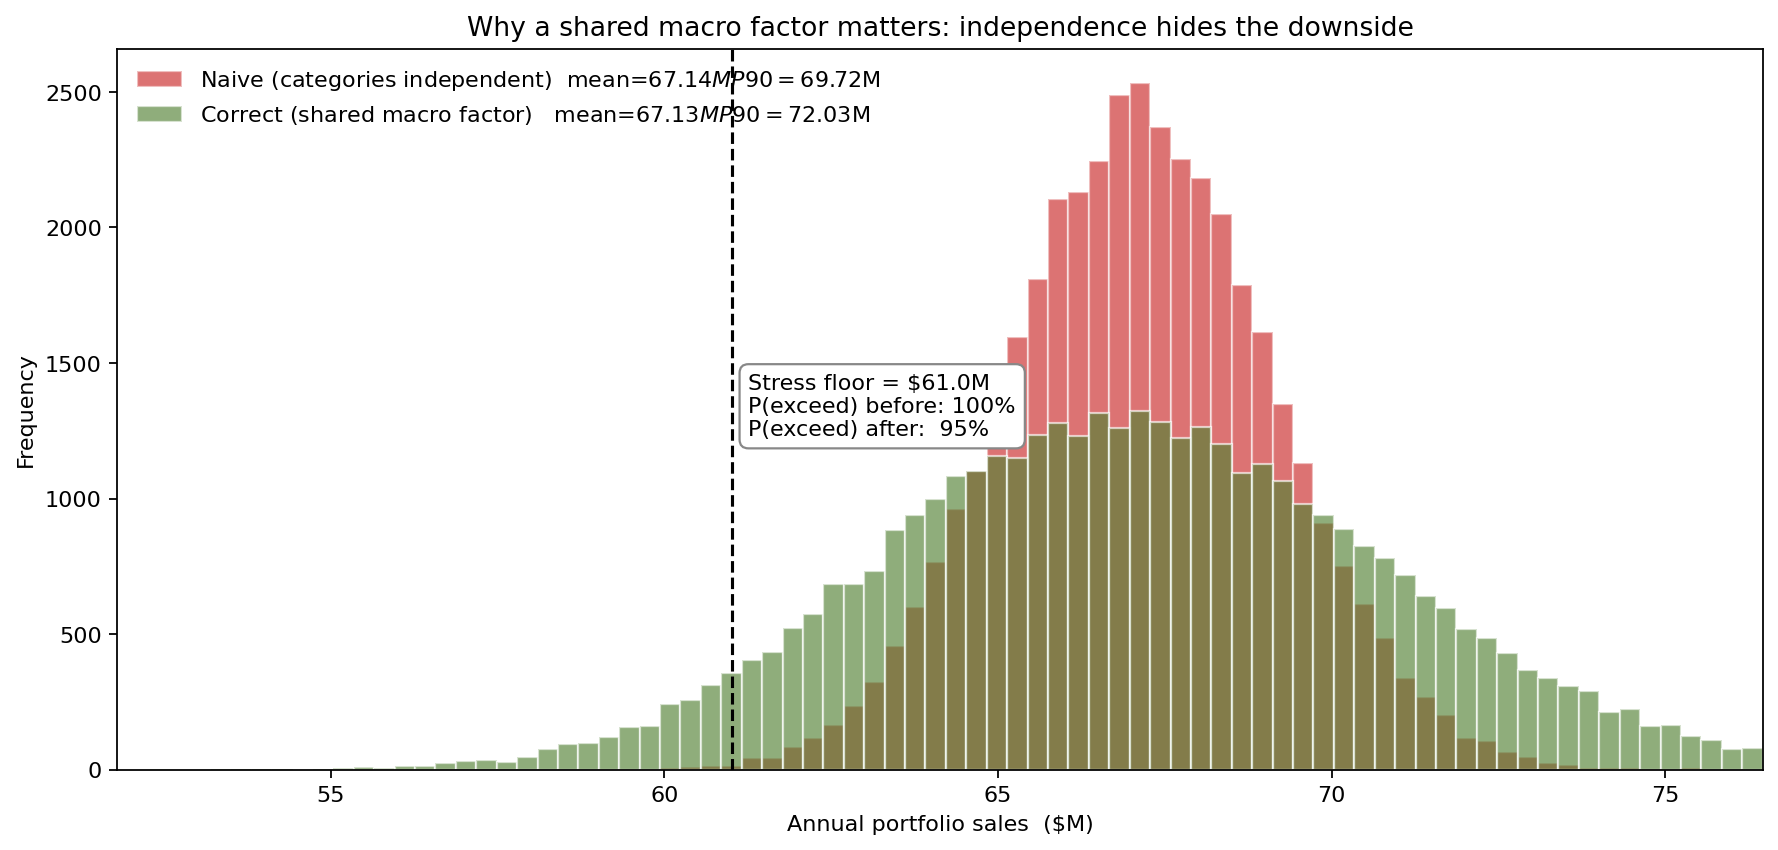
Modelling the six categories as independent — the implicit assumption behind summing category forecasts — produces a deceptively tidy distribution: same $67.1M mean but a standard deviation of only $2.0M, a P10 of $64.6M. The correct shared-macro model has the same mean but a $3.8M standard deviation — 1.9 times wider — and a P10 of $62.4M. The difference is the tail. Against a $61.0M stress floor the business must clear to cover fixed costs, the naive independent model reports a 0.1% chance of breaching it — effectively never. The shared-macro model reports 4.8%, nearly fifty times higher. Independence does not just understate the spread; it hides the downside scenario that actually threatens the business, because in the real world a bad year is bad across all categories at once.
What swings the answer
A tornado over the inputs ranks where the $9.7M of annual uncertainty comes from:
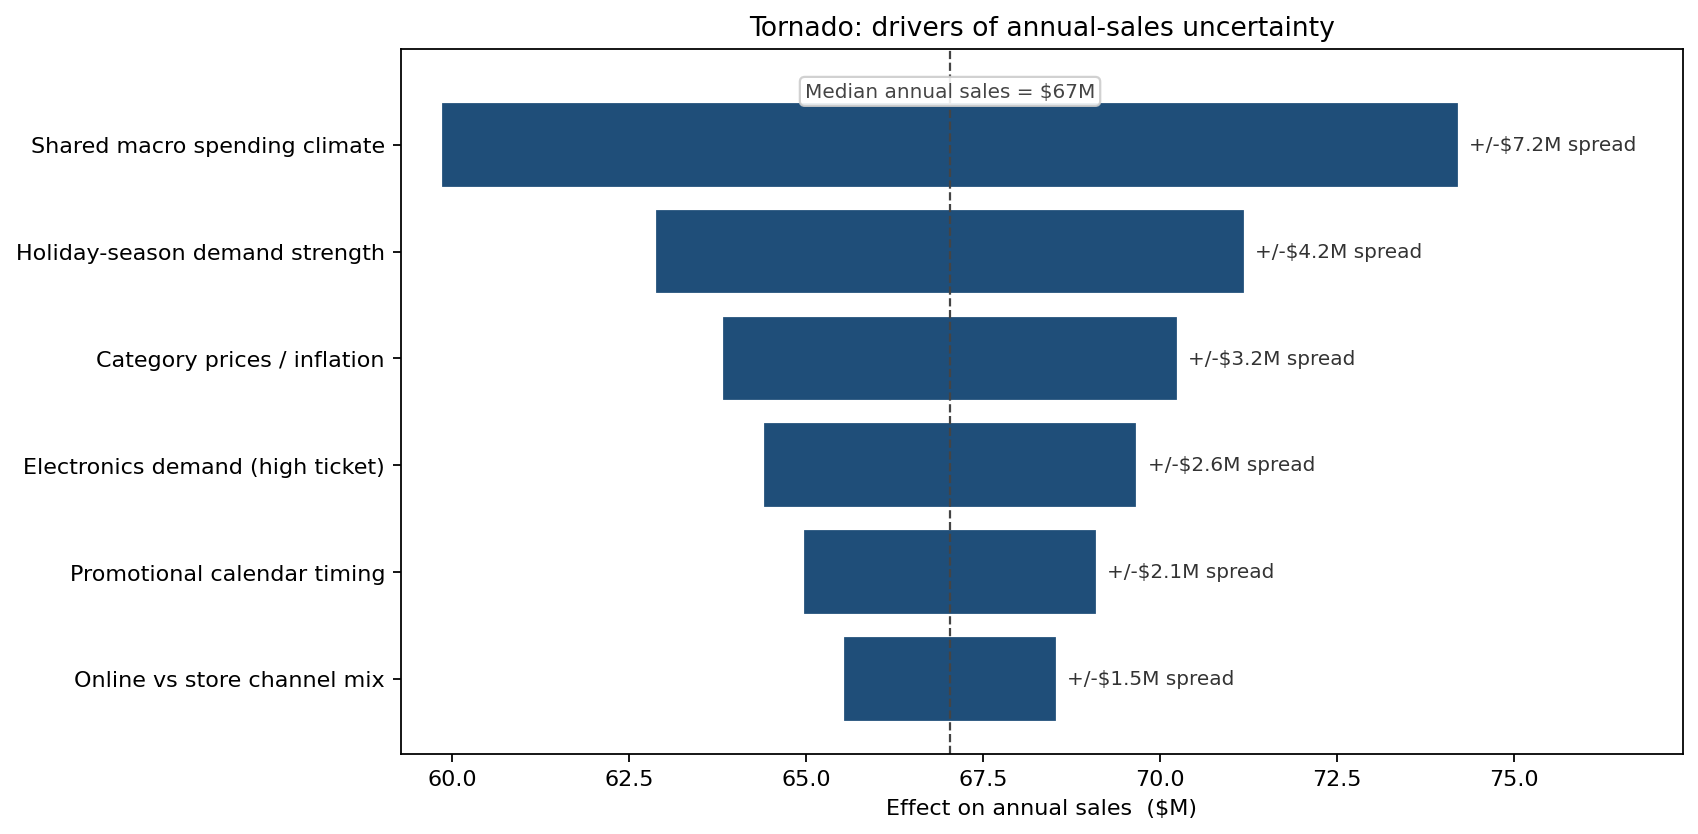
The shared macro spending climate dominates, with a ±$3.6M half-spread on annual sales — confirming that the single biggest driver of whether the plan is met is the economy, not any category-level lever. Holiday-season demand strength is second at ±$2.1M, then category prices/inflation at ±$1.6M and electronics demand (the high-ticket category) at ±$1.3M; promotional timing (±$1.0M) and channel mix (±$0.8M) are smaller. The ranking tells planners that the budget's risk is mostly exogenous: the value of a better consumer-confidence read exceeds anything to be gained from fine-tuning the promotional calendar.
What the model changed
- The budget stopped being reported as a single number and started carrying a probability: the $67.1M plan was relabelled a P50, with the explicit 50.3% miss probability stated alongside it.
- A $61.0M stress floor was added to the plan, with its breach probability (4.8%, not the 0.1% the independent model implied) used to size the contingency reserve.
- Discretionary spend was phased behind the holiday read, after the fan showed most of the year's uncertainty resolves only in November and December.
- Category forecasts were rolled up through a shared macro factor rather than summed independently, after the comparison showed independence understated the standard deviation by nearly half and the tail breach probability by a factor of fifty.
ModelRisk Functionality Used
- Shared macro random-walk factor multiplying all six categories each month (monthly sd 2.2%, ~7.6% annual drift), so the portfolio total stays genuinely wide instead of collapsing to a thin central-limit bell.
- Per-category demand and price uncertainty — LogNormal idiosyncratic monthly demand and truncated-Normal prices (6% of list, floored above zero) — layered on top of the shared factor so both common and category-specific risk are represented.
- Cumulative-path fan chart of monthly revenue with P10/P50/P90 bands against the deterministic plan and budget, exposing that the year-end gap is $9.7M and that most uncertainty resolves in the holiday peak.
- Budget-miss probability read directly off the annual distribution at the $67.1M plan, returning the 50.3% coin-flip the point forecast concealed.
- Independent-versus-shared comparison quantifying that a shared factor widens the standard deviation 1.9x and lifts the stress-floor breach probability from 0.1% to 4.8%.
- One-at-a-time tornado ranking the macro climate, holiday strength, prices, and electronics demand by their effect on annual sales, locating the budget's risk in the exogenous economy.
Sales forecasting is not "what is the single number we expect next year" — it is "what is the distribution of next year's sales, and what is the probability the plan we just signed actually holds." The deterministic roll-up answered the first question and quietly committed the board to a 50/50 bet; ModelRisk priced the bet, found the downside the independent model had erased, and turned a budget into a forecast with odds attached.