

Industry: Retail
Product: ModelRisk
Application: Customer segmentation and profit-concentration analysis under uncertainty
The Top Customer Segment Carries 46% of Profit on Average — But a 50% Majority Only 28% of the Time.
A retail chain's segmentation deck reported a reassuring concentration figure: feed average segment sizes and average spend into the model, and the single most valuable customer tier — the VIPs — accounts for 37% of total profit. Management read that as a stable, known dependency and built the customer strategy around protecting that one tier.
Profit concentration is not a fixed percentage; it is the outcome of two things the business does not know precisely — how many customers actually fall into each tier, and how much each tier really spends in a given year — both of which are skewed and correlated. Carry that uncertainty through and the picture is both more concentrated and far less certain than the deck implied: the top segment carries 45.6% of profit on average (well above the 37% point estimate), with a median of 44%, a P90 of 58.7%, and a P10 of 35.1%. The probability that the top segment crosses an outright 50% of profit is 28.3% — common enough to plan for, far from the certainty a single number suggests.
Segment sizes and spend are both distributions, and both are skewed
We model a one-million-customer base split across five value tiers — VIP, High, Mid, Occasional, Dormant. The mix is uncertain: the share of customers in each tier is drawn from a Dirichlet distribution (mean shares roughly 3% / 8% / 24% / 33% / 29%, bottom-heavy as real retail bases are), with one draw per trial acting as a shared market-mix factor across the whole base. Per-customer annual profit is heavy-tailed and tier-specific — a LogNormal with a tier median (about $1,400 for VIPs down to near $2 for Dormant) and a tier-specific spread, with a shared per-tier spend shock each trial so a strong year lifts a whole tier together rather than averaging out.
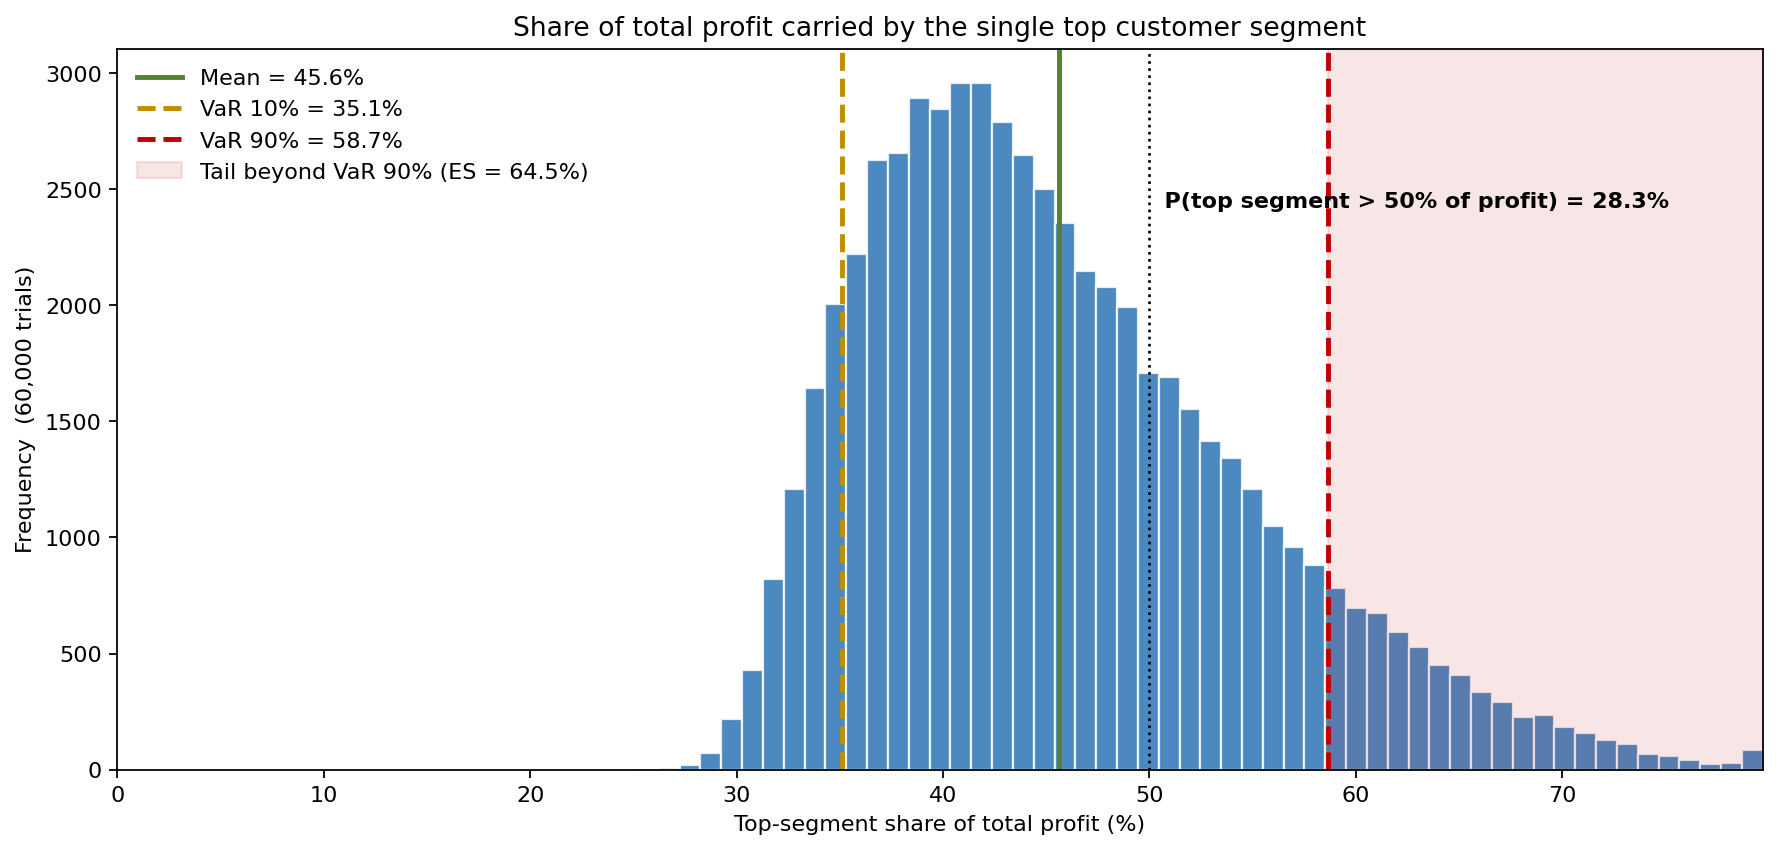
The headline output — the share of total profit carried by whichever segment is largest in each trial — has a mean of 45.6%, a median of 44.0%, a P10 of 35.1% and a P90 of 58.7%. The VIP tier is the top segment in 48% of trials, but not always: in over half of trials another tier (usually High) overtakes it on profit, because a thin, high-variance VIP slice can be outweighed by a fatter High tier in a soft VIP year. The deterministic point estimate of 37.2% sits below even the P10 of the real distribution — the averaged model materially understates how concentrated profit actually is.
Why an averaged concentration number misleads
The point estimate lands low for a structural reason: it multiplies average segment size by average spend, which throws away the skew in both. When the few high-value customers are heavy-tailed in spend, the realistic top-segment share is pulled upward and widened — the very tail behaviour that justifies a VIP strategy in the first place. An averaged 37% both understates the dependency and hides its variance, so it cannot answer the only questions that matter for resourcing: how concentrated is profit really, and how confident can we be in that concentration?
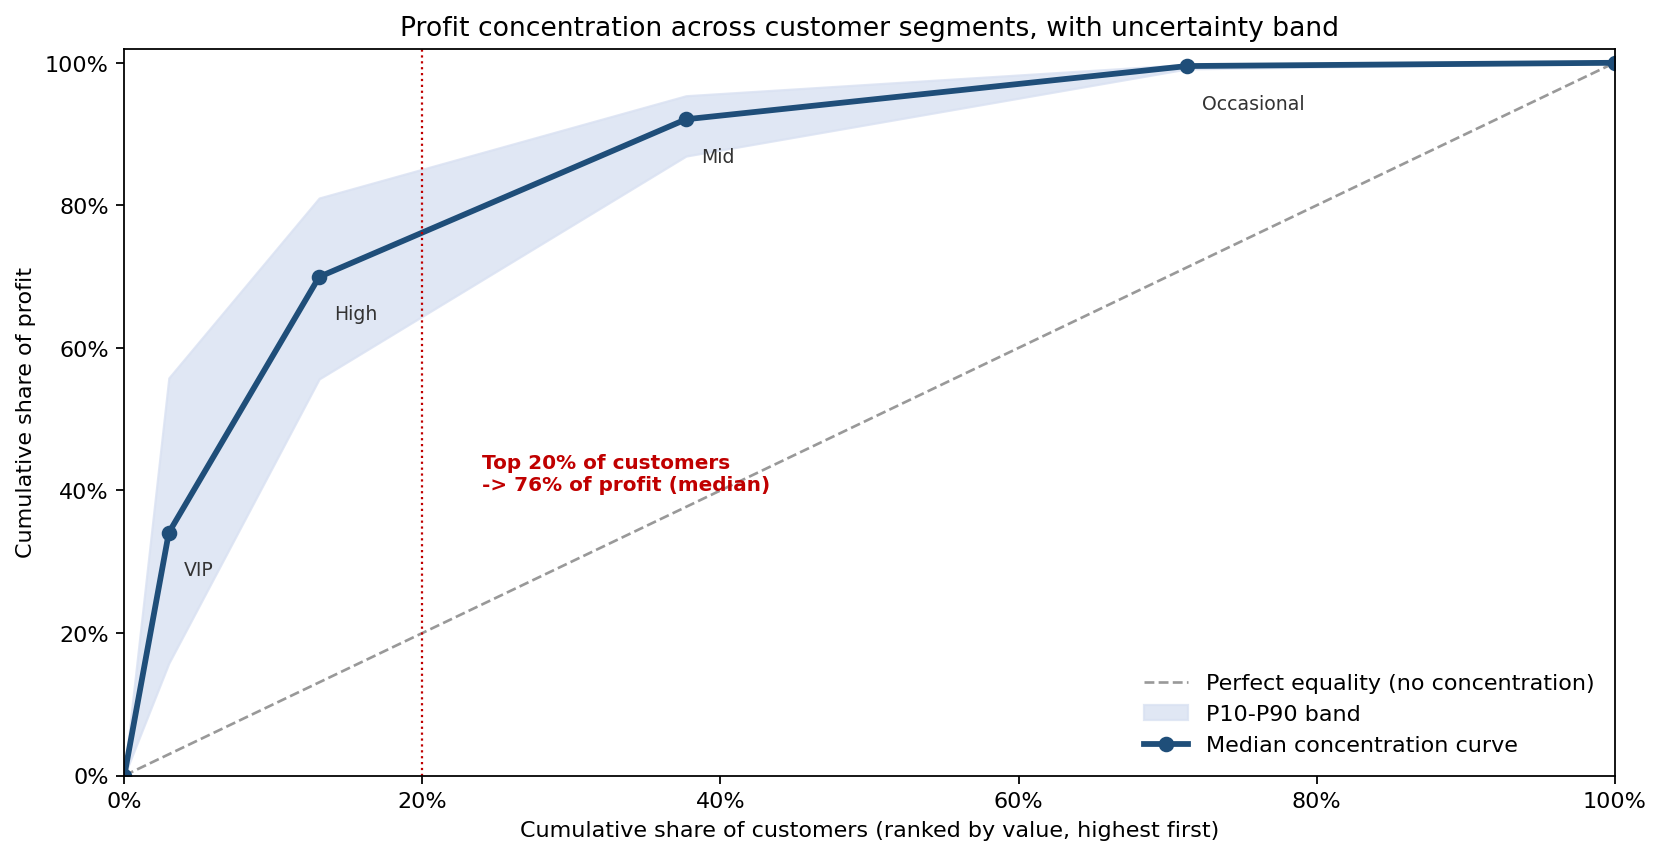
The concentration (Lorenz) curve answers both. Ranking customers from most to least valuable, the top 20% of customers earn a median 76% of profit — a textbook 80/20 — but the P10 to P90 band runs from 67% to 83%, so the concentration is itself uncertain. Reading the tier breakpoints: the VIP tier (3% of customers) carries a median 34% of profit; VIP plus High (13% of customers) carries 70%; and through Mid (38% of customers) the model reaches 92% of profit. The shaded band around the curve is the part a single Pareto line cannot show — and it is wide enough to change how much the business should bet on any one tier.
Where the profit actually sits, and how much it moves
Concentration in share terms still leaves the absolute dollars uncertain, so the model also reports profit by segment with its full spread.
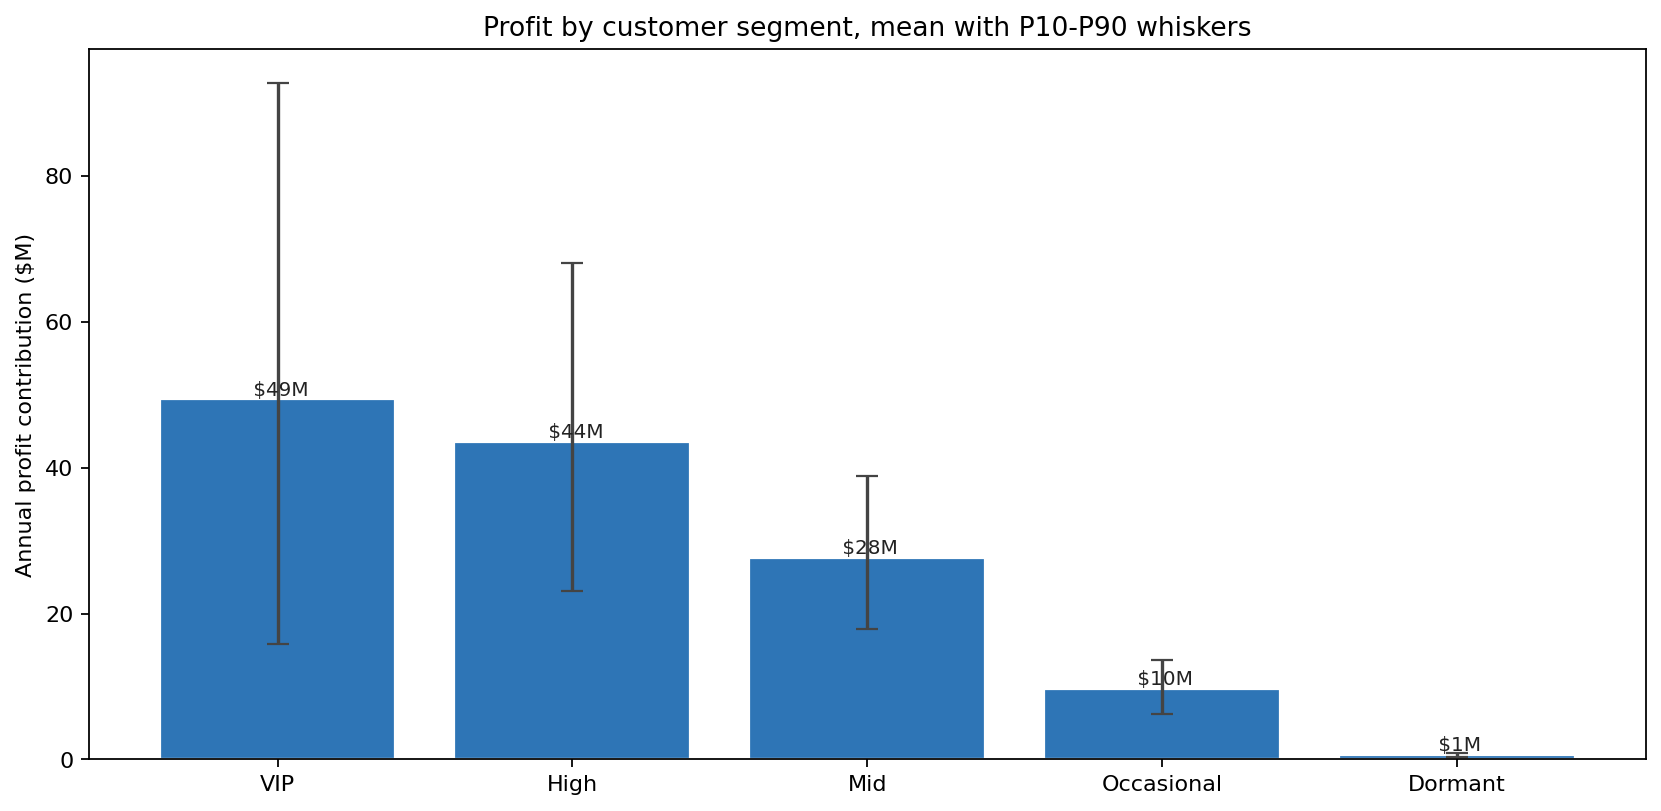
The VIP tier contributes a mean of $49.3M a year but with a P10 of $15.8M and a P90 of $92.7M — a near six-fold range that reflects its small size and heavy-tailed spend. The High tier is steadier at a mean of $43.5M (P10 $23.1M, P90 $68.0M), Mid contributes $27.7M, Occasional $9.7M, and Dormant a negligible $0.6M. Total annual profit averages $131M (P10 $89M, P90 $179M). The contrast between VIP and High is the strategic point: VIP is the larger contributor on average but the volatile one; High is nearly as large and far more dependable. A strategy that treats "top segment" as a single safe bet is leaning on the noisiest line in the portfolio.
What drives the concentration
The tornado ranks which uncertain input the top segment's profit share is most sensitive to.
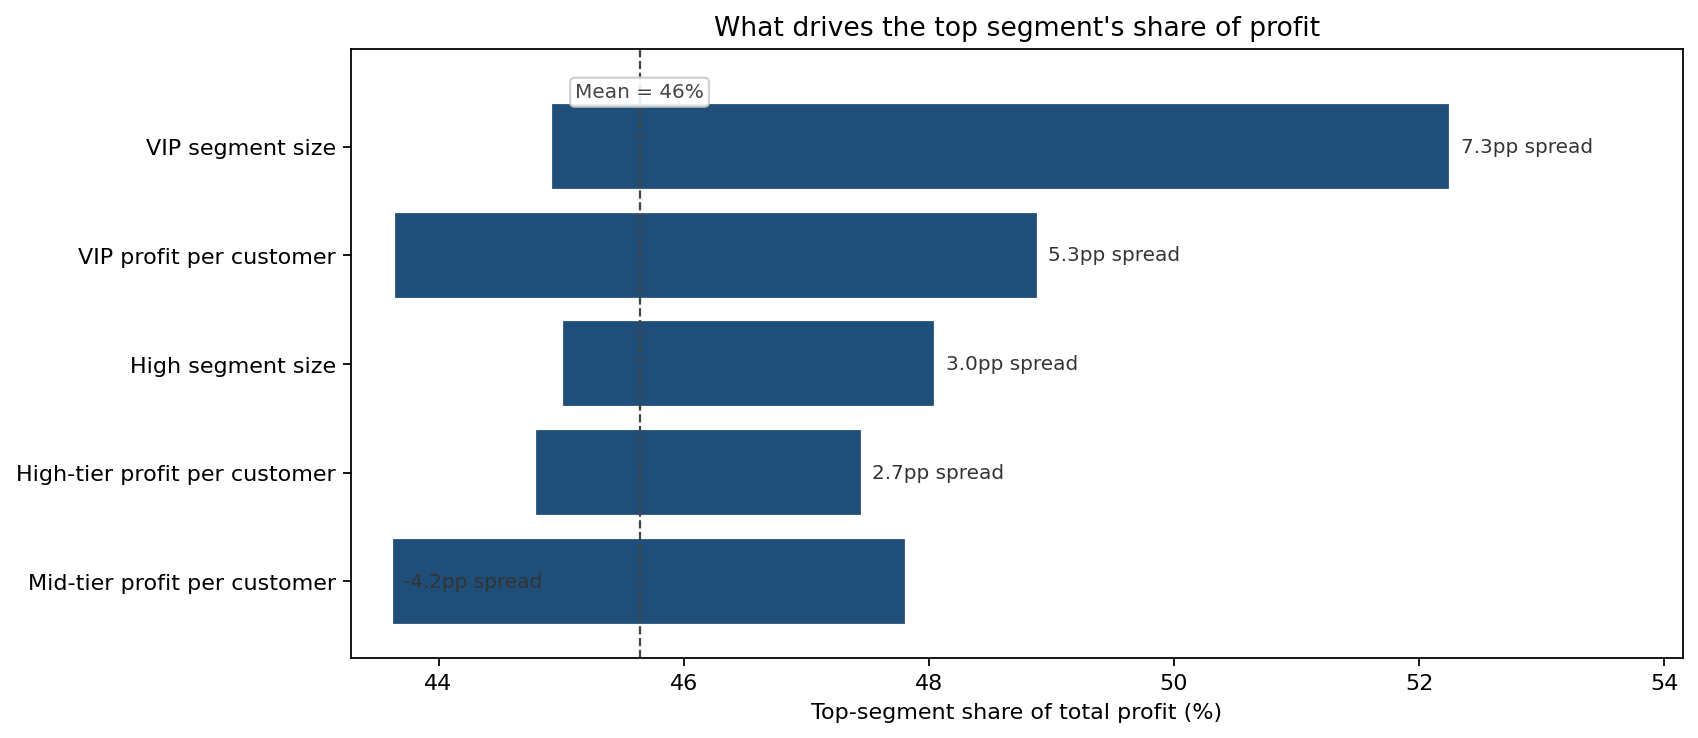
VIP segment size is the dominant driver, swinging the top-segment share across a 7.3pp range (44.9% to 52.3%) between its P10 and P90 — how many VIPs there actually are matters more than how much any one of them spends. VIP profit per customer is next at 5.3pp, followed by Mid-tier profit per customer (4.2pp), High segment size (3.0pp) and High-tier profit per customer (2.7pp). The implication for measurement is direct: tightening the count of genuine VIPs — the classification problem — reduces uncertainty in the concentration estimate more than refining any single tier's spend assumption.
What the model changed
The chain stopped treating profit concentration as a known constant and started treating it as a distribution to be managed:
- Concentration stated with a band. Reporting moved from "VIPs are 37% of profit" to "the top segment carries 46% of profit on average, 35% to 59% across plausible years, with a 28% chance of crossing a majority" — sizing the dependency honestly.
- VIP volatility recognised. Because the top tier's contribution ranges from $16M to $93M, contingency planning stopped assuming a steady VIP base and accounted for the soft-VIP years.
- High tier reframed as the anchor. The steadier $43.5M High tier was repositioned as the dependable core of profit, not an afterthought behind the VIPs.
- Measurement effort aimed at VIP classification. With VIP segment size the dominant driver of uncertainty, data and modelling effort shifted to correctly counting VIPs rather than re-estimating their average spend.
ModelRisk functionality used
- Monte Carlo simulation of profit across five tiers over a one-million-customer base, 60,000 trials, combining uncertain mix and heavy-tailed spend.
- Dirichlet segment-size modelling — one mix draw per trial as a shared market-mix factor, keeping tier shares a valid simplex while carrying their joint uncertainty.
- Heavy-tailed LogNormal spend per tier with a shared per-tier spend shock, reproducing the skew that drives real value concentration.
- Concentration / Lorenz output with uncertainty band — top 20% of customers earn a median 76% of profit (67%–83% P10–P90), the figure resourcing decisions hang on.
- Tornado sensitivity ranking the inputs and isolating VIP segment size (7.3pp swing) as the dominant source of concentration uncertainty.
Monte Carlo turns customer segmentation from "what share does the top tier hold?" into "how concentrated is profit, how uncertain is that concentration, and which tier is the dependable anchor?" — and on this base the averaged 37% hid a top segment that runs hotter, swings harder, and is carried by a VIP count nobody had pinned down.