

Industry: Retail
Product: ModelRisk
Application: Customer loyalty program performance evaluation under uncertainty
The Loyalty Program Had a +26% Expected Return. It Also Had a 50/50 Chance of Losing Money.
A retail chain ran its loyalty program past the standard business case and got a comfortable answer: plug in the average retention lift, the average margin per member, and the average reward cost, discount the cash flows, and the program returns +26%. On a 50,000-member cohort that is a mean net value of roughly $683,000 a year — a clear "go." The finance committee was ready to sign.
The problem is that a loyalty program does not earn its average. It earns whatever retention lift it actually delivers this year, against whatever reward redemptions members actually claim, in whatever kind of trading year the macro environment hands the business. Carry those three things as distributions instead of averages and the same program shows a very different face: a mean return of +26%, but only a 49.5% probability of being ROI-positive at all, a 10th-percentile return of -69%, and a median return of -1%. The expected value says yes; the coin-toss underneath it says "this is a bet, price it like one."
Retention is a survival curve, not a percentage
The single biggest driver of a loyalty member's value is how long they stay, and "retention" is not one number — it is a survival process. With an annual retention probability r, a member's tenure follows a geometric law: each year they remain active with probability r and lapse with probability 1 − r, so expected lifetime is 1/(1 − r) and the distribution of lifetimes has a long right tail of loyal members who stay for a decade.
We model baseline annual retention as a Beta distribution centred on 68%, and the program's effect as an uncertain retention lift of 0 to 16 percentage points (mode near 7pp, also Beta). Annual gross margin per active member is a right-skewed Gamma (mean about $120); annual reward/redemption cost is a LogNormal (mean about $11) that captures uncertain breakage and redemption timing. Discounted lifetime value is accumulated over the member's survival curve at a 10% discount rate. Crucially, a single macro "trading-year quality" factor is drawn per simulation and shared across the whole cohort, so a soft year drags retention and margin down together rather than averaging out.
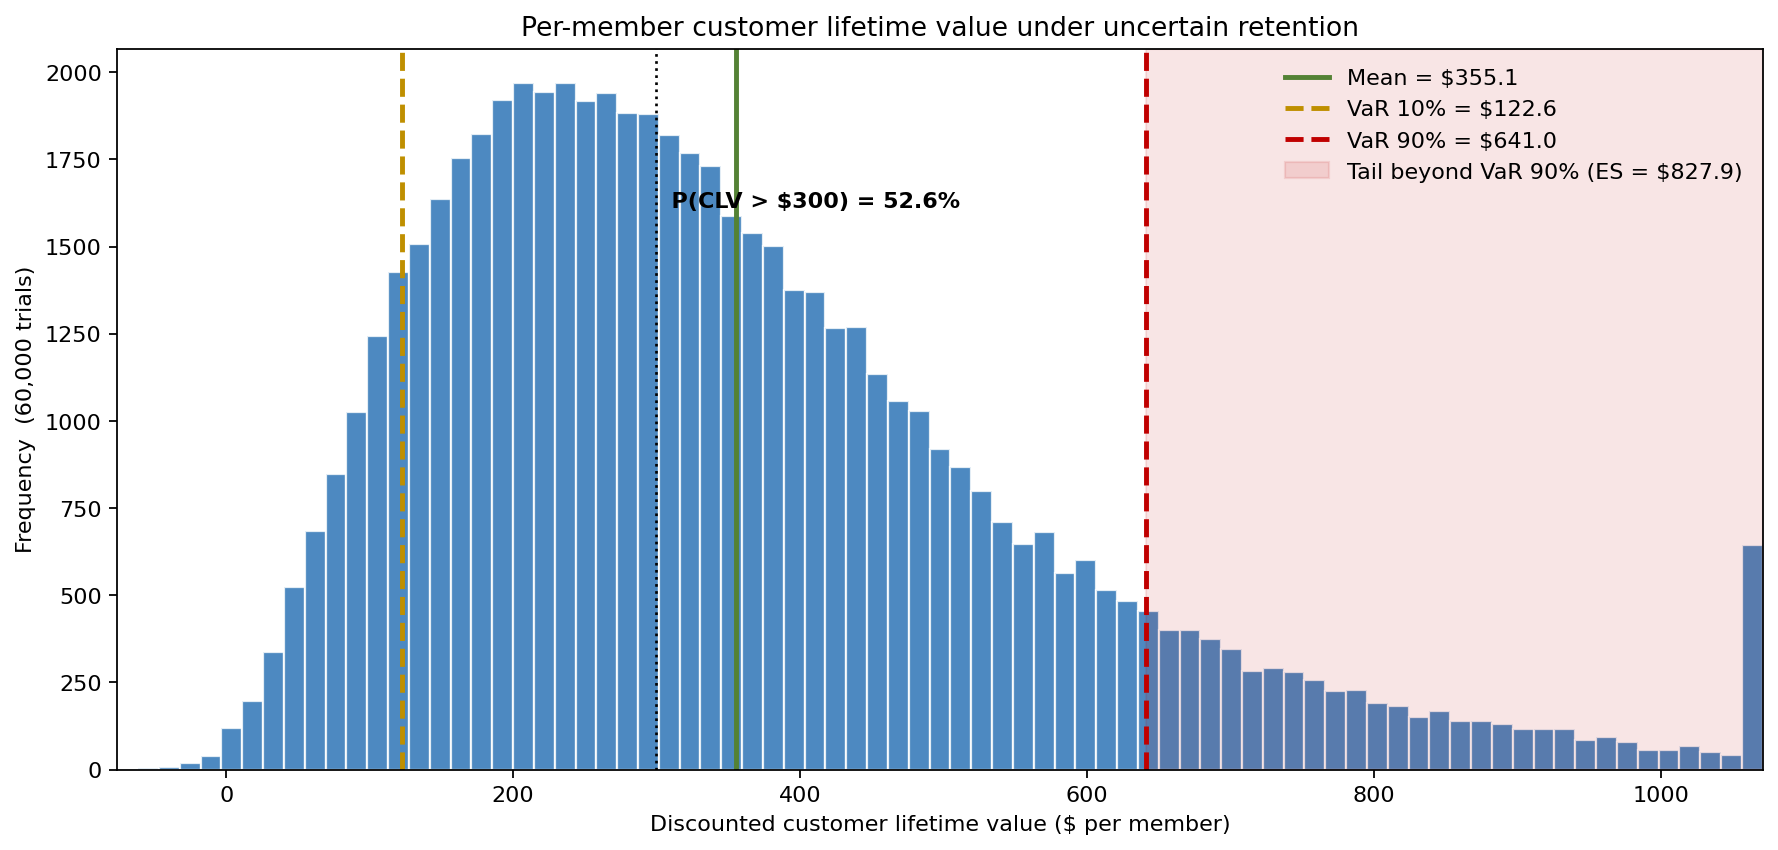
The resulting per-member CLV distribution has a mean of $355, a median of $313, a P10 of $123 and a P90 of $641 — a spread of more than five-to-one across otherwise identical members, driven entirely by how long they survive and what kind of years they live through. A little over half of members, 52.6%, clear $300 of lifetime value; the rest do not. The deterministic point estimate built from mean inputs lands at $341, close to the mean but blind to the entire left tail where members lapse early and never repay their acquisition and reward costs.
Why the average ROI is the wrong number to decide on
The deterministic case returns +26% because it quietly assumes the program always lands its average retention lift and members always behave at their average. Reality is multiplicative and skewed: a weak retention lift in a soft trading year, paired with members who redeem aggressively, produces a deeply negative return, and there is nothing on the upside that is equally extreme to balance it within a single member's economics.
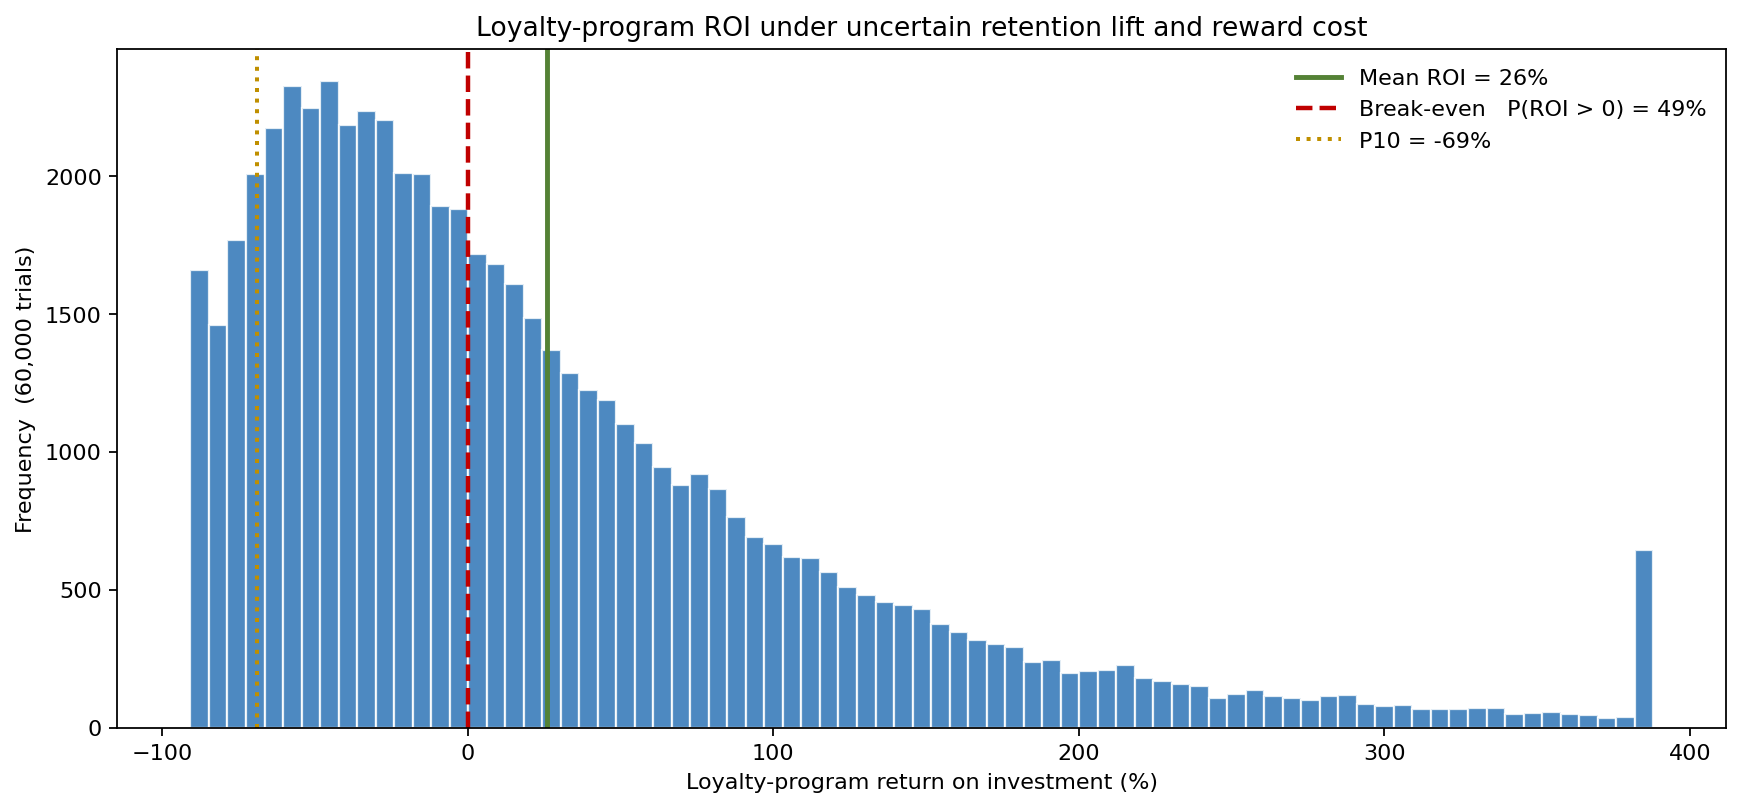
The simulated ROI distribution makes the gap explicit. The mean is +26% and the P90 reaches +153%, but the probability of any positive return is just 49.5%, the median is -1%, and the P10 sits at -69%. A program approved on its +26% mean is, in plain terms, a near-even bet with a fat downside — exactly the kind of decision a point estimate is structurally incapable of flagging, because the mean of a right-skewed distribution sits well above its median.
How much retention lift the program actually has to buy
If the program is a bet, the natural question is what it would take to make it a good one. Sweeping the assumed retention lift from 0 to 16 percentage points and re-running the full simulation at each value turns the vague "it should help" into a hurdle rate.
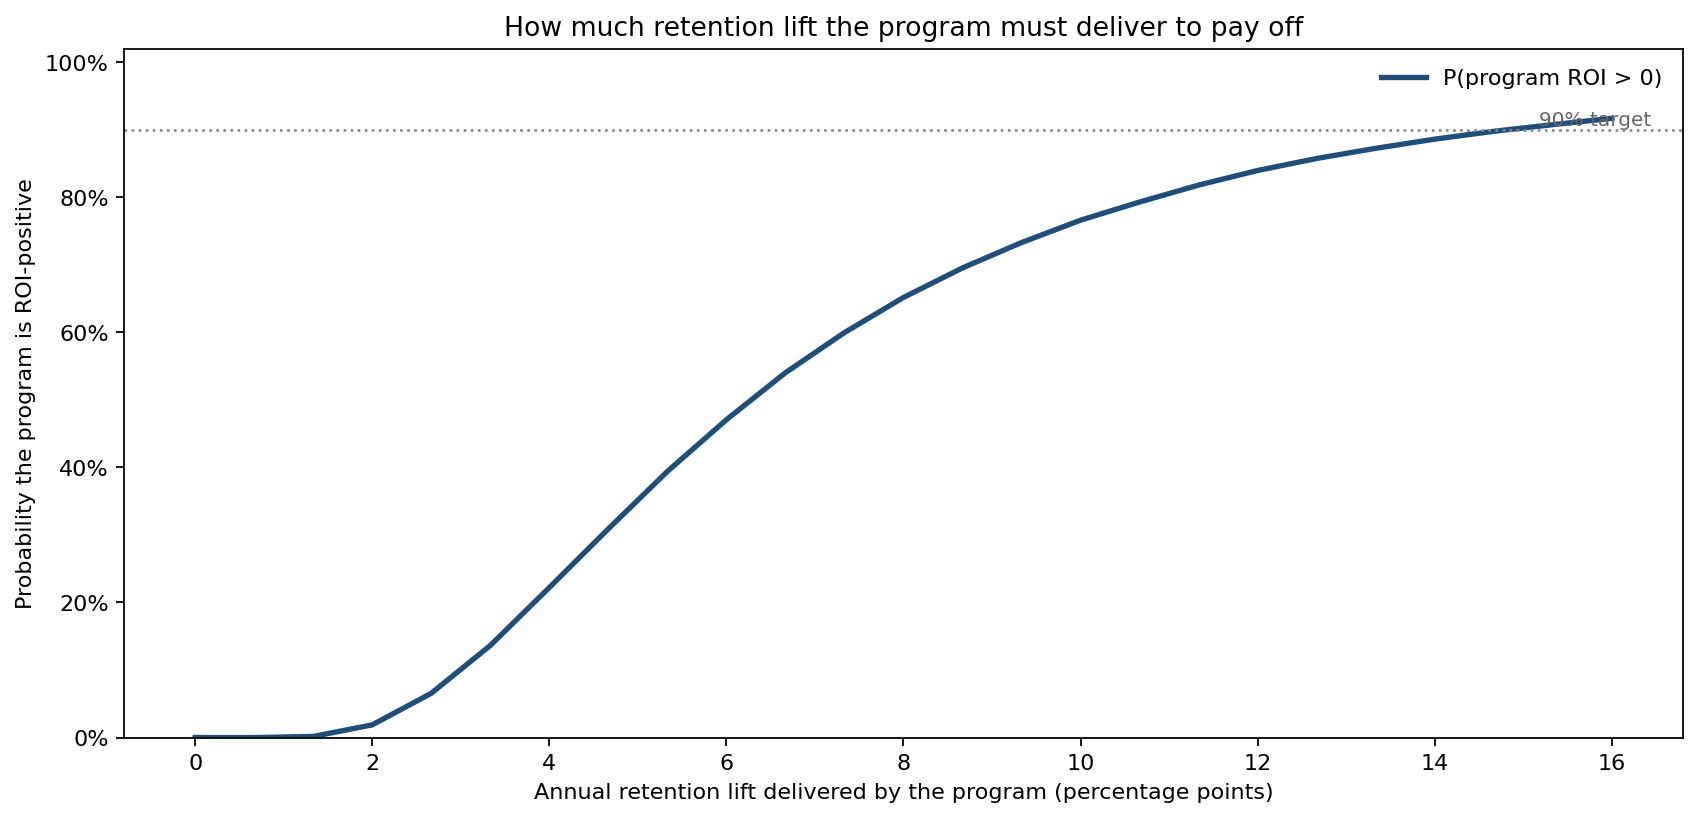
At a 5pp lift the program is ROI-positive only 31% of the time (mean ROI -14%); at 10pp that rises to 77% (mean ROI +84%); at 15pp it reaches 90% (mean ROI +168%). The break-even point — where the program is more likely than not to pay off — is a retention lift of 6.3 percentage points, and reaching 90% confidence requires 14.8 percentage points. That single curve reframes the design conversation: the question is no longer "is the program good?" but "can we credibly move retention by at least 6 to 7 points, and what would it take to push toward 15?"
What actually moves the number
With five uncertain inputs, the tornado ranks which ones the net program value per member is most sensitive to.
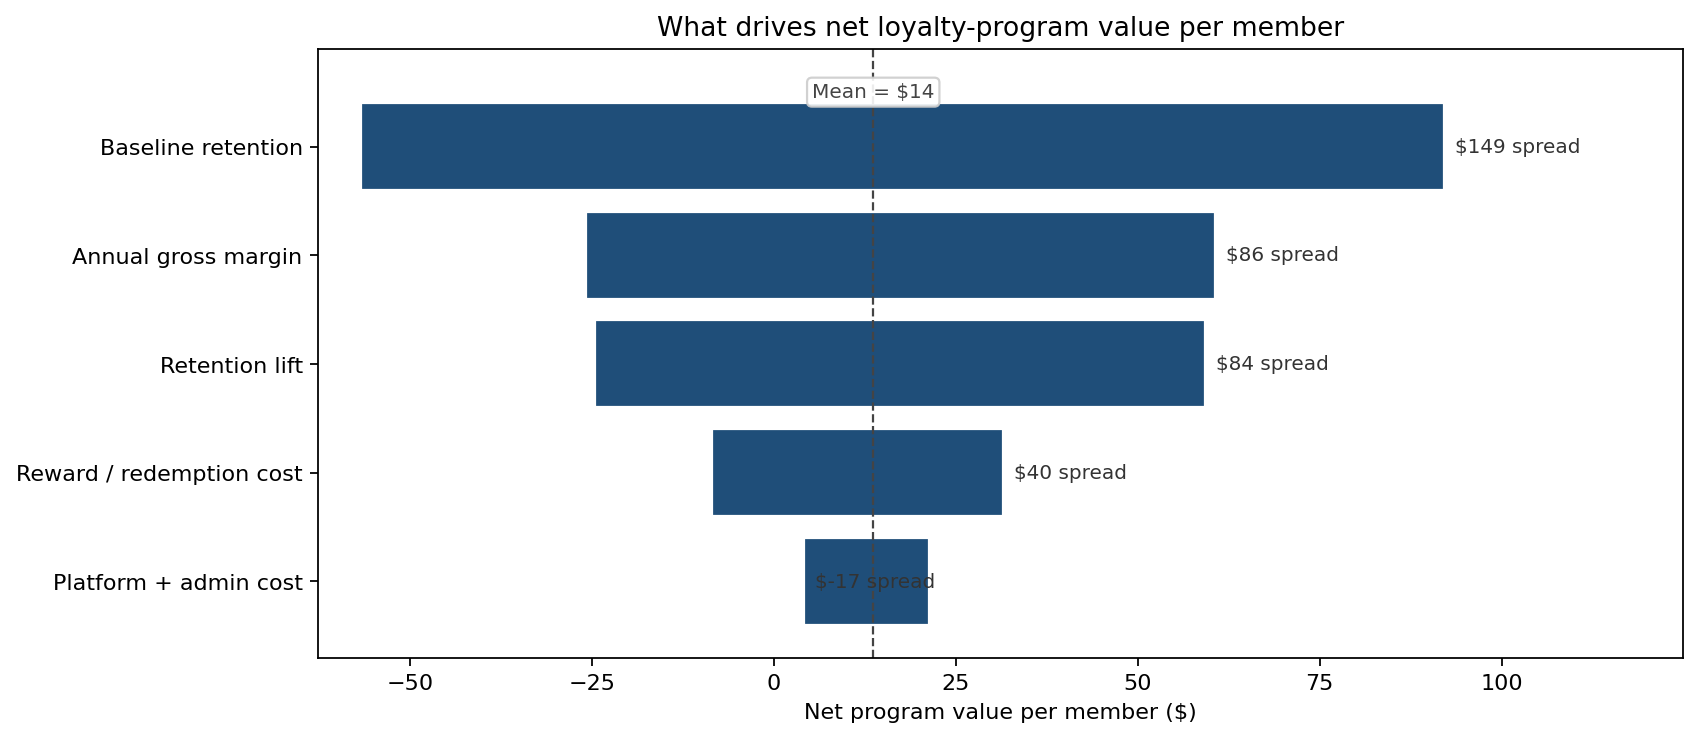
Baseline retention dominates, swinging net value per member across a $149 range (from -$57 to +$92) as it moves from its P10 to its P90 — because a member who would have stayed anyway makes the program's incremental claim much harder. Annual gross margin is next at a $87 spread, then the retention lift itself at $84, then reward/redemption cost at $40 and platform/admin cost at $17. The practical implication: the program's fate is decided less by how generous the rewards are than by who is enrolled. Recruiting members from genuinely at-risk, lower-baseline-retention segments is worth more than tuning the reward table.
What the model changed
The chain stopped treating the loyalty program as a single approved number and started managing it as a distribution:
- Approval threshold set on probability, not mean. Programs now have to clear a stated probability of positive ROI, not just a positive expected value — closing the trap of greenlighting +26%-mean bets that lose money half the time.
- A retention-lift hurdle. The 6.3pp break-even and 14.8pp 90%-confidence points became explicit design targets, tested against what marketing could credibly move per segment.
- Targeting reframed. Because baseline retention is the dominant driver, enrolment effort shifted toward lower-baseline-retention segments where the incremental lift is real, rather than rewarding already-loyal members who would have stayed.
- Reward generosity de-prioritised. With reward cost a minor driver versus retention and margin, the debate over point-accrual rates was sized correctly rather than dominating the design.
ModelRisk functionality used
- Monte Carlo simulation of per-member CLV over a geometric survival curve, propagating Beta retention, Gamma margin and LogNormal reward cost across 60,000 trials.
- Shared common-factor modelling — one macro trading-year shock per trial moving the whole cohort's retention and margin together, so portfolio value does not collapse to a deterministic average.
- Probability-of-target output — P(ROI > 0) = 49.5% and P(CLV > $300) = 52.6%, the figures the committee actually decides on.
- Parameter sweep of retention lift, locating the 6.3pp break-even and 14.8pp 90%-confidence hurdle.
- Tornado sensitivity ranking five drivers and isolating baseline retention ($149 swing) as the one that decides the program.
Monte Carlo turns loyalty-program evaluation from "what is the expected return?" into "what is the chance this program makes money, and what retention lift do we have to buy to tilt the odds?" — and on this cohort the honest answer was a 50/50 bet that only good targeting could win.