

Industry: Real Estate
Product: ModelRisk
Application: Urban Planning and Infrastructure Development Under Uncertainty
A district zoned to last 15 years has a 88% chance of running out of capacity first — and the median breach is year 9
A growing district was zoned around a single steady-growth line: 42,000 residents compounding at 2.6% a year, reaching build-out at the plan's target year 15. Schools, the water plant and the transit line were each sized to that build-out. On the deterministic path, the first service to fill up — the water plant — was not reached until year 11, comfortably inside the horizon. The Monte Carlo, run on the same central growth assumption but with the year-to-year variation that growth actually has, told a different story: an 88% chance that some service is over capacity before year 15, with a median first breach in year 9 and a P10 as early as year 6. The deterministic plan was not optimistic about how much the district would grow — it was silent about when the growth would arrive relative to fixed capacity.
ModelRisk was used to turn "the district reaches build-out at year 15" into "the distribution of the year capacity first runs out, and which service binds first."
Why a single growth line fails
Growth compounds. Fifteen annual growth rates do not arrive as fifteen independent coin-flips that average out to the plan's 2.6% — they cluster. A regional jobs boom, a housing-market surge or a downturn persists for several years, so a few fast years early in the horizon pull the whole population path up and stay there. A single deterministic line throws that persistence away, and with it the chance that capacity is breached years ahead of schedule.
The model captured the persistence with a shared regional-economy macro factor following an AR(1) process (year-on-year persistence 0.70), so good and bad years cluster instead of scattering. That one factor also drives all three service demands together — schools, water and transit are pulled up by the same boom — which is why they tend to breach in the same window rather than independently. The model confirmed this: the school and water first-breach years are positively correlated (rank correlation 0.43), as are school and transit (0.32), and the year-5 population explains much of the year-15 population (correlation 0.66). Every annual growth rate stayed above -5%, so no population path ever went backwards implausibly.
When does capacity run out?
The lead chart is the distribution of the first year any zoned service is exceeded, across the trials where a breach happens at all.
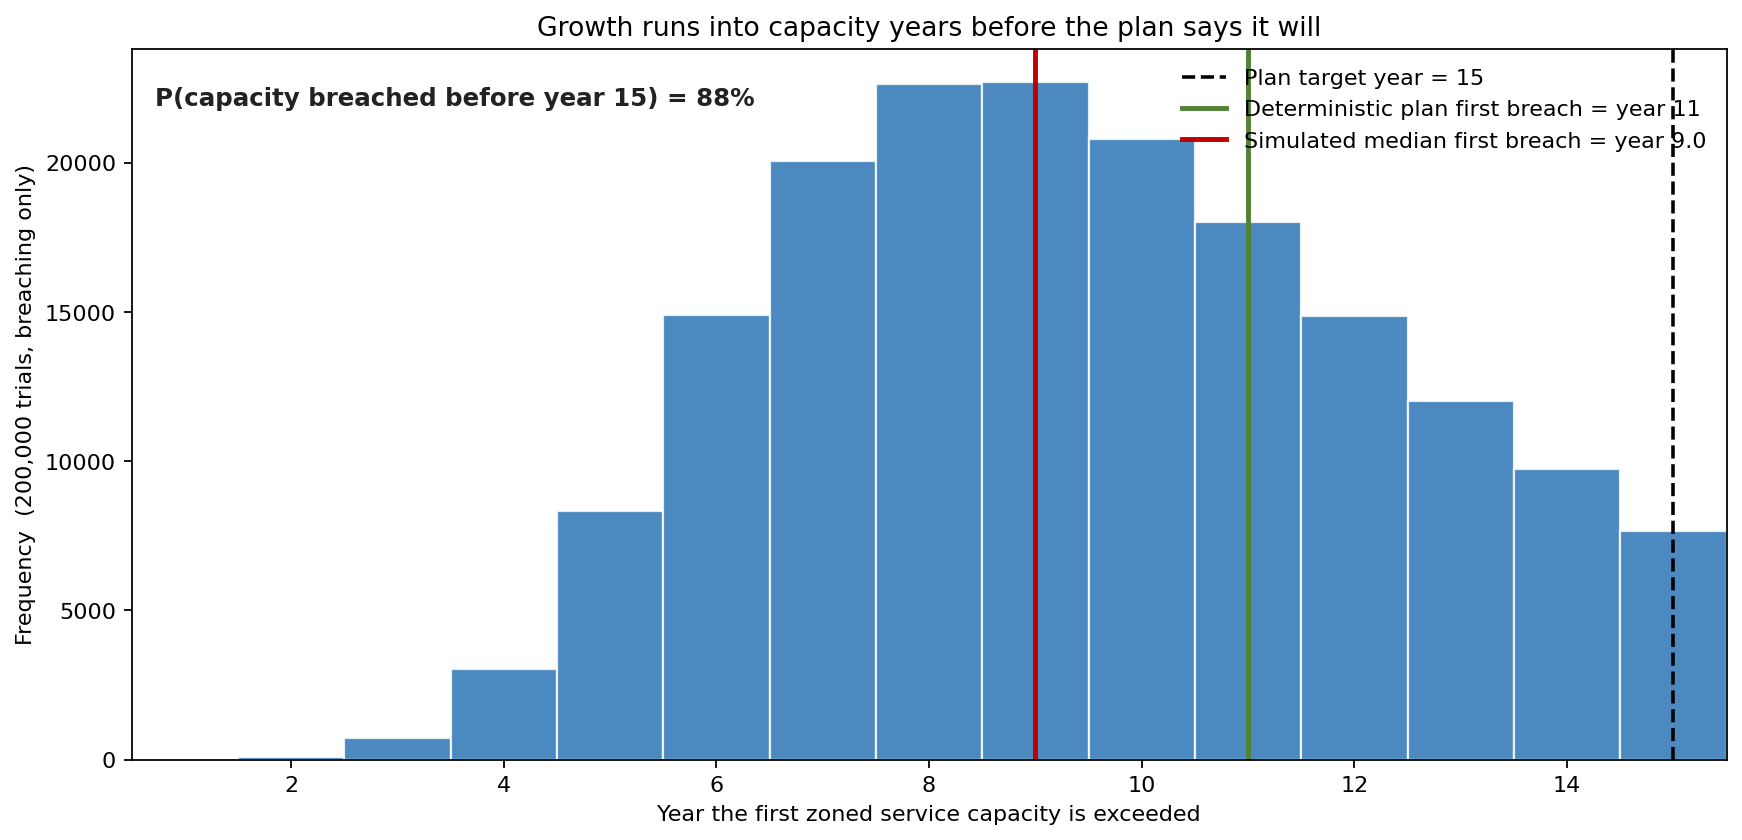
The deterministic plan put the first breach at year 11. The simulated median is year 9, and the probability that capacity is breached before the target year 15 is 88%. The water plant is the binding service — it is the first to fill in 65% of breaching trials, schools in 21%, and the transit line in 14%. The deterministic number is not the middle of the distribution; it sits in its upper third, which is exactly the comfort the point estimate manufactures.
Which service runs out of headroom first?
Reframing capacity as a confidence question — for each service, what is the probability it is still within capacity at each plan year — shows the three thresholds being approached on different schedules.
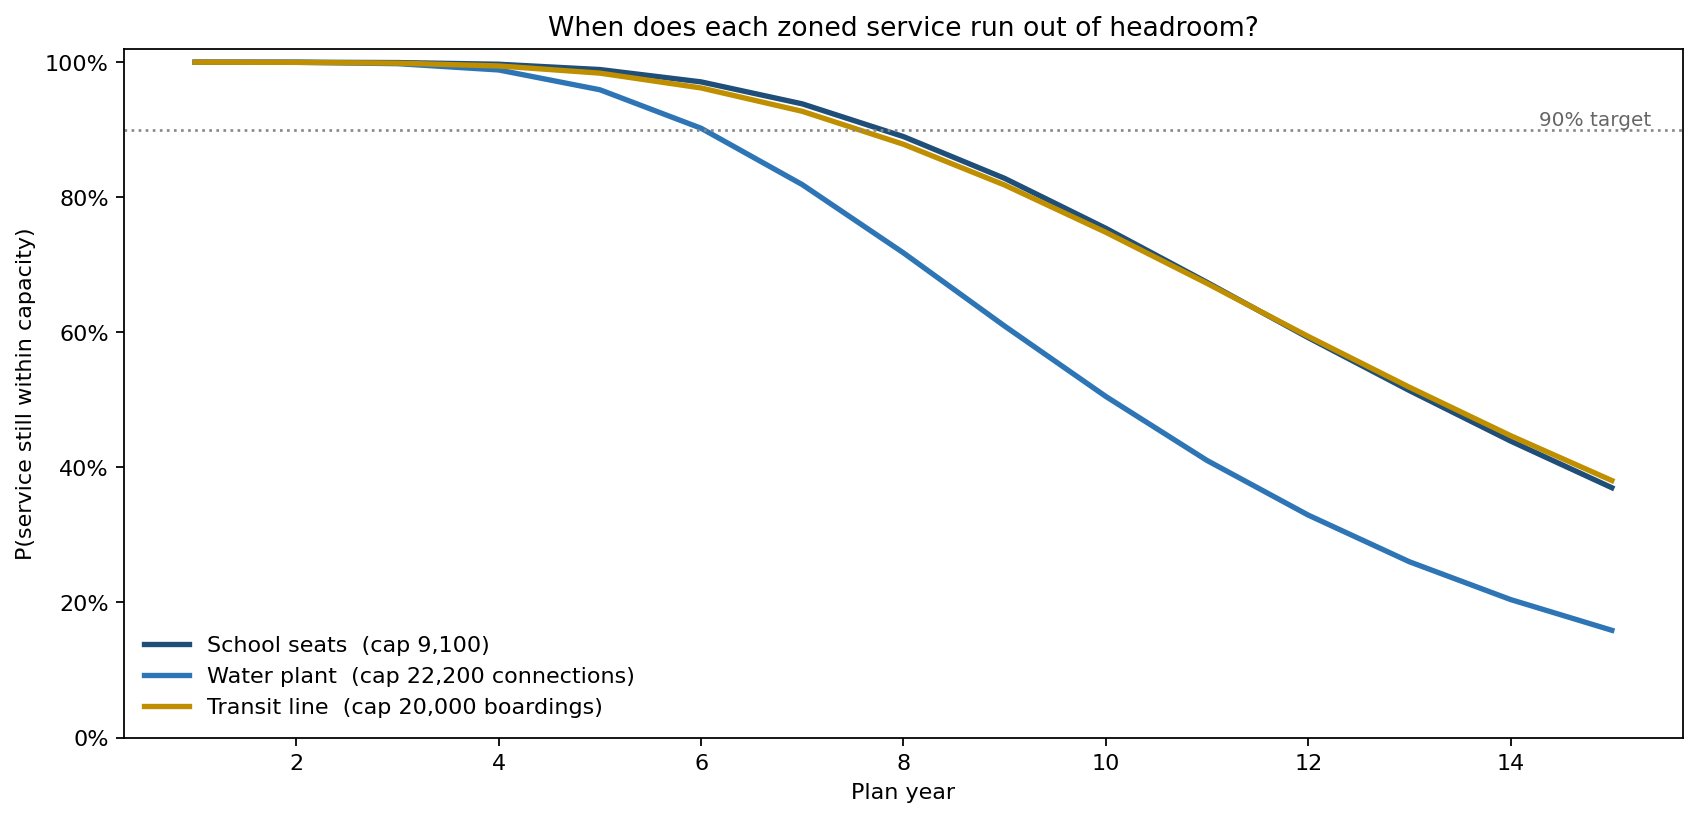
At the target year 15, the probability each service is still inside capacity is only 16% for the water plant, 37% for school seats and 38% for the transit line. The probability of staying within capacity first falls below 50% in year 11 for water and year 14 for both schools and transit. Against a 90% confidence target (the dotted line), every service crosses well before the horizon — the plan was implicitly funding roughly a coin-flip, not a confident envelope.
What moves the year capacity runs out
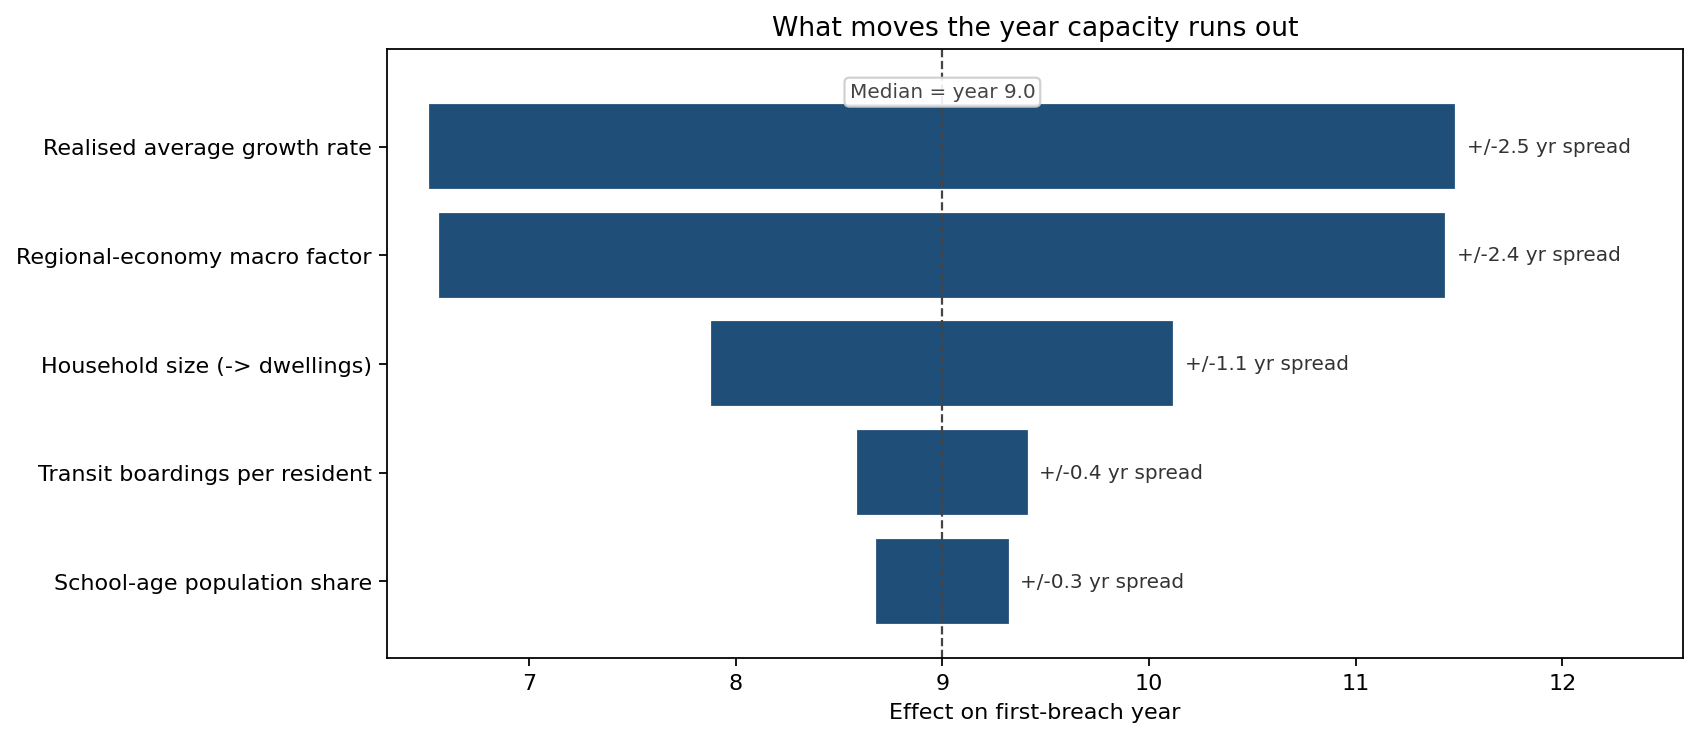
Against a median first-breach year of 9.0, the realised average growth rate moves the breach year by about ±2.5 years, and the regional-economy macro factor by about ±2.4 years — the two dominate. Household size (which converts population into water connections) moves it ±1.1 years, while transit propensity (±0.4 years) and the school-age share (±0.3 years) are minor. The lesson for the planning team: the breach date is overwhelmingly a growth-timing question, not a per-capita-intensity question, so monitoring realised growth is worth more than refining the demand coefficients.
The forecast cone the plan ignored
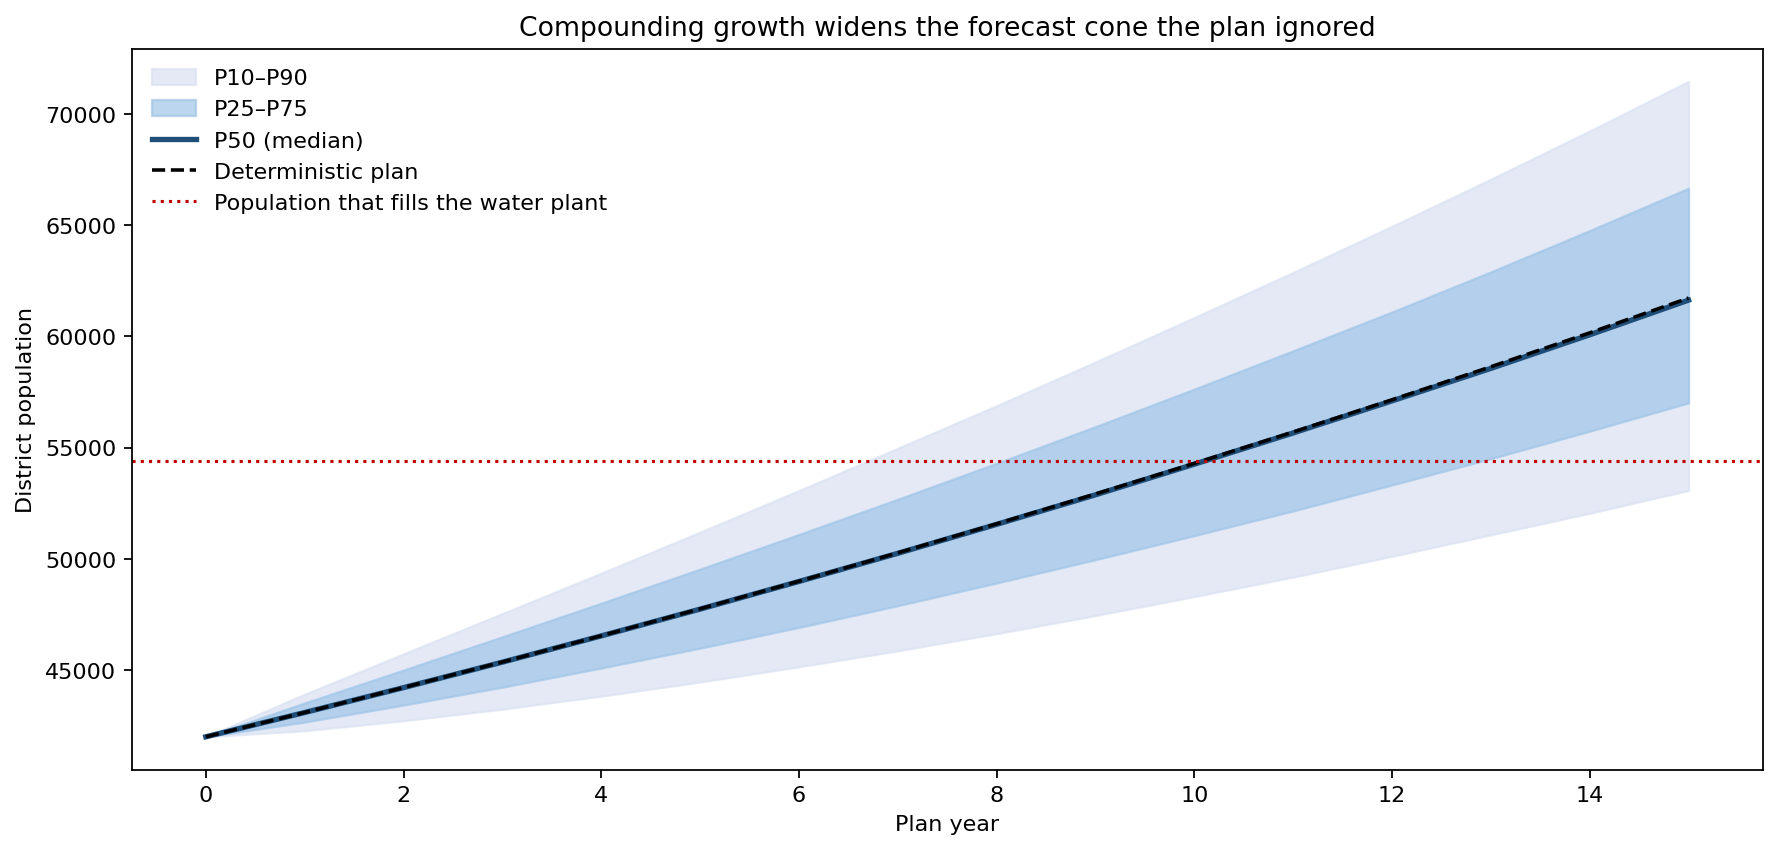
The fan chart shows why the breach dates spread out. Starting from 42,000 residents, the median tracks the deterministic line almost exactly — year 15 P50 is 61,631 against a deterministic 61,724 — but the cone widens with compounding. By year 15 the P10–P90 band runs from 53,072 to 71,463. The dotted line marks the population (about 54,390) that fills the binding water service: the median path crosses it years before year 15, and the upper band crosses it much earlier still.
What the model changed
The authority stopped sizing capacity to the deterministic build-out year and instead funded each service to keep the probability of staying within capacity above 90% across the horizon — which, for the water plant, meant pulling the expansion forward and pre-engineering a triggerable second phase. A year-by-year growth-monitoring trigger was contracted to re-run the simulation against realised data and re-time the expansions. The point forecast was retained as the median of the fan, not as the plan.
ModelRisk functionality used
- AR(1) macro factor captured the year-to-year persistence of regional growth that independent annual draws would have averaged away, which is the whole source of the early-breach risk.
- Shared common factor across services linked school, water and transit demand to the same growth path, so their breach years move together (confirmed correlations 0.43 and 0.32) rather than diversifying away.
- Monte Carlo simulation converted a single build-out year into a distribution of first-breach years, giving P(breach before year 15) = 88% and a median of year 9.
- Threshold (confidence) sweep reframed capacity as "probability still within capacity by year t" for each service, exposing that every service crossed the 50% line before the horizon.
- Sensitivity (tornado) analysis ranked realised growth and the macro factor as the dominant drivers of the breach date, directing monitoring effort to growth rather than per-capita coefficients.
For capacity planning, the build-out year is the worst number to zone against. Monte Carlo turns "when do we reach build-out?" into "what is the distribution of the year we run out of capacity, and which service binds first?" — the only question a planning authority sizing fixed infrastructure can honestly answer.