

Industry: Real Estate Development
Product: ModelRisk
Application: Evaluating Uncertainty in Real Estate Development Projects
A 20% Pro-Forma Margin That Has a 22% Chance of Losing Money
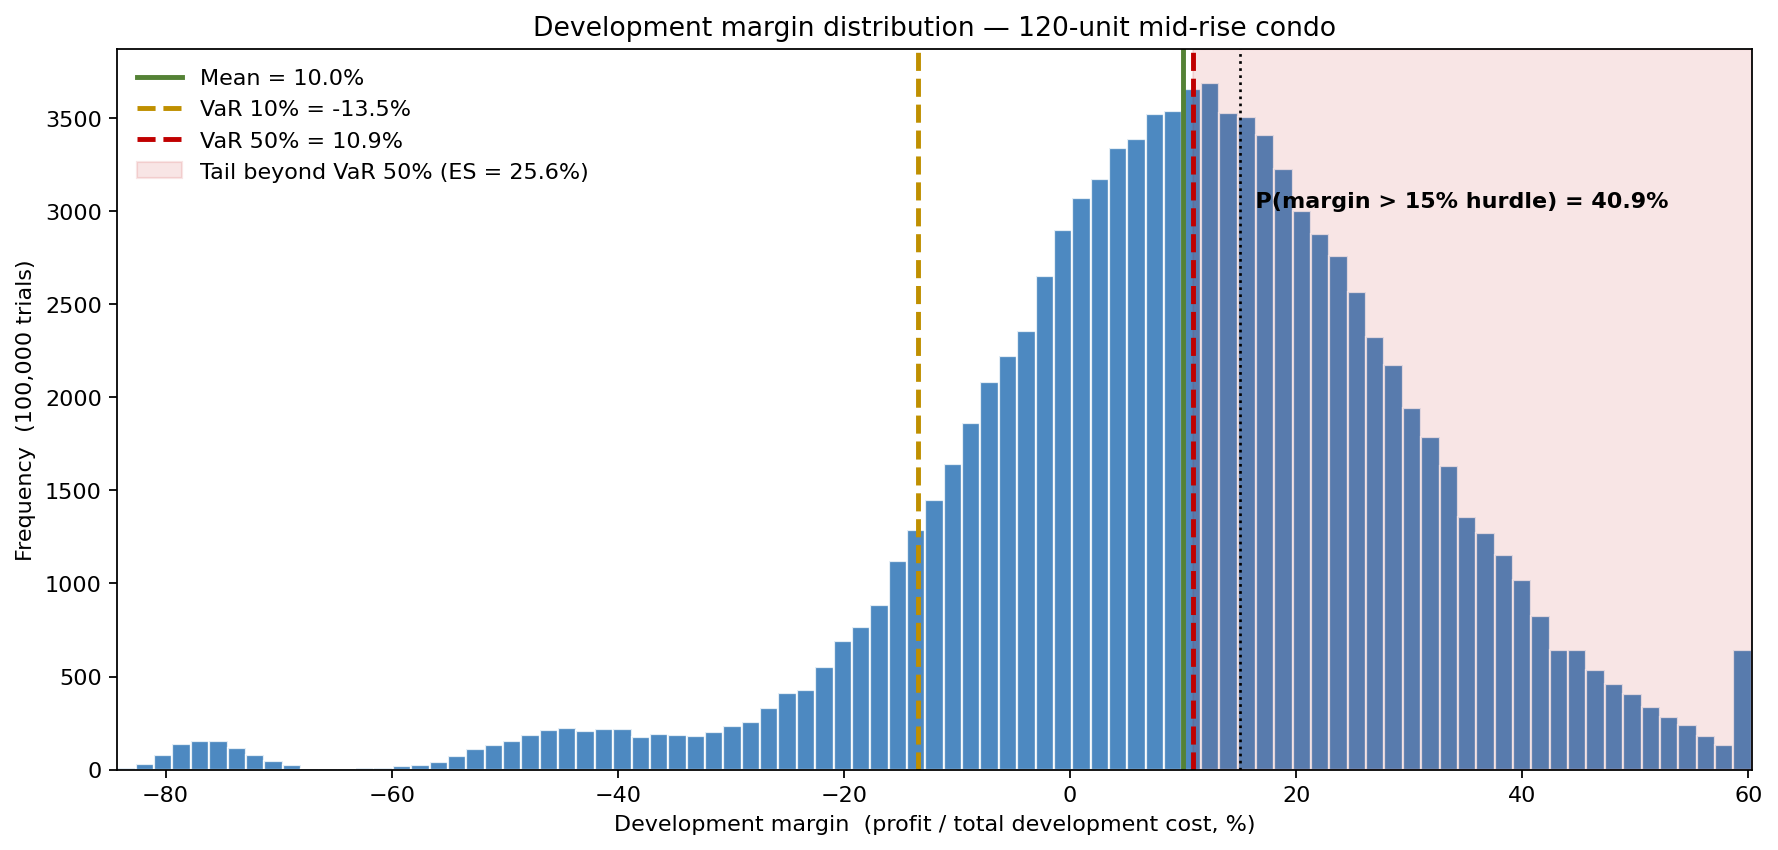
The spreadsheet pro-forma for the 120-unit mid-rise condo showed a clean 20% development margin: $150M of sales against roughly $125M of all-in cost, with the construction loan paid off comfortably inside the build. On that single number the investment committee was ready to approve the equity cheque. Rebuilt in ModelRisk with the same inputs entered as distributions instead of point estimates, the deal told a very different story. The median margin was 11%, not 20%; the probability of finishing below the firm's 15% hurdle was 59%; and the probability of an outright loss was 22%. One in five times, the deal that "makes 20%" hands the equity back smaller than it went in.
The gap is not pessimism. It is the difference between a model that assumes the sale price, the construction cost, the absorption pace and the interest carry all land on their best guess at once, and a model that lets them move — and move together.
Why a point estimate fails here
A vertical development pro-forma multiplies a unit price by a unit count, subtracts a construction cost, and nets off the loan interest. Every one of those four numbers is uncertain, and a single-point estimate silently assumes each one is certain. Worse, it assumes they are independent — that a soft market which knocks 10% off the sale price has nothing to do with how long the building takes to sell out. In reality they are driven by the same thing: the property cycle. A hot cycle lifts the sale price and speeds absorption and bids up the trades; a soft cycle does all three in reverse. That shared driver is exactly what a deterministic pro-forma cannot represent, and it is where the downside lives.
The model
The deal is a 120-unit condo: $18M of land already under contract, a $96M point-estimate hard-and-soft construction cost, a 22-month build, and a construction loan at 9.5% funding 65% of cost while equity funds the rest. The hurdle is a 15% development margin (profit over total cost) and a 15% levered IRR. Four uncertain inputs were entered as distributions:
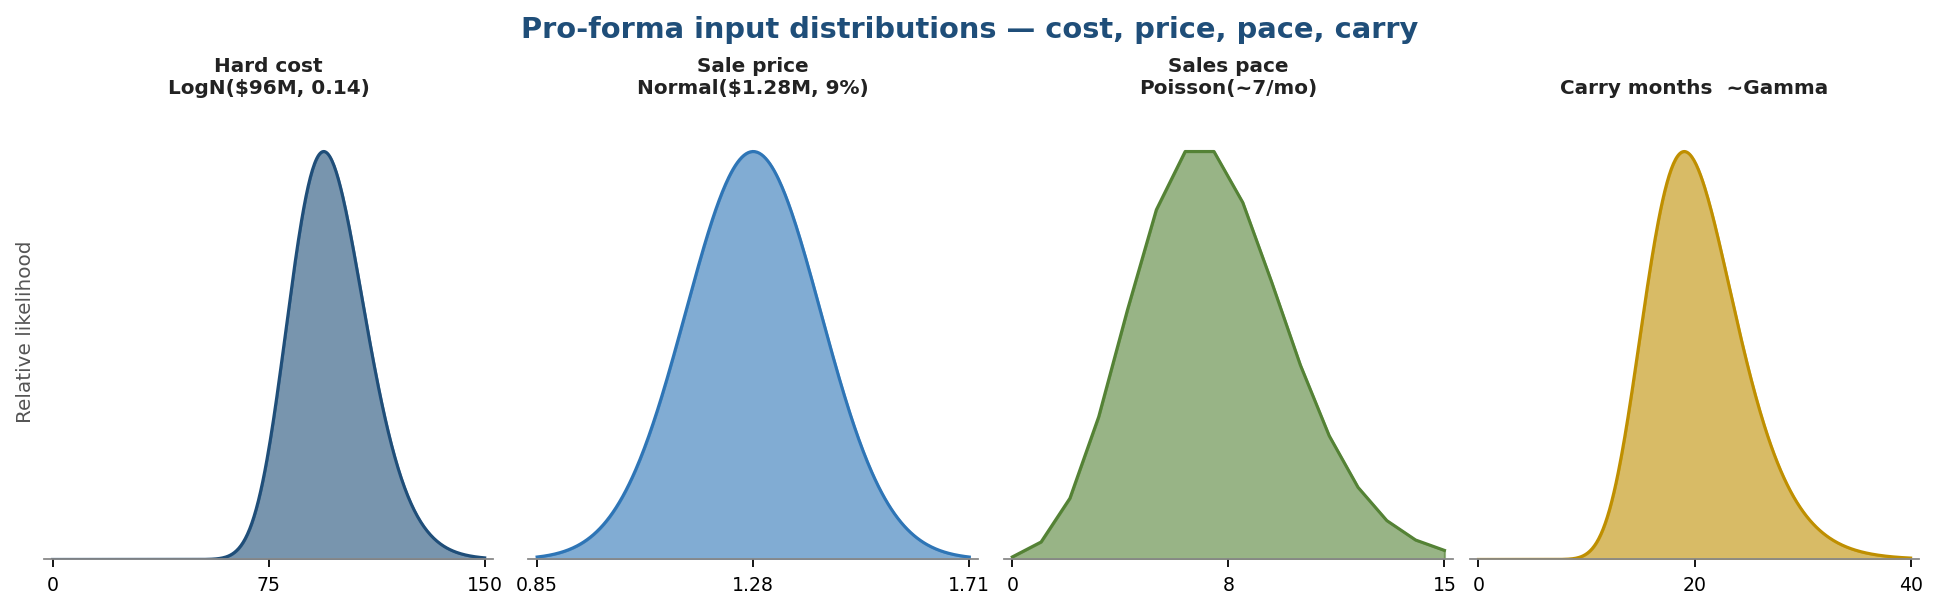
- Construction hard cost — LogNormal, $96M mean, sigma 0.14 in log-space. LogNormal is bounded at zero and right-skewed: the tail of expensive surprises is longer than the tail of bargains.
- Sale price per unit — Normal, $1.28M mean, with a market-driven swing of about ±9% plus a 5% idiosyncratic term, floored at a physical $0.70M.
- Sales pace — a Poisson draw of units sold per month around a cycle-dependent mean of about seven, which sets how long the inventory takes to clear.
- Interest carry — not an input but a consequence: the loan compounds for the whole build plus the sell-down, so a slow market is paid for twice, in lost time and in interest.
The single most important modelling choice is a shared market-cycle factor drawn once per iteration. It lifts price, lifts absorption and bids up cost together. Without it, summing 120 near-independent unit prices collapses the revenue spread toward its mean — a central-limit artefact that makes the deal look far safer than it is. With it, the year-end margin standard deviation widens from 0.151 to 0.209, and the price-to-margin rank correlation comes through at +0.57 while the carry-to-margin correlation lands at -0.69, exactly the dependence the cycle is meant to impose.
What the distribution shows
The deterministic pro-forma's 20% margin sits to the right of almost the entire simulated distribution. The mean margin is 10%, the median 11%, the P10 a -13.5% loss and the P90 a 34.5% gain. The chart marks the 15% hurdle: the probability of clearing it is just 41%, and the probability of an outright loss (margin below zero) is 22%. The single 20% number was not wrong so much as unrepresentative — it described one corner of a distribution that is mostly somewhere else.
How the odds move with price
Because the sale price is the revenue lever the developer can most plausibly influence — through unit mix, finishes and marketing — the next question is how the deal's odds respond to it. Sweeping the mean price per unit from $1.05M to $1.55M and re-simulating at each step traces the probability of clearing each hurdle.
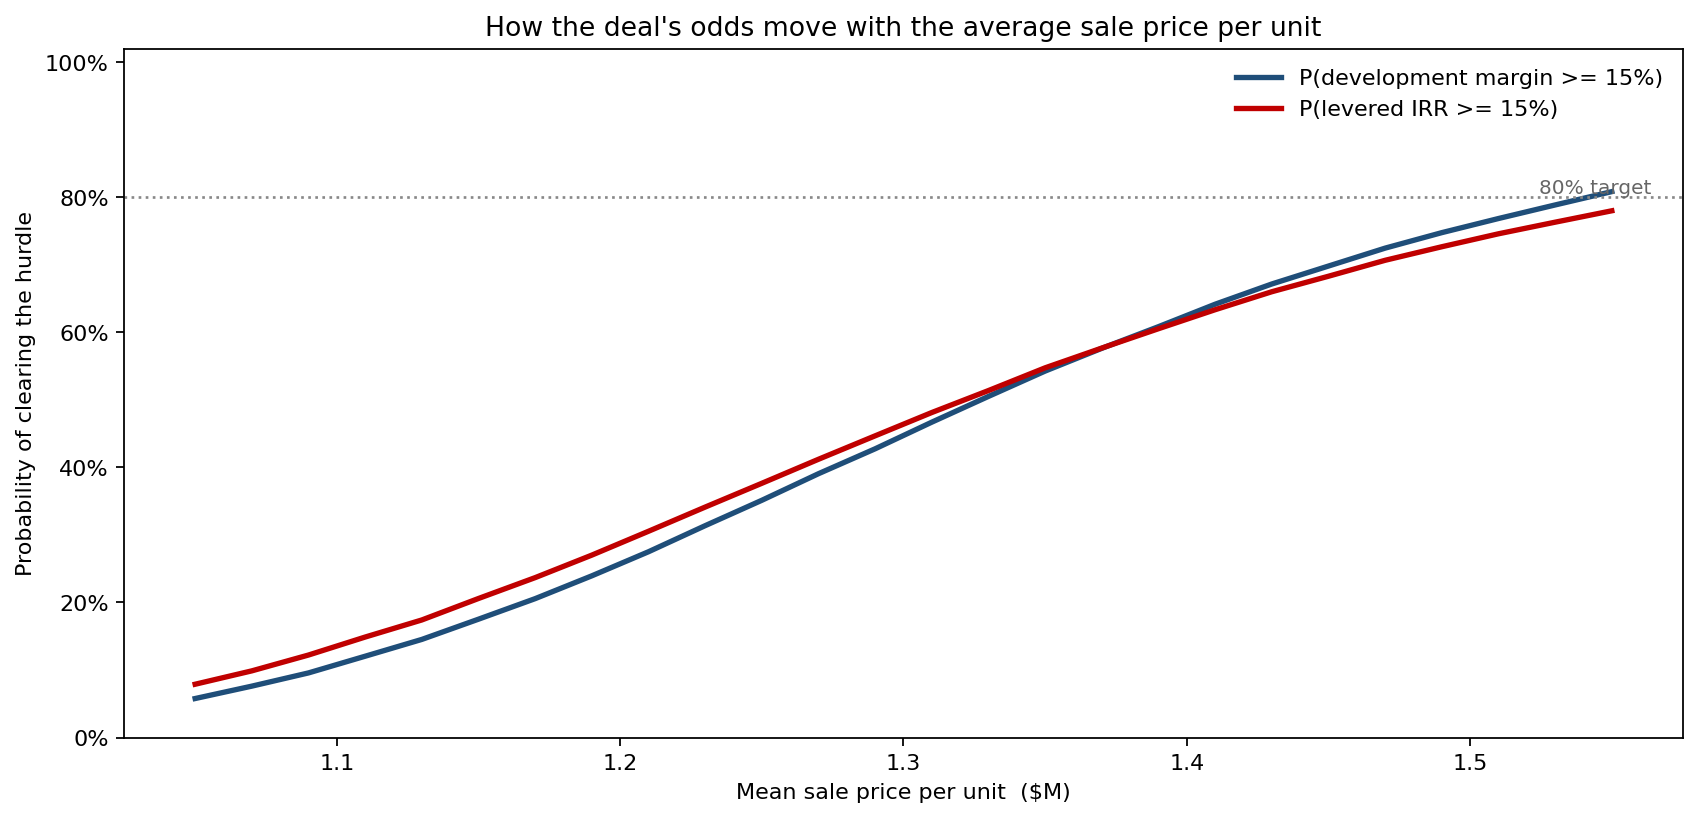
At the $1.28M base price the deal clears the 15% margin hurdle only 41% of the time and the 15% IRR hurdle 43% of the time. To reach an 80% confidence of clearing the margin hurdle the developer would need to achieve about $1.54M per unit — a 20% lift on the underwriting price. That single curve reframes the negotiation: rather than arguing about whether the deal "works," the committee can decide what price confidence it is willing to underwrite.
What actually drives the spread
Ranking the drivers of the margin distribution by rank-correlation reveals where the risk actually concentrates.
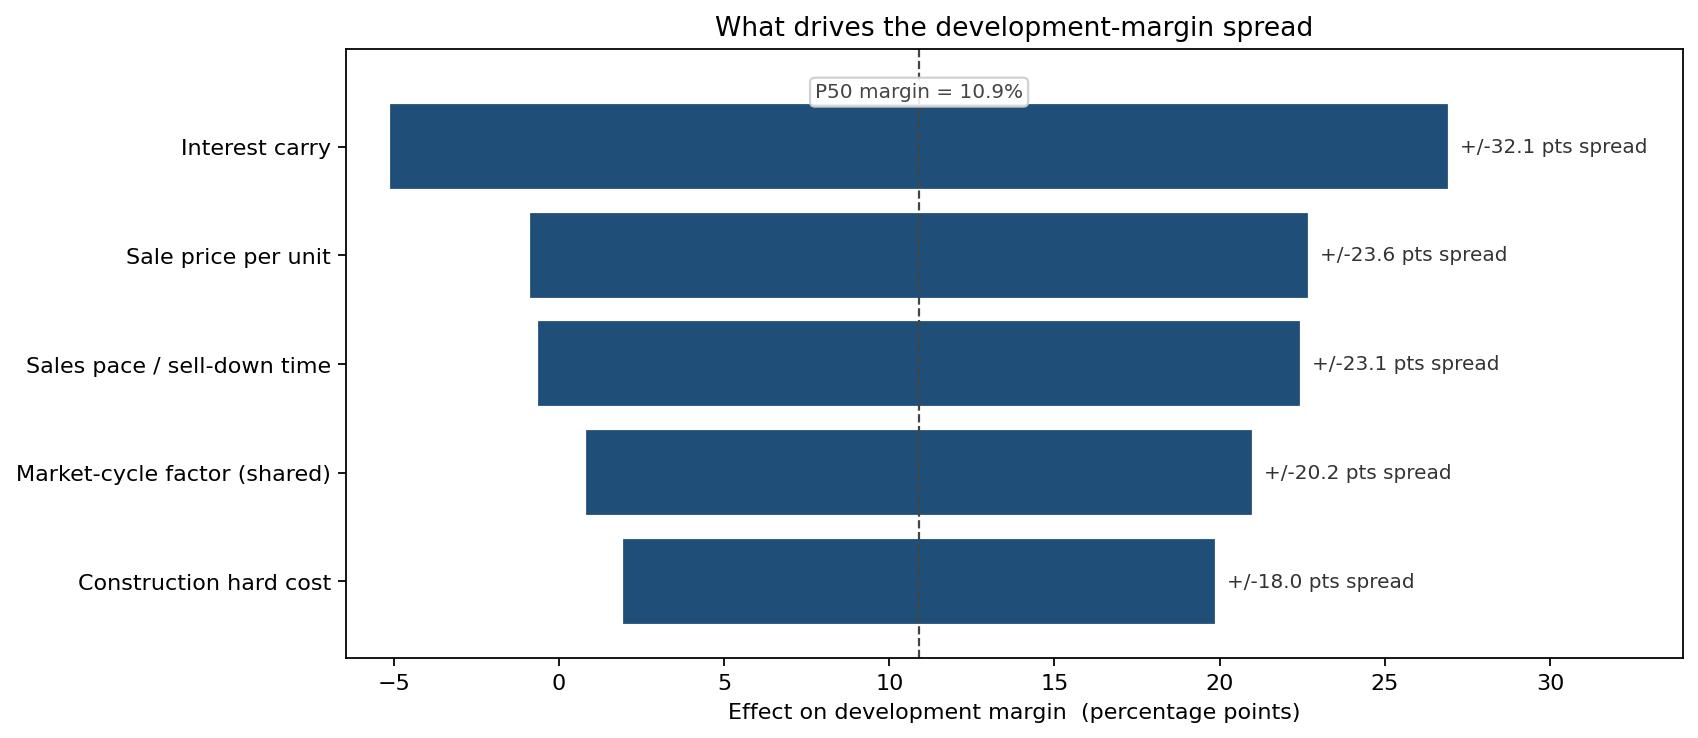
Against a P50 margin of 11%, the largest single driver is the interest carry, at roughly ±16 percentage points of margin spread — larger than the sale price (±12 points) or the construction cost (±9 points). That is the counter-intuitive result the point estimate buries: the carry is not an input anyone debated, but because it compounds over the build and the sell-down, a slow market hits the deal twice and the interest line quietly becomes the biggest mover. The sales pace (±12 points) and the shared market cycle (±10 points) follow close behind. The lesson for the committee is that the cheapest risk reduction may be a faster sell-down or a shorter-tenor loan, not shaving the construction budget.
What the model changed
- The approval was reframed from "20% margin" to "41% chance of clearing the 15% hurdle." The committee asked for a price-confidence threshold before releasing equity, not a single pro-forma number.
- A shorter-tenor construction loan was priced. Once the tornado showed interest carry as the top driver, the team modelled a faster sell-down and a 9.5%→8.5% refinance, both of which moved the median margin more than a 5% cut to the hard-cost budget.
- Absorption became a covenant, not an assumption. Because the Poisson sales pace drives the carry tail, the marketing budget and pre-sales targets were sized against the sell-down distribution rather than a single units-per-month figure.
- Downside was sized, not denied. A 22% probability of loss with a P10 of -13.5% told the equity partners exactly how much of the cheque was genuinely at risk — the basis for the contingency reserve.
ModelRisk Functionality Used
- Monte Carlo simulation turning the deterministic pro-forma into a full distribution of development margin and levered IRR.
- LogNormal, Normal and Poisson distributions for construction cost, sale price and sales pace, chosen for their shape and bounds rather than convenience.
- A shared market-cycle factor sampled once per iteration and propagated to price, pace and cost — the correlation a deterministic pro-forma cannot represent, verified at +0.57 price-to-margin and -0.69 carry-to-margin.
- Parameter sweeps producing the price-confidence curve the committee used to set its underwriting threshold.
- Sensitivity (tornado) analysis that surfaced interest carry — not cost or price — as the dominant driver of the margin spread.
In development, the pro-forma margin is not a number, it is a distribution. ModelRisk is what makes that distribution visible, and once the committee can see that a 20% headline margin carries a one-in-five chance of loss, the conversation moves from whether to build to what confidence is worth underwriting.