

Industry: Real Estate
Product: ModelRisk
Application: Quantifying uncertainty in property management decisions
A 1.24x average DSCR still trips the 1.20x covenant more than one year in three
An asset manager runs a stabilised 200-unit multifamily property. On paper it is healthy: $6.50M of gross potential rent, a 36% expense ratio, and a senior loan whose $2.80M annual debt service is comfortably covered by the budgeted NOI — a 1.32x debt-service-coverage ratio against the lender's 1.20x covenant. The budget says the covenant is never in doubt.
Re-run a full operating year as a Monte Carlo simulation in ModelRisk — letting vacancy, tenant turnover, rent arrears, operating-expense inflation and lumpy unplanned capex vary the way they do in practice — and the picture sharpens uncomfortably. The simulated mean NOI is $3.48M (a 1.24x mean DSCR), but the spread runs from a P10 of $2.80M to a P90 of $4.08M. Because the average sits only just above the $3.36M covenant floor, the property breaches its 1.20x covenant 37.3% of the time and falls below a 1.0x DSCR — unable to fully cover debt service from operations — in 9.9% of years.
Why a point estimate fails
Operating cash flow is a single line netted from a dozen moving parts, and the dangerous ones do not move independently. A tough local-market year raises vacancy, lifts tenant turnover, increases arrears and pushes operating costs up all at once. The deterministic budget freezes each of these at its central value and implicitly assumes the bad ones won't coincide — so the budgeted NOI sits a full coverage-tier above what the property actually delivers on average.
The model below routes every soft operating driver through a single shared operating-year factor, so that a soft year hits the property from several sides simultaneously. Empirically this produces a positive co-movement between the drivers — vacancy correlates with turnover at +0.23 and with arrears at +0.22 — which is exactly what gives the NOI distribution its heavy lower tail. Modelling them as independent would let the swings cancel and would hide the covenant risk almost entirely (a central-limit collapse). Capex enters separately as a frequency-severity process (a Poisson count of unplanned events times a LogNormal cost each), because those shocks are lumpy rather than smooth.
Operating NOI against the covenant floor
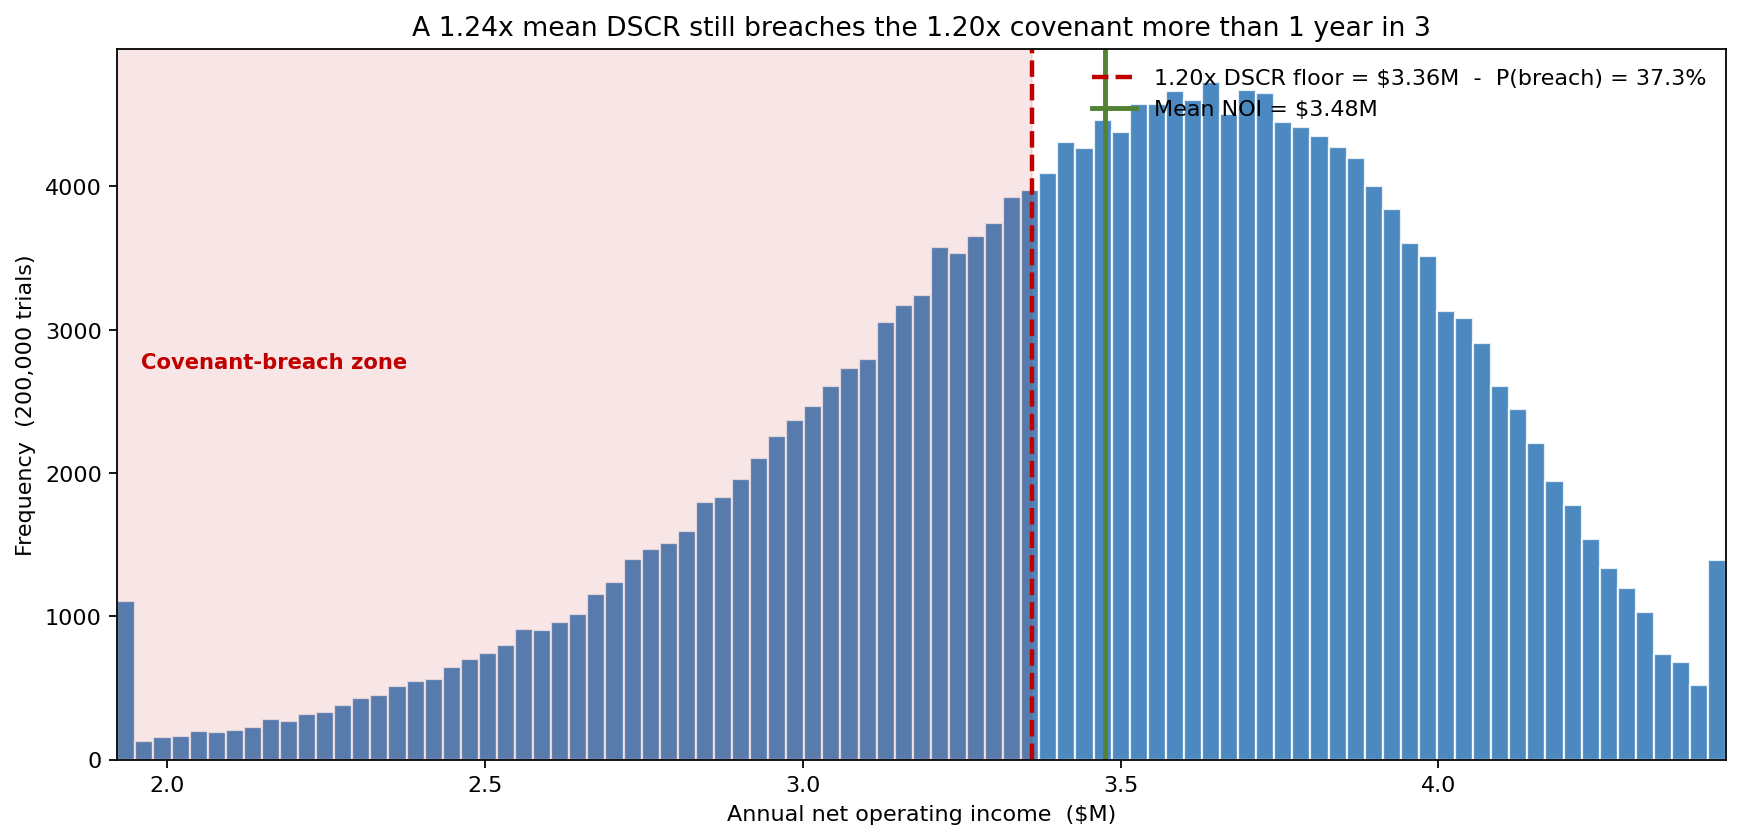
The headline chart plots 200,000 simulated operating years. The simulated mean NOI is $3.48M with P10 $2.80M, P50 $3.53M and P90 $4.08M. The red 1.20x DSCR floor at $3.36M sits inside the body of the distribution, not in its tail — which is why 37.3% of years land in the shaded covenant-breach zone, and why 9.9% fall below the $2.80M needed just to reach a 1.0x DSCR. A budget that reports 1.32x and stops there tells the owner none of this.
A cash reserve buys down breach risk
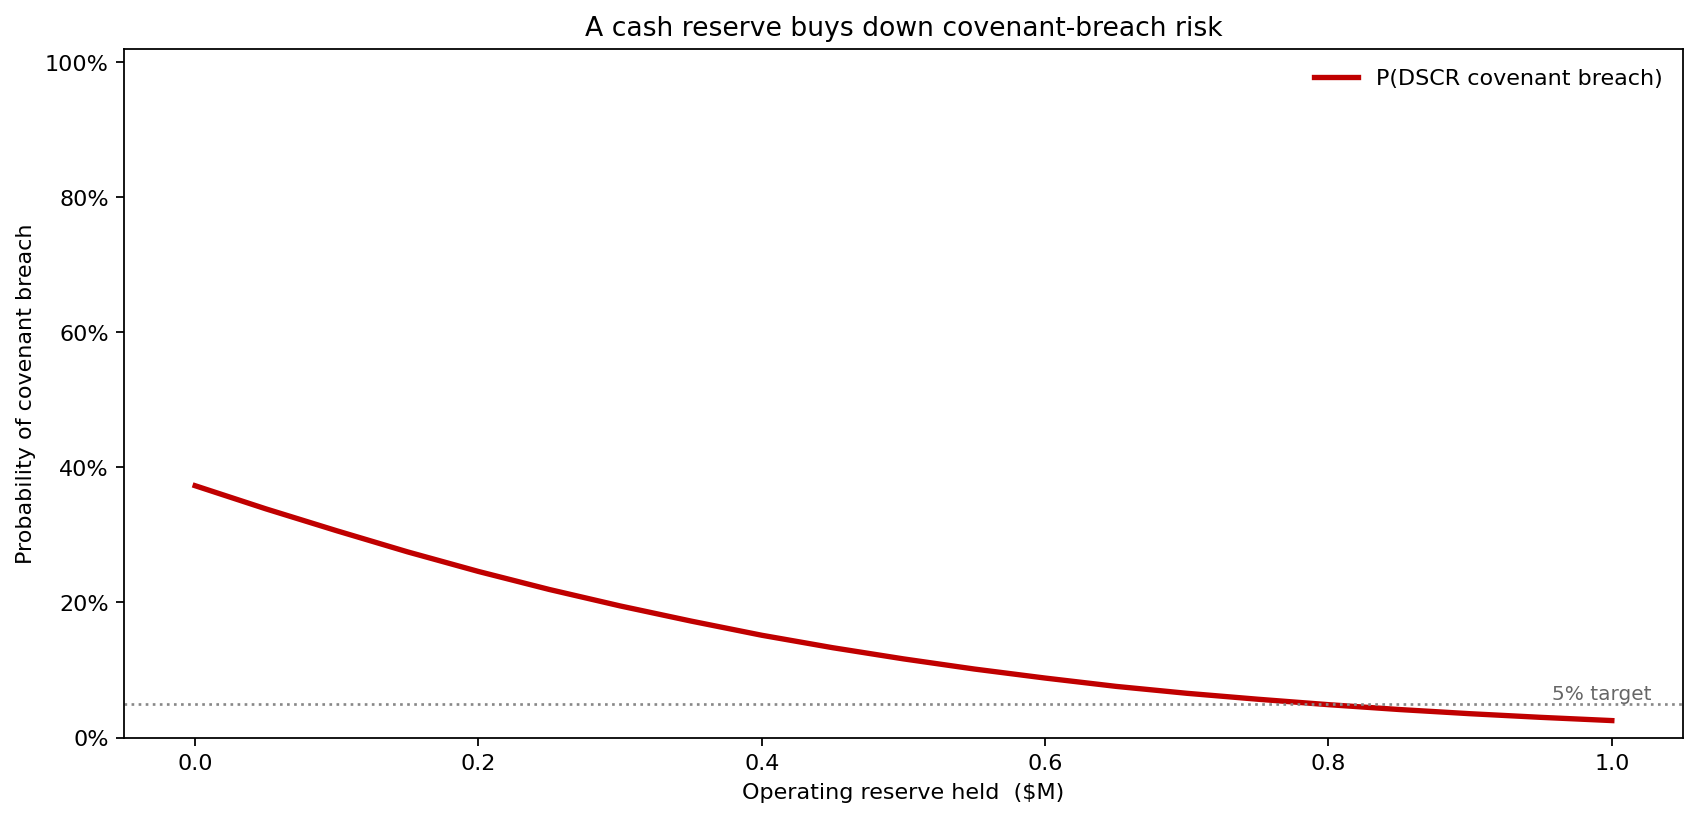
The most direct lever the asset manager controls is the operating reserve — cash set aside to top up a soft year. Sweeping the reserve from $0 to $1.0M shows the payoff: breach probability falls from 37.3% at $0, to 21.9% at $0.25M, to 11.6% at $0.50M, and down to 2.5% at $1.0M. This turns an abstract covenant worry into a sizing decision the owner can act on: holding roughly half a million in reserve cuts the chance of a breach by two-thirds.
What drives the operating-NOI spread
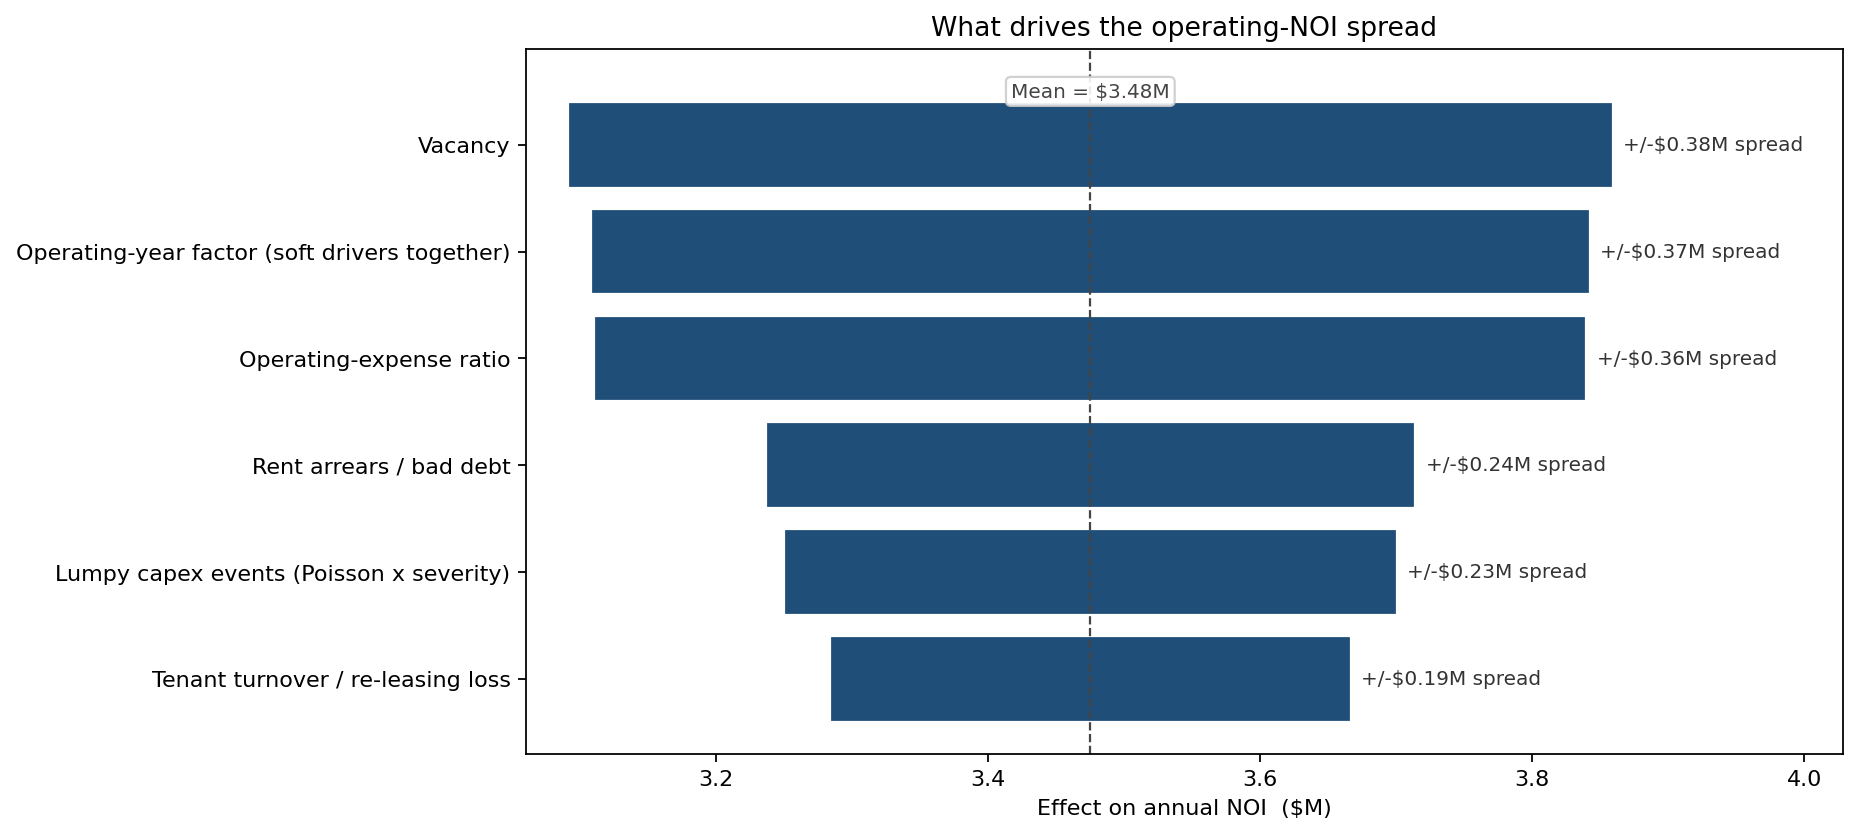
Ranked against the $3.48M mean NOI, three drivers sit almost level at the top: vacancy (+/-$0.38M), the operating-year factor that moves the soft drivers together (+/-$0.37M), and the operating-expense ratio (+/-$0.37M). Rent arrears (+/-$0.24M) and lumpy capex events (+/-$0.23M) form a second tier, with tenant turnover (+/-$0.19M) smallest. The lesson for the management plan: keeping units leased and costs in check protects coverage far more than chasing any single capex line.
Where the unplanned-capex budget goes
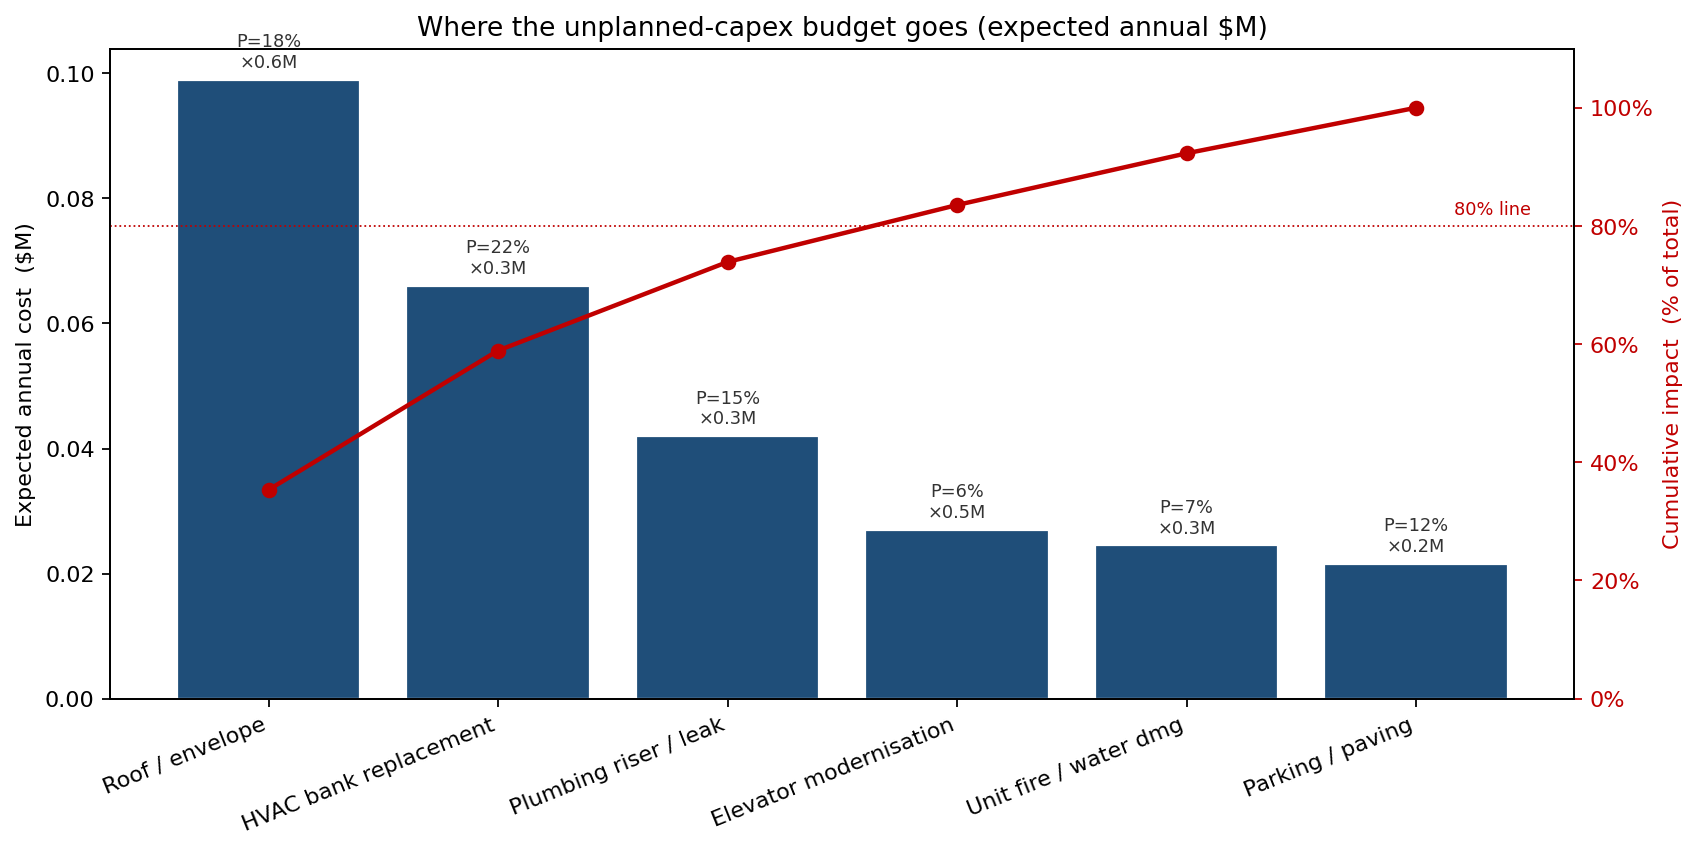
Decomposing the lumpy-capex risk into the event types the manager budgets reserves against, total expected unplanned capex is $0.28M per year. Roof / envelope ($0.099M expected) and HVAC bank replacement ($0.066M) together account for well over half of it, with plumbing risers ($0.042M) next. The Pareto curve tells the manager where reserve dollars and preventive-maintenance attention earn the most: the first two categories, not the long tail of smaller risks.
What the model changed
The owner stopped treating the 1.32x budgeted DSCR as a safety margin and started treating coverage as a probability. With a 37.3% breach likelihood quantified, the asset plan changed in two concrete ways: a $0.50M operating reserve was funded — cutting breach risk to 11.6% — and the preventive-maintenance budget was re-weighted toward roof and HVAC, the two categories the Pareto flagged as most of the expected capex. The lender conversation also shifted from "we comfortably cover 1.20x" to a defensible distribution of outcomes, which the bank accepted as a more credible basis for the covenant.
ModelRisk functionality used
- Monte Carlo simulation of a full operating year, netting NOI from rent, vacancy, turnover, arrears, operating expenses and unplanned capex.
- Beta distributions for vacancy, turnover and arrears (bounded fractions); LogNormal for the operating-expense ratio; a Poisson frequency times LogNormal severity for lumpy capex events.
- A shared operating-year factor imposing positive co-movement across the soft drivers (verified at +0.23 vacancy-to-turnover and +0.22 vacancy-to-arrears), so the covenant-breach tail is not erased by a central-limit collapse.
- Threshold (reserve) sweep showing how P(covenant breach) falls as the operating reserve rises.
- Sensitivity (tornado) analysis ranking vacancy, the year factor, opex, arrears, capex and turnover by their effect on NOI.
- Pareto analysis of the frequency-severity capex events to direct reserve and maintenance spend at the largest expected costs.