

Industry: Real Estate
Product: ModelRisk
Application: Property Investment Decision-Making Under Uncertainty
The deal pencils to a 13.6% IRR — but clears its 12% hurdle only 55% of the time
An acquisition team underwrites a stabilised $50.0M asset: 65% senior debt at 6.0% interest-only, $18.5M of equity in, a five-year hold, and a sale at a 6.25% exit cap. Plug the central assumptions in and the levered IRR comes out at 13.6%, comfortably above the fund's 12% hurdle. The investment committee approves.
Run the same underwriting as a Monte Carlo simulation in ModelRisk — letting rent growth, vacancy, operating expenses and the exit cap rate vary the way they actually do over a five-year cycle — and the single 13.6% becomes a distribution with a mean of 12.4% and a P10-to-P90 range of -2.5% to 26.2%. The deal clears its hurdle only 55.2% of the time, and there is a 13.4% probability the equity ends the hold underwater. The headline IRR was never wrong; it was just one draw, and not even the most likely one.
Why a point estimate fails
A levered real-estate return is a thin slice of equity sitting on top of a much larger asset, so small swings in the underlying compound hard into the IRR. The deterministic case freezes five years of rent growth, five years of vacancy and the exit cap rate at their central guesses — and then quietly assumes those guesses are independent, so their errors average out.
They do not. A strong market lifts rent growth and compresses the exit cap rate at the same time (you sell a bigger NOI at a richer price — upside twice over); a weak market does the reverse. The model below routes rent growth and the exit cap through a single shared market-cycle factor, producing a rent-growth-to-exit-cap correlation of -0.83. That common factor is exactly what stops the per-year cash flows from averaging into a deceptively narrow band, and it is why the real IRR distribution is so much wider than the point estimate suggests.
The deterministic plan is one of many outcomes
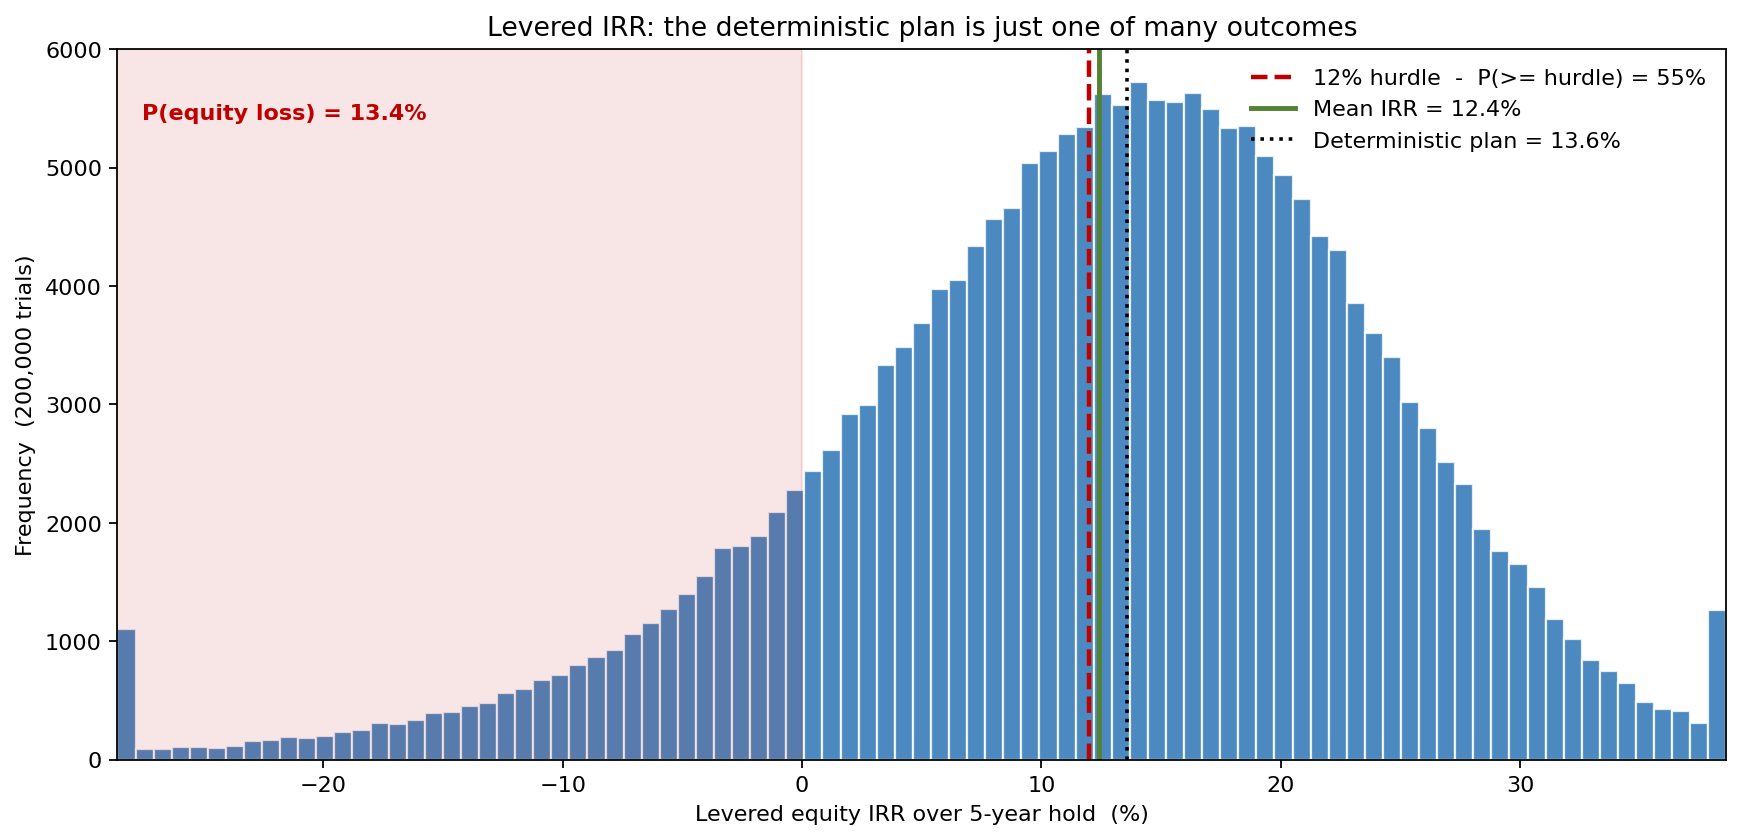
The headline chart plots 200,000 simulated holds of the $18.5M equity. The deterministic plan (13.6%) and the simulated mean (12.4%) sit close together near the centre, but the spread is enormous: P10 is -2.5%, P50 is 13.4%, P90 is 26.2%. The 12% hurdle line falls just left of the median, so the deal clears it 55.2% of the time — barely better than a coin toss. The shaded left region carries a 13.4% probability of outright equity loss. A committee that saw only the 13.6% would never have priced that tail.
Leverage cuts both ways
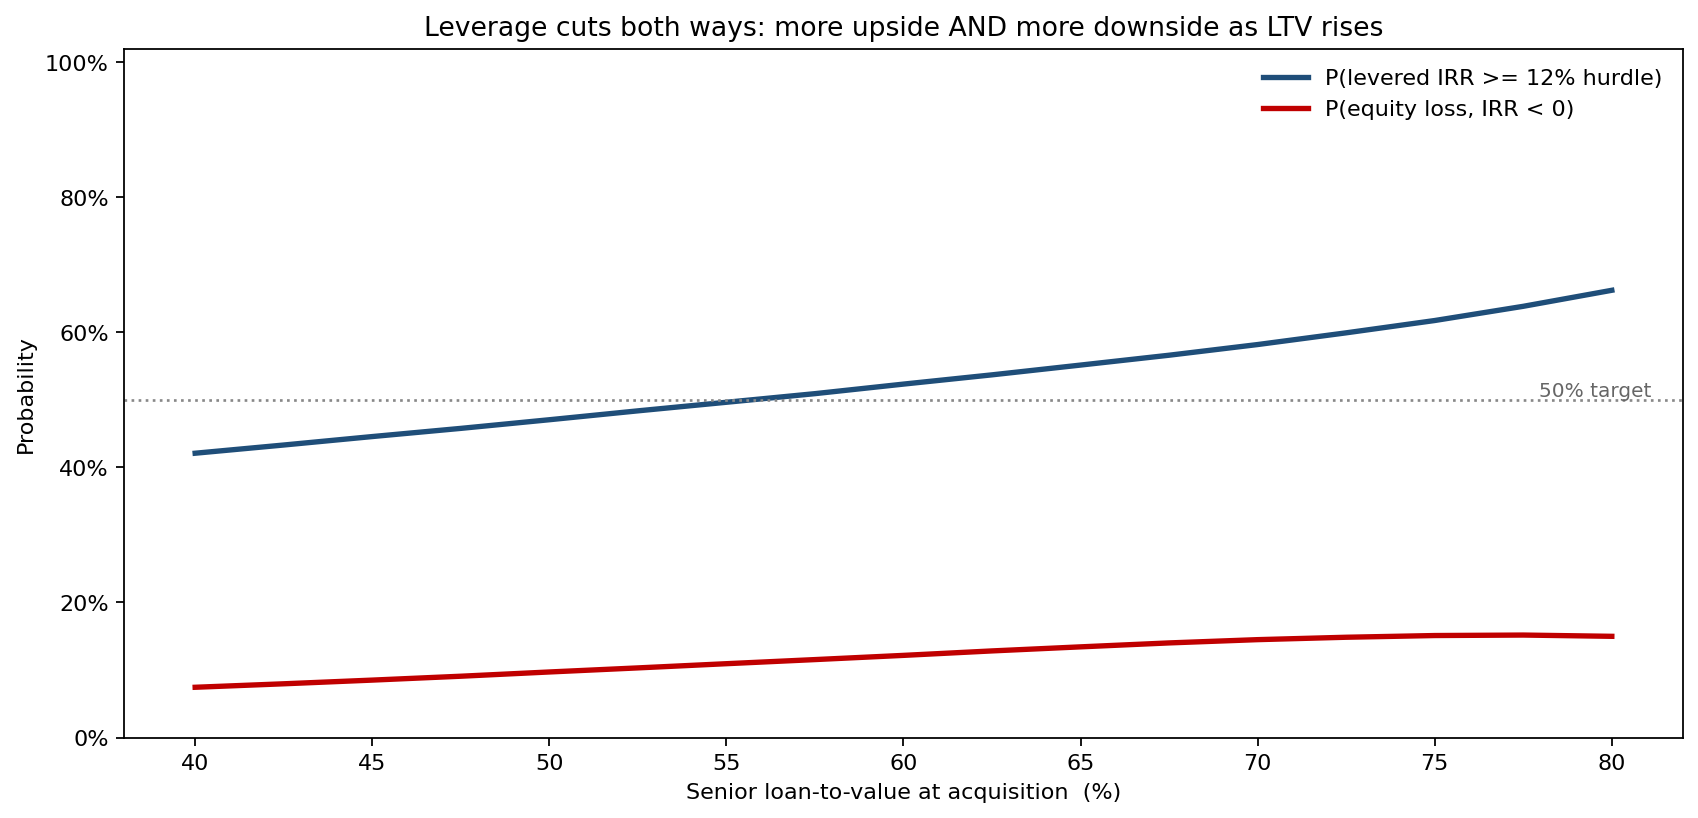
Sweeping the senior loan-to-value from 40% to 80% shows leverage doing both of its jobs at once. The chance of clearing the 12% hurdle rises from 42% at 40% LTV to 55% at 65% LTV to 66% at 80% LTV — positive leverage, because the asset out-earns its debt on average. But the chance of an equity loss climbs in lockstep, from 7% to 13% to 15%. More debt buys a higher probability of a great outcome and a higher probability of a wipeout simultaneously; the right LTV is a risk-appetite decision, not an optimisation, and this chart frames it as one.
What drives the levered IRR spread
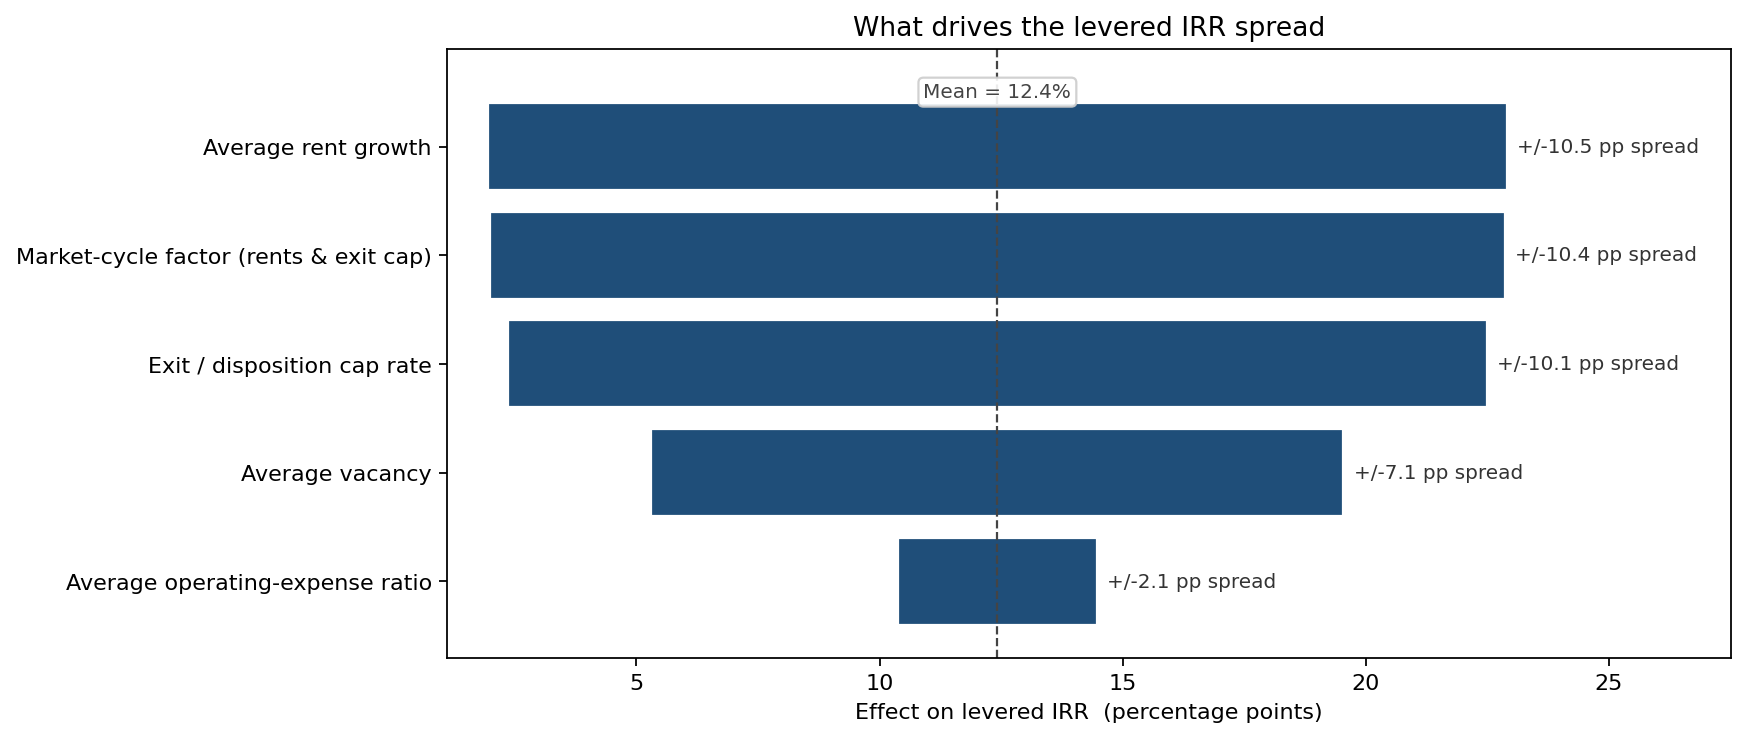
Ranked against the 12.4% mean IRR, three inputs dominate in a near-tie: average rent growth (+/-10.5 pp), the market-cycle factor that moves rents and the exit cap together (+/-10.4 pp), and the exit/disposition cap rate (+/-10.1 pp). Average vacancy (+/-7.1 pp) matters meaningfully; the operating-expense ratio (+/-2.1 pp) is almost an afterthought. The takeaway for diligence: this return lives and dies on the revenue line and the exit assumption, not on shaving property-management costs.
How many times the $18.5M comes back
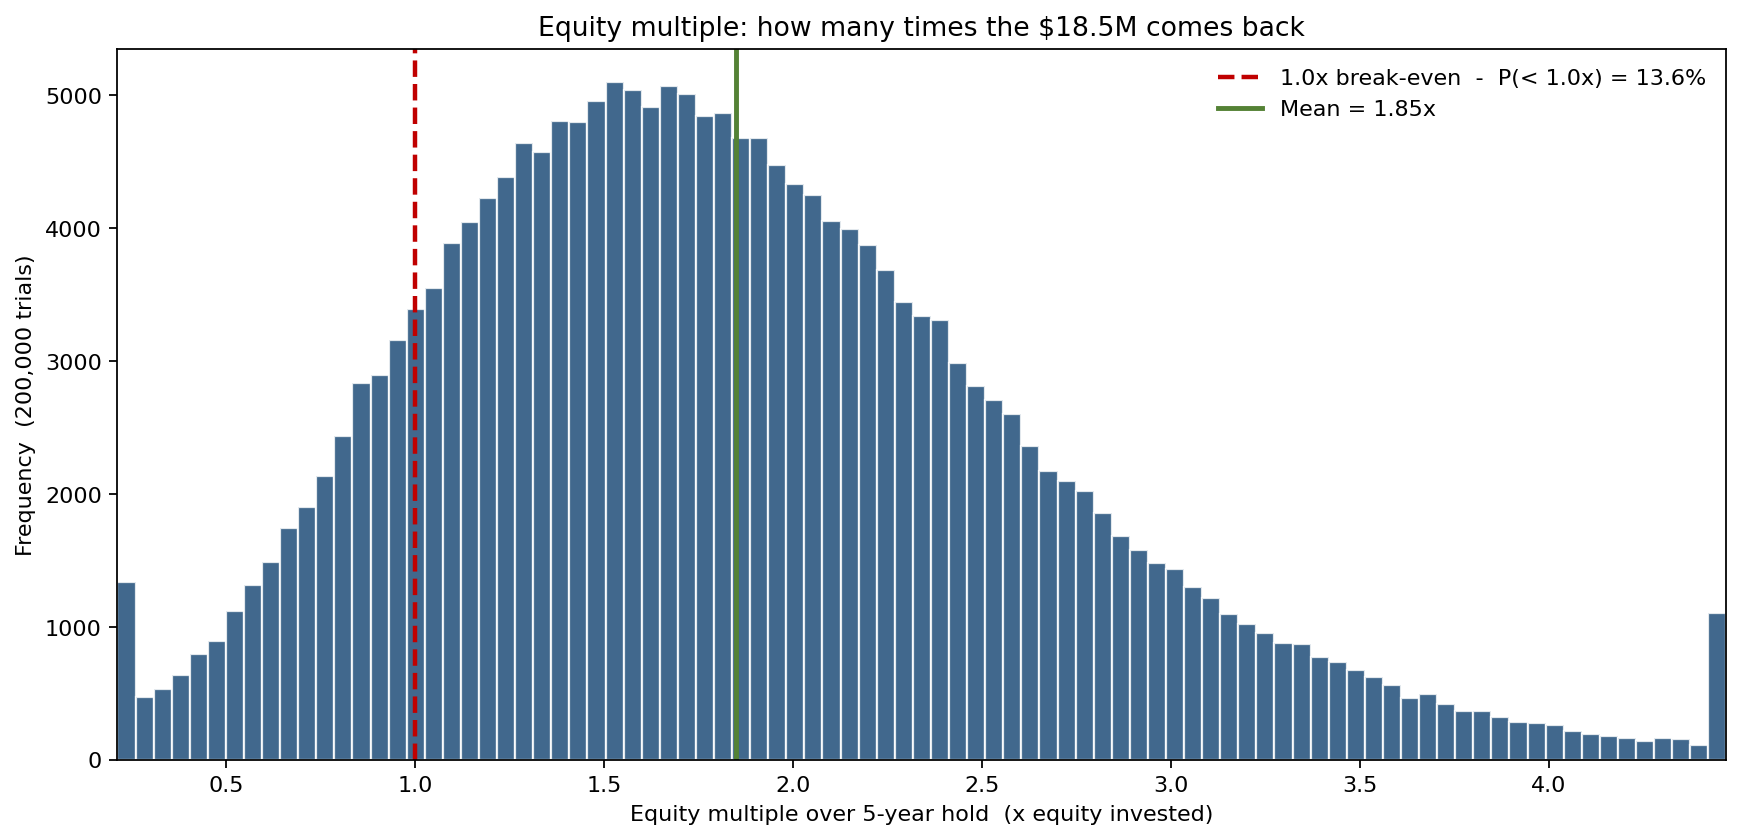
IRR is rate-of-return; the equity multiple is cash-back-on-cash, and limited partners care about both. The mean multiple is 1.85x with a P10-to-P90 range of 0.89x to 2.92x, and the year-1 cash-on-cash averages 6.7%. Critically, 13.6% of holds return less than the $18.5M invested (a multiple below 1.0x) — the same downside the IRR chart flagged, now expressed in the dollars-back language a capital partner reads first.
What the model changed
The committee re-approved the deal, but on different terms. With a 55% hurdle-clear probability and a 13.4% loss probability on the table, the sponsor negotiated the price down and stress-tested the capital stack against the LTV sweep, settling at 65% rather than the 80% the broker pushed — trading eight points of hurdle probability for two points less wipeout risk. The hold was also underwritten to the P10 IRR of -2.5% as the genuine downside case, replacing a base case that had quietly assumed the cycle would cooperate.
ModelRisk functionality used
- Monte Carlo simulation of five years of NOI, financing and a leveraged exit, with a vectorised IRR solved per trial.
- Normal distribution for annual rent growth and the exit cap rate; Beta distribution for annual vacancy; LogNormal for the operating-expense ratio — each bounded to stay physically sensible (no negative rents, cap rates above 3.5%).
- A shared market-cycle factor imposing the negative rent-growth-to-exit-cap correlation (verified at -0.83), so the per-year cash flows do not average into a false-narrow band.
- Threshold sweep of P(IRR >= hurdle) and P(equity loss) across loan-to-value, quantifying leverage as a two-edged choice.
- Sensitivity (tornado) analysis ranking rent growth, the cycle, the exit cap, vacancy and opex by their effect on IRR.
- Multi-metric output reporting the levered IRR, the equity multiple and year-1 cash-on-cash from one simulation, with P(>= hurdle) and P(loss) read directly off the distributions.