

Industry: Real Estate
Product: ModelRisk
Application: Market Trend Analysis
The market is still growing at 4.8% — and there is a 74% chance the trend has turned down
An analyst staring at 24 months of metro price-growth readings faced the question every market-watcher dreads: is the recent softness a real turn, or just noise? The last print was +5.2% — healthy on its face — but it followed a string that had drifted down from the high sevens, with one ugly +2.6% reading in the mix. A naive look at the raw prints (latest versus three months ago) flagged a downturn. ModelRisk gave the honest answer: after stripping measurement noise out of the signal, the underlying trend is still a positive +4.8% (P10 = +3.4%, P90 = +6.2%) — but its slope has rolled over, and the probability the trend has actually turned negative right now is 74%. Growth is positive; momentum is not. Those are different claims, and only one of them should drive a sell decision.
Why a point estimate fails here
This is not a forecasting problem — it is a diagnosis problem. The analyst does not need a path into the future; they need to know what regime the market is in today, given data they cannot fully trust. Every monthly reading carries measurement noise: revisions, thin-sample comparables, mix shift between neighborhoods. A single soft print might be a genuine turn, or it might be the noise term having a bad month.
A deterministic read — "the last number is lower, so we're turning down" — confuses the observation with the signal. It cannot say how confident that verdict is, and it cannot separate the part of the latest reading that is trend from the part that is cycle from the part that is just noise. That separation, and the probability attached to it, is the entire decision.
Modeling the trend as a hidden signal in noisy data
Each observed reading is treated as the sum of three unobserved pieces — a slow-moving trend, a medium-frequency cycle, and measurement noise:
observation_t = trend_t + cycle_t + noise_t
The trend follows a local linear trend (its level and slope each drift as a random walk), the cycle is a persistent AR(1) component, and the noise is Normal with a standard deviation reflecting how much the analyst trusts the data. To recover the hidden pieces, ModelRisk simulates 600,000 candidate latent trajectories and weights each by how well its noiseless signal matches the 24 observed readings under the measurement-noise likelihood — an importance-sampling filter. The weighted candidates form the posterior distribution of the trend, the cycle, and crucially the current slope.
The serial structure was verified in the recovered posterior:
- lag-1 autocorrelation of the trend slope = +0.97 (a persistent random-walk slope, as specified)
- lag-1 autocorrelation of the cycle component = +0.82 (matching the target AR(1) persistence of 0.80)
- effective sample size of the filter = ~1,000 candidates, confirming the posterior is supported by many distinct trajectories rather than a handful.
The decomposition of the latest reading makes the method tangible: of the observed +5.2%, the posterior attributes +4.8% to trend, near 0% to the cycle, and the residual +0.3% to noise. The reading is almost all signal — but the direction of that signal is what's in question.
Pulling the trend out of the noise
The headline chart shows exactly what the filter does: a smooth trend recovered from a scatter of noisy dots.
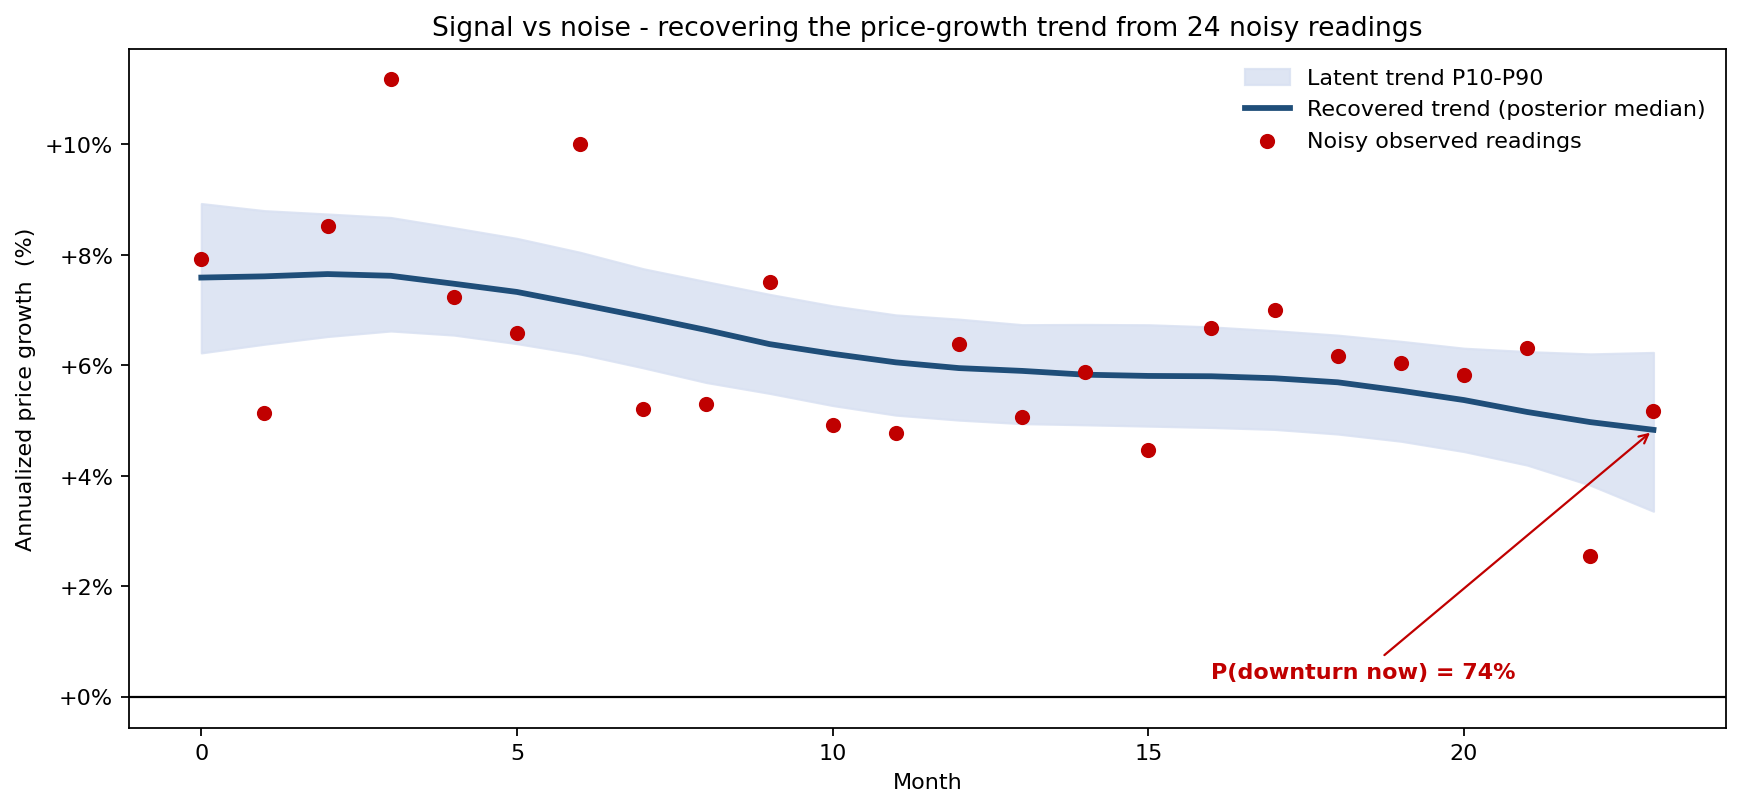
The red dots are the raw readings — bouncing between +2.6% and +11%. The navy line is the recovered trend with its P10–P90 band. It rose into the high sevens early, then rolled steadily down to +4.8% (P10 = +3.4%, P90 = +6.2%) in the latest month. The market is unambiguously still growing; the level never approaches zero. But the line is bending downward, and the annotation reports the consequence: P(downturn now) = 74%. The chart separates two questions the raw data tangles together — "are prices rising?" (yes) and "is the trend turning?" (probably).
Has the trend turned? Read it off the slope
The downturn question is a question about the slope of the trend, not its level. The posterior of that slope answers it directly.
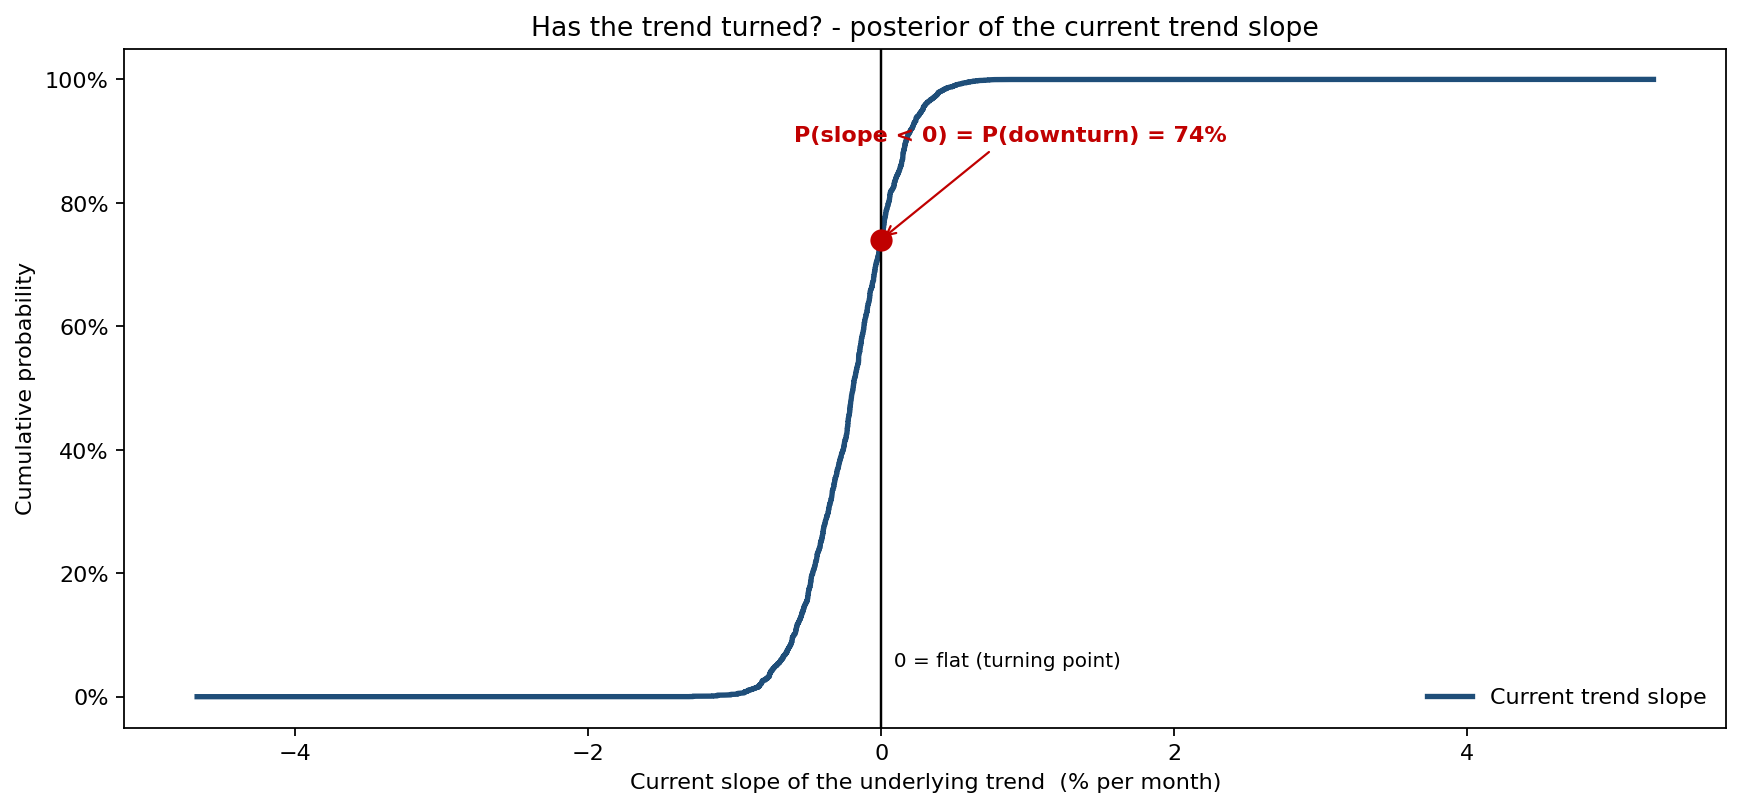
The current slope runs P10 = −0.60, P50 = −0.19, P90 = +0.17 percentage points per month. The median slope is negative — the typical recovered trajectory is decelerating — and the probability mass to the left of zero is 74%. That is the turning-point probability, read straight off the curve where it crosses a flat slope. Note what the chart does not show: the level falling below zero. The market is decelerating, not contracting. A model that only watched the level would see nothing alarming; a model that watches the slope sees a 74%-likely turn.
The verdict depends on how much you trust the data
The single most important — and most subjective — input is how noisy the analyst believes the readings are. Sweeping that assumption shows how much it moves the verdict.
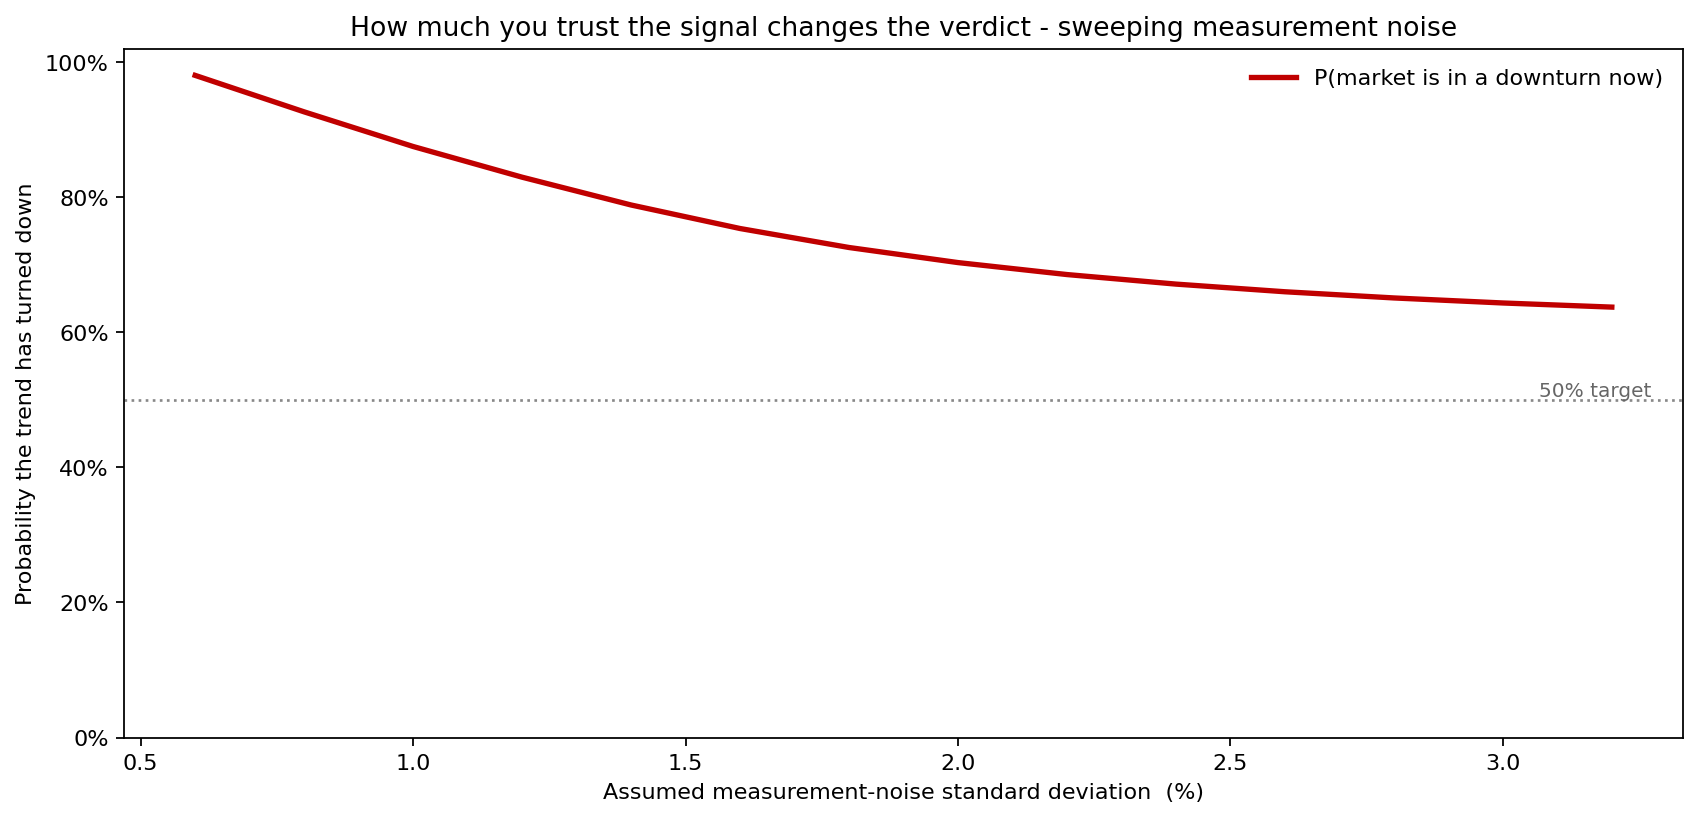
If the readings are treated as nearly clean (noise standard deviation 0.6%), the filter trusts every dip and reports a 98% downturn probability. As the assumed noise rises, the filter discounts the soft prints as possible noise and the probability falls — to 83% at 1.2%, 73% at 1.8%, and around 64% at 3.0% noise. The verdict is real but not certain: across any defensible noise assumption it stays above 60%, so the turn is the base case, but the confidence is a direct function of data quality. This is the honesty a single point estimate cannot offer.
What drives the turning-point probability
Ranking the inputs by their effect on the 74% confirms where the diagnosis is most fragile.
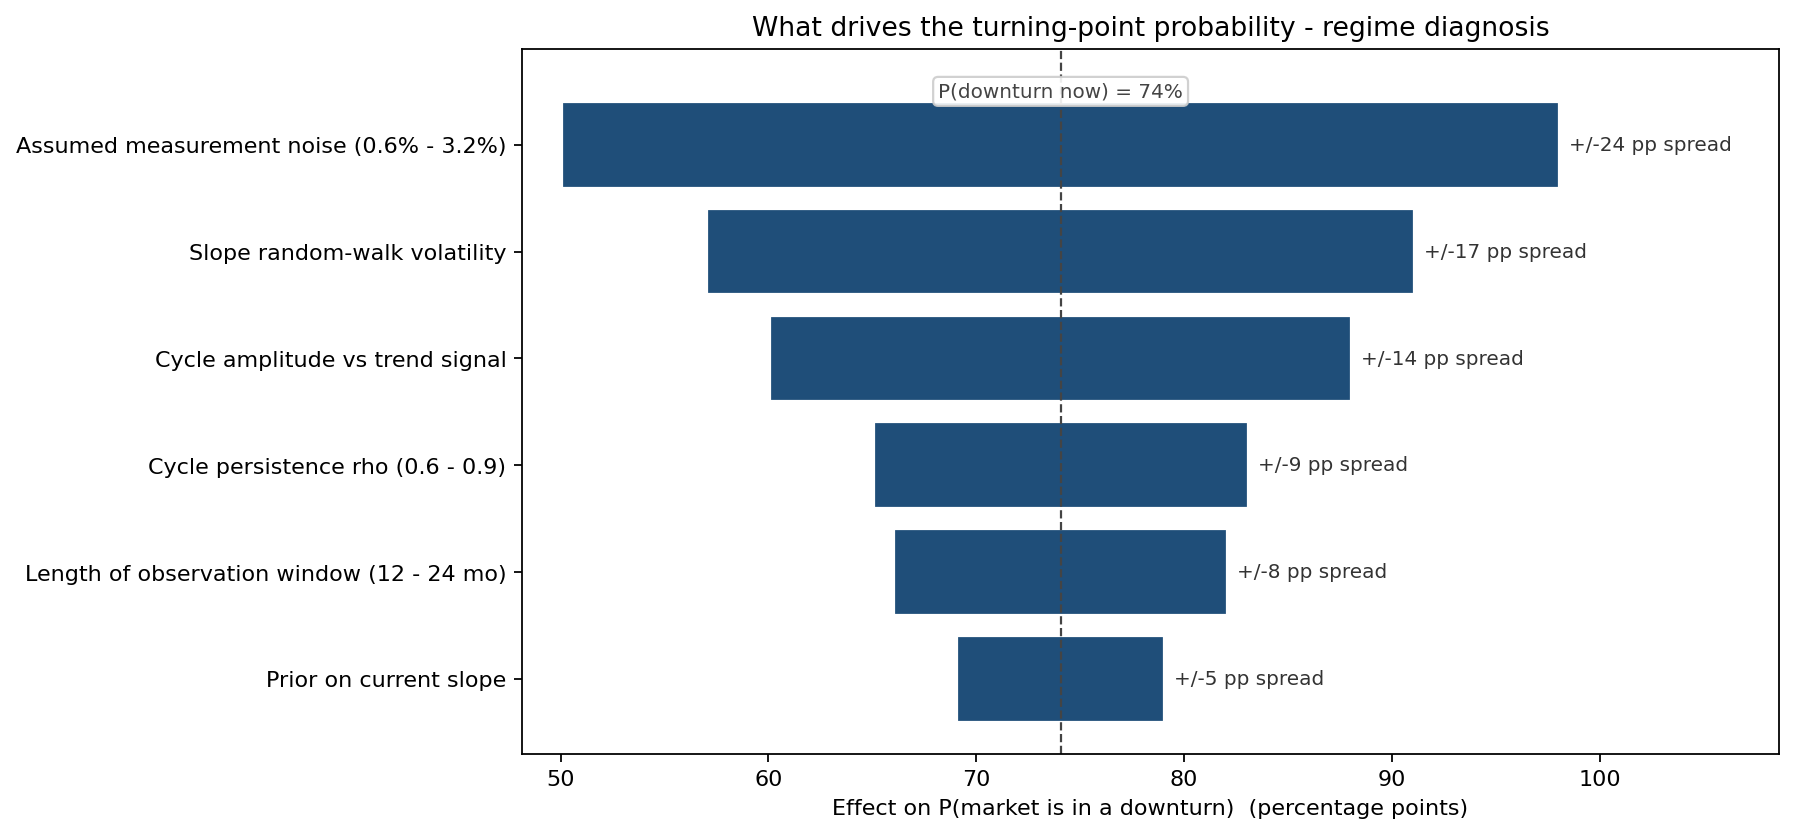
The assumed measurement noise dominates — the analyst's trust in the data matters more than any structural parameter. The slope random-walk volatility and the cycle-versus-trend amplitude follow: if the cycle is large relative to the trend signal, more of the recent softness is attributable to a swing that will revert, lowering the downturn probability. The practical message is that improving data quality (tighter comps, fewer revisions) sharpens the verdict more than any modeling refinement.
What the model changed
The raw-data reflex said "the latest print is soft — sell." The deterministic level said "still +5%, hold." The probabilistic diagnosis reconciled both: the market is still growing, but the trend has a 74%-likely downward turn, and that confidence depends on data quality. The firm now reports a regime probability alongside the headline growth number, treats the slope posterior — not the latest print — as the turning-point signal, and commissions a data-quality review before acting on soft readings, because the tornado showed measurement noise is the swing factor. A turning point is now a probability with error bars, not a hunch off the last data point.
ModelRisk functionality used
- State-space decomposition — each reading split into a local-linear-trend level and slope, an AR(1) cycle, and measurement noise.
- Monte Carlo with importance weighting — 600,000 candidate latent trajectories filtered against 24 noisy observations to form the posterior of the hidden trend and slope.
- Conditional probability outputs — P(current slope < 0) reported as the turning-point probability, read directly from the slope posterior.
- Parameter sweep — the downturn probability traced across assumed measurement-noise levels, quantifying how data trust drives the verdict.
- Tornado sensitivity — the turning-point probability decomposed across noise, slope volatility, and cycle amplitude.
Monte Carlo turns a noisy data series into a distribution over regimes, and only that frame lets an analyst say "prices are still rising, but the trend has most likely turned" — and attach a number to "most likely."