

Industry: Real Estate
Product: ModelRisk
Application: Land Use Planning
A 500-Acre Parcel, Four Land-Use Mixes, and a 42% Chance the Highest-Value Plan Is the Wrong One
A 500-acre parcel has to be carved into residential, commercial and green/open space. The planning team's spreadsheet ranked four candidate mixes on expected value and picked the commercial-heavy mix (25% residential / 55% commercial / 20% green) as the winner at $513M mean site value. The probabilistic rebuild in ModelRisk priced each mix against uncertain, demand-driven value-per-acre — and found that the "winning" mix is outperformed by a different mix in 42% of demand futures. Residential-heavy is the better plan in 33% of outcomes; balanced in 9%. The right to choose the mix after demand reveals itself — rather than committing now — is worth $22M, a number a deterministic ranking cannot produce because it never admits that a different mix could win.
Why a point estimate fails here
Allocating land is an optimisation under uncertainty, and a single expected value hides the one thing that matters: which mix wins depends on which way demand breaks. A deterministic model plugs in mean demand for every use, computes one value per mix, and ranks them. But mean demand never actually occurs. In the futures where office demand is strong, the commercial-heavy mix wins big; in the futures where housing demand leads, the residential-heavy mix wins instead. A point estimate collapses that regime-switching into a single ranking and quietly discards the value of keeping the allocation flexible.
The model also has to get the correlation structure right. All developed land rises and falls with the macro cycle (so the uses are positively correlated and the total cannot be diversified away to a thin band), but residential and commercial also respond to different sector demand — housing demand versus office/retail demand. That divergence is precisely what makes the "which mix wins" question uncertain. Treating the uses as independent, or as perfectly tied to one cycle, would erase the flexibility value entirely.
The value model
Value per acre, three uses. Each use earns an uncertain developed value per acre, built from three layers: a shared macro cycle factor (lifts all developed land together), a sector demand factor (housing demand for residential, office/retail demand for commercial), and an idiosyncratic term. Residential centres at $1.20M/acre, commercial at $1.30M/acre but with higher volatility, and green/open space at $0.30M/acre with a mild counter-cyclical amenity loading — open space holds relative value when the development market softens.
Imposed correlation, verified. The shared macro factor produces corr(residential, commercial) = +0.25 (positive, as intended — the uses are not independent), while the divergent sector factors keep that correlation well below one so the ranking can flip. The counter-cyclical green loading produces corr(residential, green) = -0.38, confirming green space hedges the developed uses.
Absorption haircut. Over-allocating to a single use is penalised by a concave absorption multiplier — the market cannot absorb 55% commercial at full value per acre — so the model does not reward dumping the whole site into the highest-mean use.
Four candidate mixes, all meeting the 20% green-space regulation: residential-heavy (60/20/20), commercial-heavy (25/55/20), balanced (40/35/25) and green-forward (45/20/35).
Total site value by mix
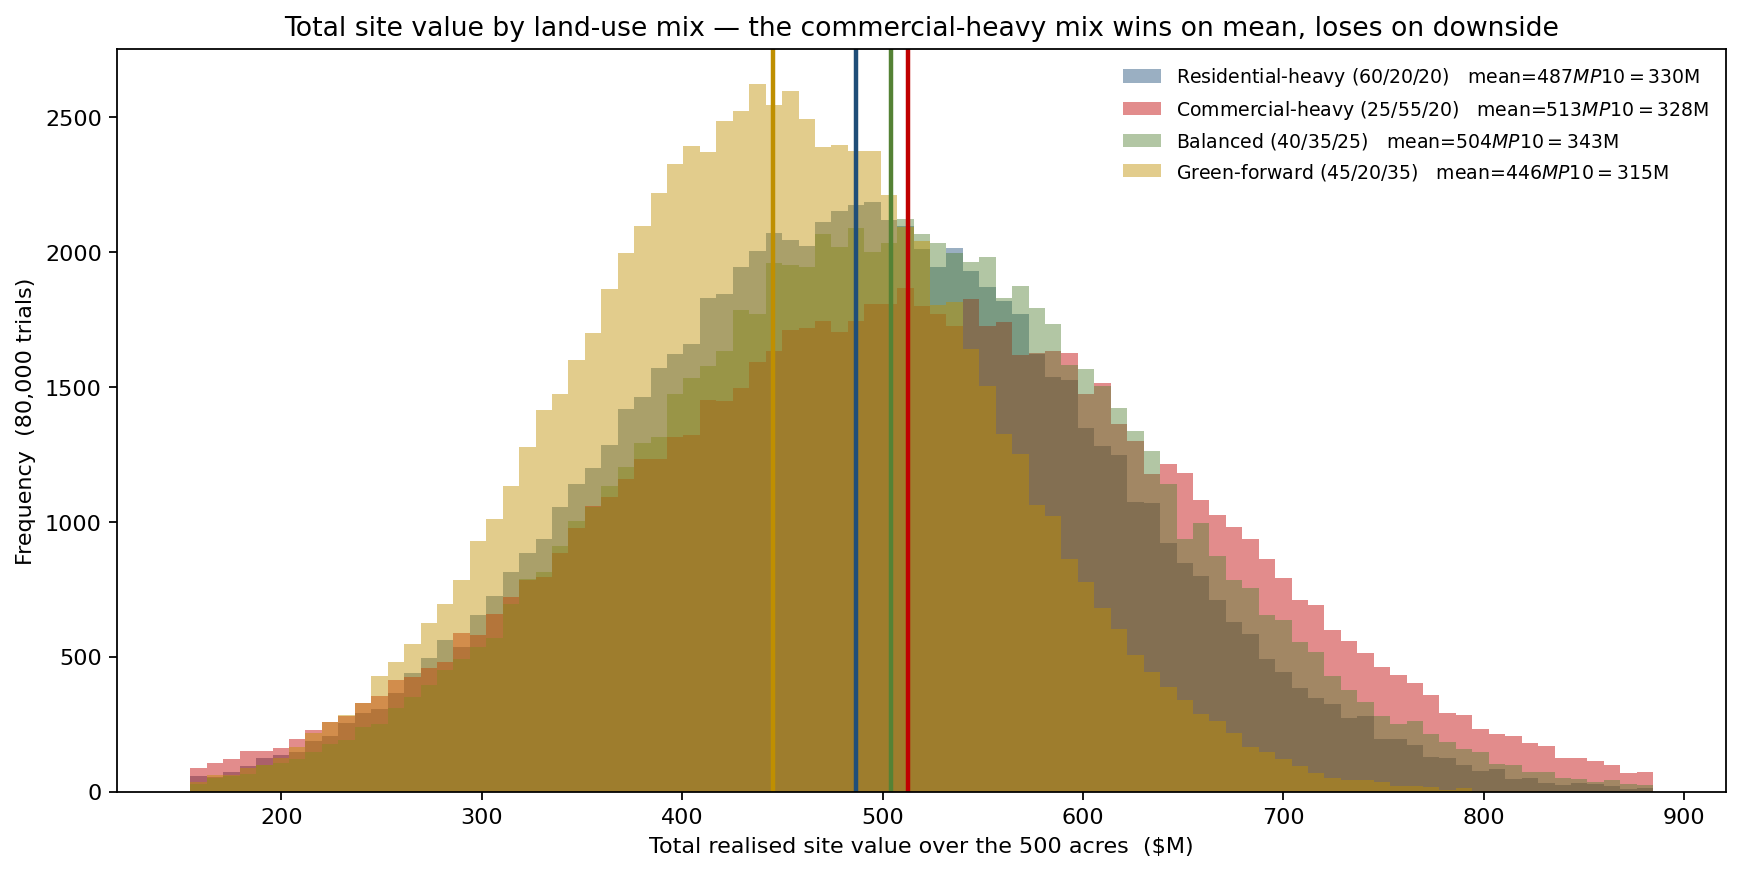
Each mix is a full distribution, not a number. The commercial-heavy mix has the highest mean ($513M) — but also the widest spread (P10 $328M, P90 $697M), because commercial value per acre is the most volatile. The balanced mix ($504M mean) is barely behind on the mean with a tighter body (P10 $343M). Residential-heavy ($487M mean) trades mean for stability, and green-forward ($446M mean) is the conservation-leaning option that sacrifices value for amenity and regulatory goodwill. The overlap between the distributions is the whole point: the commercial-heavy mix is not reliably the best — its lead is a mean, and the distributions cross.
Mean is not the decision — the downside is
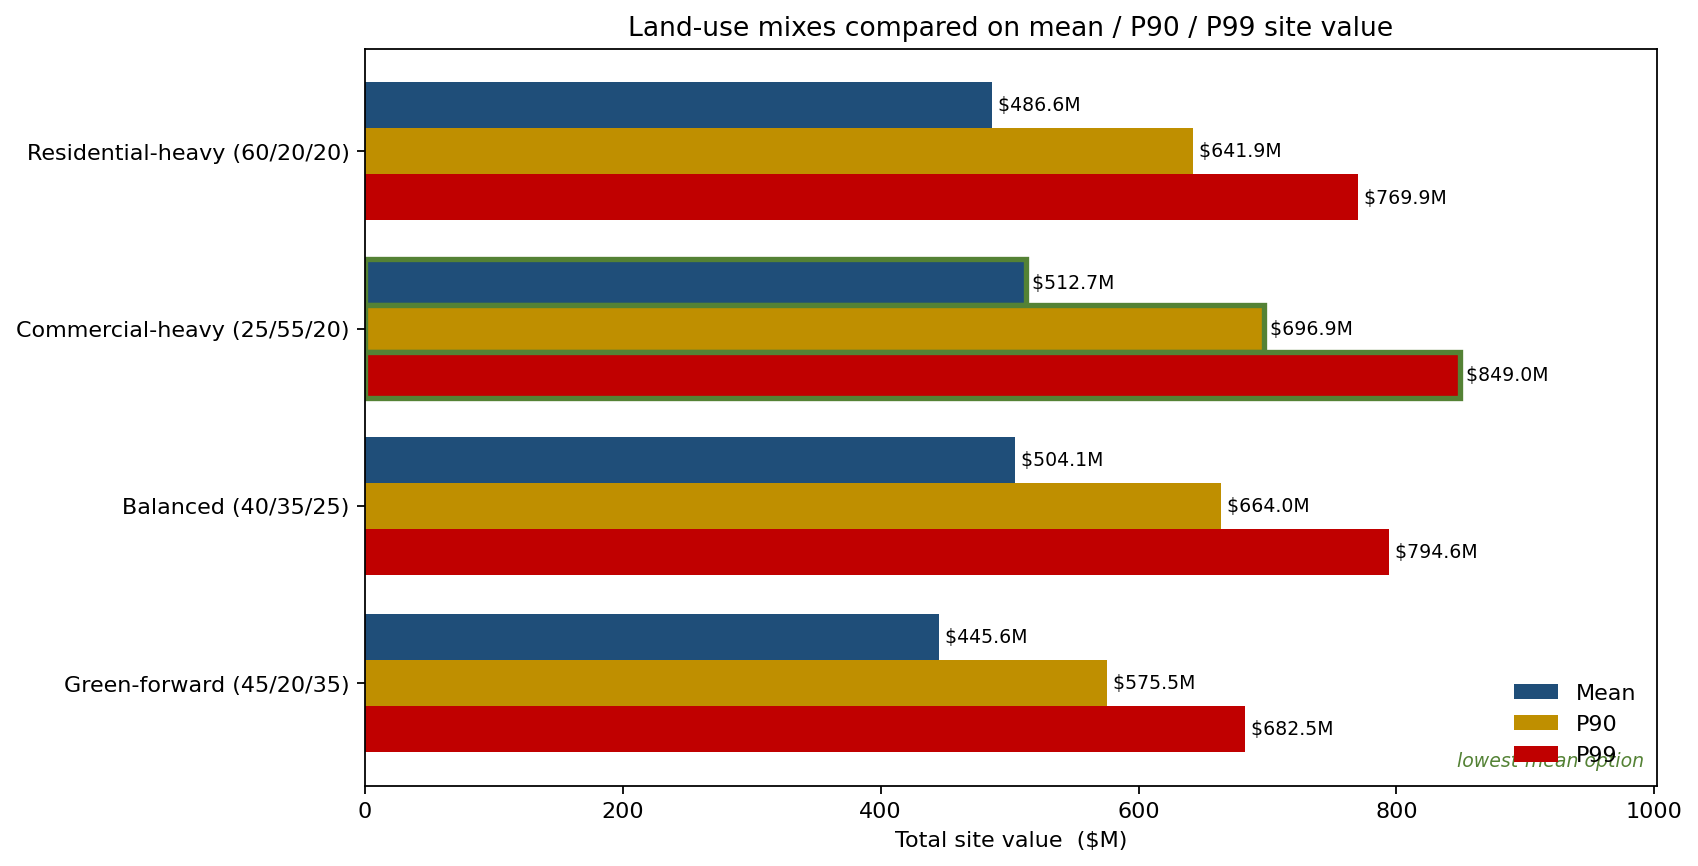
Comparing the mixes on mean, P90 and P99 side by side shows the cost of chasing the top mean. The commercial-heavy mix leads on every percentile (mean $513M, P90 $697M, P99 $849M) because it has the most upside — but that same volatility means its downside (the bottom decile) is no better than the balanced mix, which reaches a $504M mean for materially less spread. For a developer financing the project with debt, where the downside hits coverage ratios and the upside is shared with equity, the balanced mix's tighter distribution can be the better risk-adjusted choice even though it ranks second on mean.
What drives the chosen mix
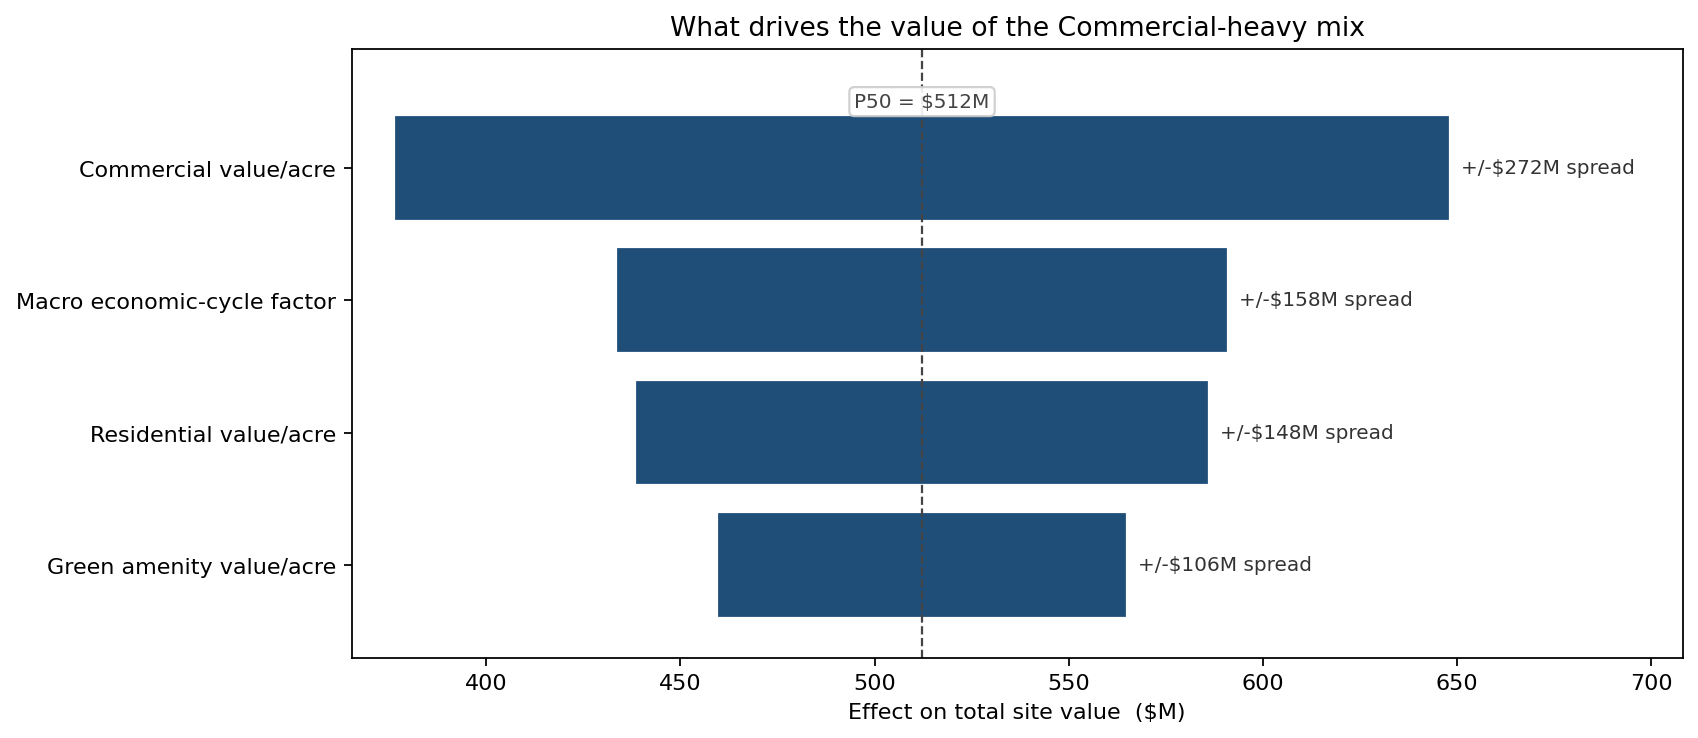
For the commercial-heavy mix, commercial value per acre is by far the largest driver (±$136M) — unsurprising when 55% of the site rides on it. The macro cycle factor (±$79M) and residential value per acre (±$74M) follow, and the green amenity (±$53M, negative) acts as a partial hedge. The concentration of risk in a single use is exactly why the mix is so exposed to which way office demand breaks — and why the flexibility to switch toward residential has value.
No single mix always wins
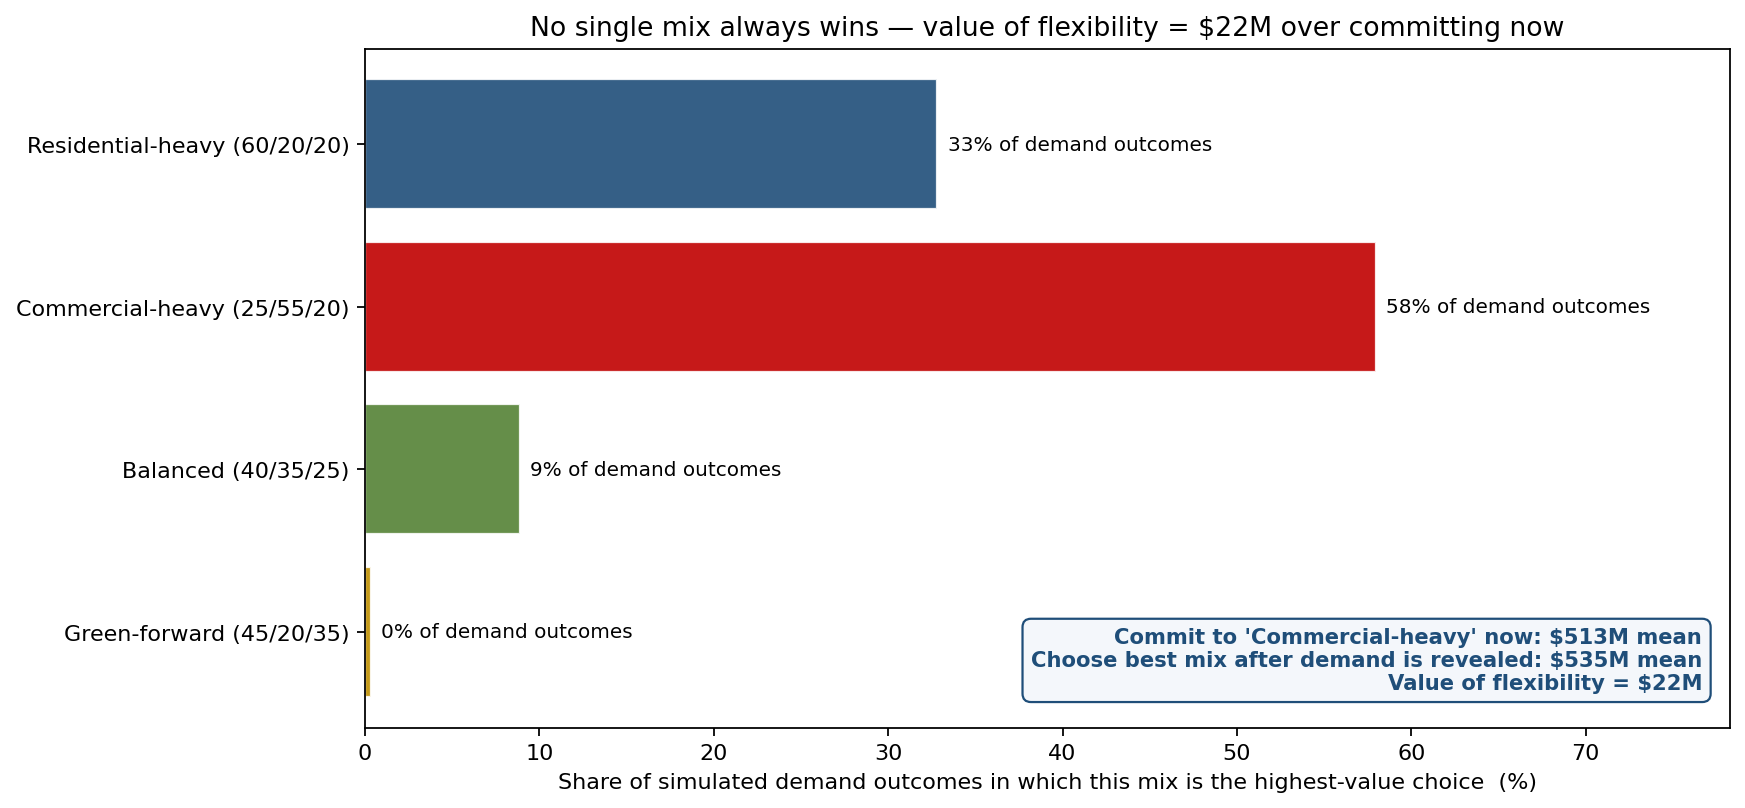
This is the chart the deterministic ranking cannot draw. Across the simulated demand futures, the commercial-heavy mix is the highest-value choice only 58% of the time. Residential-heavy wins 33% of outcomes — every future where housing demand outruns office demand — and the balanced mix wins 9%. Committing now to the highest-mean mix earns $513M on average; retaining the flexibility to pick the best mix after demand reveals itself earns $535M — a $22M value of flexibility. That $22M is the quantified case for phasing the development, writing flexible zoning entitlements, or holding the commercial parcels as options rather than locking the entire allocation up front.
What the model changed
- The "winner" was demoted to a coin-flip-plus. The commercial-heavy mix wins only 58% of demand futures, so the team stopped treating it as the obvious plan.
- A phased, flexible allocation was adopted to capture the $22M value of flexibility — entitling the site for more than one mix and deferring the commercial-versus-residential split until pre-leasing signalled demand.
- The balanced mix became the default fallback, chosen for its tighter downside when the financing structure made the bottom decile the binding constraint.
- Green space was held at the 20% floor as a deliberate hedge, not a regulatory cost — its counter-cyclical value softens the downside in soft-market futures.
ModelRisk Functionality Used
- Layered factor model (shared macro cycle + divergent sector-demand factors + idiosyncratic) — imposing positive cross-use correlation while still letting the best-mix ranking flip across futures.
- Correlation verification confirming the intended structure (residential–commercial +0.25, residential–green −0.38) rather than assuming it.
- Concave absorption haircut preventing the optimiser from over-rewarding a single over-supplied use.
- Best-of comparison across mixes per trial to compute the value of flexibility — the gain from choosing after demand is revealed versus committing now.
- Mean/P90/P99 strategy comparison and rank-correlation tornado to separate the highest-mean mix from the best risk-adjusted mix and to rank the drivers of the chosen plan.
Land-use planning is an allocation decision under uncertainty, and its central question — which mix is best? — has a different answer in different futures. Monte Carlo simulation in ModelRisk is what turns that into a quantified case for flexibility, so the firm pays for optionality where it is worth $22M and commits only where the answer is robust.